Abstract
Background & Aims
Dysplasia is a pre-malignant condition in Barrett's esophagus that is difficult to detect on screening endoscopy because of its flat architecture and patchy distribution. Peptides are promising for use as novel molecular probes that identify cell surface targets unique to disease, and can be fluorescence-labeled for detection. We aim to select and validate an affinity peptide that binds to esophageal dysplasia for future clinical studies.
Methods
Peptide selection was performed using phage display by removing non-specific binders using Q-hTERT (intestinal metaplasia) cells and achieving specific binding against OE33 (esophageal adenocarcinoma) cells. Selective binding was confirmed on bound phage counts, ELISA, flow cytometry, competitive inhibition, and fluorescence microscopy. On stereomicroscopy, specific peptide binding to dysplasia on endoscopically resected specimens was assessed by rigorous registration of fluorescence intensity to histology in 1 mm intervals.
Results
The peptide sequence SNFYMPL was selected and demonstrated preferential binding to target cells on bound phage counts, ELISA, and flow cytometry. Reducing binding was observed on competition with unlabeled peptide in a dose dependent manner, an affinity of Kd = 164 nM was measured, and peptide binding to the surface of OE33 cells was validated on fluorescence microscopy. On esophageal specimens (n=12), the fluorescence intensity (mean±SEM) in 1 mm intervals classified histologically as squamous (n=145), intestinal metaplasia (n=83), dysplasia (n=61) and gastric mucosa (n=69) was 46.5±1.6, 62.3±5.8, 100.0±9.0, and 42.4±3.0 arb units, respectively.
Conclusions
The peptide sequence SNFYMPL binds specifically to dysplasia in Barrett's esophagus, and can be fluorescence-labeled to target pre-malignant mucosa on imaging.
Keywords: peptide, Barrett's, esophagus, dysplasia, early detection
Introduction
The incidence of esophageal adenocarcinoma is growing at a rate faster than that of any other cancer in industrialized countries [1]. Barrett's esophagus is a known precursor condition that is associated with prolonged exposure to gastric acid and bile reflux [2], recognized endoscopically by a salmon-red color [3], and confirmed histologically as intestinal metaplasia [4]. Barrett's mucosa has a greater relative risk for progression to cancer than normal esophagus by about 30 to 125 times [5]. Critical for screening of these patients is early detection and localization of dysplasia, a pre-malignant condition that represents a significantly increased absolute risk for future progression to adenocarcinoma [6]. White light endoscopy has had limited effectiveness for screening because these lesions are usually flat in architecture and patchy in distribution. Consequently, random four-quadrant biopsy is recommended [7], but this technique has not been shown to reduce the rate of progression to adenocarcinoma [8]. Thus, new methods for the early detection of cancer in patients with Barrett's esophagus are needed.
Transformed cells and tissues express molecular changes well in advance of morphological alterations, thus provide a unique opportunity for early detection. Better results for the detection of dysplasia in Barrett's esophagus may be achieved with use of exogenous probes that target unique protein expression patterns. Peptides have tremendous potential for clinical use as molecular probes because of their high clonal diversity, small size, and compatibility with fluorescence dyes. Moreover, peptides exhibit rapid binding kinetics, a property that is desirable for in vivo use [9]. Moreover, they can be topically administered to the luminal surface for binding to cell surface targets with low likelihood for immunogenicity and toxicity. Recently, we have demonstrated a FITC-labeled septapeptide VRPMPLQ to distinguish between dysplasia and normal colonic mucosa in vivo using a confocal microendoscope [10]. These results demonstrated preferential binding to dysplastic rather than nearby normal colonocytes.
Recently, new endoscopes have been developed that are sensitive to fluorescence and can rapidly visualize the entire surface of the distal esophagus [11]. These instruments have demonstrated sufficient sensitivity to localize dysplasia stained with fluorescent-labeled affinity peptides [12]. Dysplastic lesions can be as small as a millimeter in size or less, and can be difficult to localize within regions of intestinal metaplasia that typically have a size of several centimeters. Thus, a rigorous method for validating peptide binding that accurately registers the fluorescence intensities with histology is needed. Because in vivo validation with biopsy must overcome challenges associated with motion artifact caused by esophageal peristalsis, respiratory motion, and heart beating, this process may be performed more accurately ex vivo. Here, we aim to select a peptide that affinity binds to cell surface targets on dysplastic mucosa in Barrett's esophagus, and validate selective binding to foci of dysplasia, demonstrating promise for future in vivo use as a novel screening tool.
Materials and Methods
Cell Culture
Human OE33 (esophageal adenocarcinoma) and H460 (lung large cell carcinoma) cells were maintained in either RPMI-1640 or DMEM media, respectively, supplemented with 10% fetal bovine serum (FBS), 100 U/mL penicillin and 100 μg/mL streptomycin (Mediatech, Manassas, VA) [13,14]. Human Q-hTERT (KR-42421, intestinal metaplasia) cells were maintained in keratinocyte serum free media supplemented with 50 μg/mL bovine pituitary extract (BPE) and 0.005 μg/ml human recombinant epidermal growth factor (rEGF) (Invitrogen, Carlsbad, CA) [15]. All cells were incubated at 37°C in 5% CO2.
Phage Selection
Peptide selection was performed using phage display (Ph.D.-7, New England Biolabs, Beverly, MA) [16,17], and a biopanning strategy based on a subtractive whole cell approach [18,19]. OE33 and Q-hTERT cells were grown to log-phase, detached with cell dissociation buffer (Invitrogen, Carlsbad, CA), and immersed in blocking buffer, consisting of PBS with 1% bovine serum albumin (BSA), for 30 min on ice. The clearance step was performed by incubating 107 Q-hTERT cells with 1.5×10¹¹ plaque-forming units (pfu) of phage, displaying random peptides with a diversity of 109, in 5 ml PBS for 30 min at room temperature (RT). The cells were then spun down at 2000 rpm for 6 min at 4°C. The supernatant, containing unbound phage, was then used for negative selection against Q-hTERT cells again for 2 more rounds, removing additional non-specific binders.
For positive selection, the depleted phage supernatant was biopanned against 107 OE33 cells in blocking buffer for 20 min at RT. The OE33 cells were washed 3 times with PBS containing 0.2% Tween-20 to remove the unbound phage. The bound phage were then eluted with 1 ml of 0.2 M glycine (pH 2.2) containing 0.1% BSA for 8 min, and immediately neutralized with 200 μl of 1 M Tris (pH 9.5). The eluted phage was amplified, precipitated and tittered per manufacturer instructions. The resulting phage (1011 pfu) was used to perform another round of clearance, as described above, followed by 3 additional biopanning rounds against the OE33 cells, enriching the candidate pool. In the last 2 rounds, weaker binding phage were removed by washing with 0.2 M glycine in 0.1% BSA for 2 min before the bound phage were eluted. After the final selection, 60 clones of the eluted phage were selected for DNA sequencing.
Bound Phage Counts
Preferential binding of the candidate phage to OE33 cells was validated by bound phage counts. The candidate and wild-type (WT) phage (no insert) (M13KE, New England Biolabs, Beverly, MA) were amplified, precipitated and tittered per manufacturer instructions. OE33, H460 and Q-hTERT cells (107 cells each) were grown to log-phase, detached, and blocked, as described above, in triplicate. A total of 2×10¹¹ pfu of either the candidate or WT phage were incubated with these cells for 20 min with gentle agitation at RT. After washing 3 times with PBS/0.2% Tween-20 and once with 0.2 M glycine/0.1% BSA for 2 min, the bound phage were eluted from the cells by washing with the same glycine solution for 6 min and tittered.
Phage Capture ELISA
Preferential binding of the candidate phage to OE33 cells was also validated by phage capture ELISA. OE33, H460 and Q-hTERT cells were prepared as described above, and incubated with 2×10⁷ pfu of either candidate or WT phage for 20 min at RT in triplicate. After washing with PBS/0.2% Tween-20 for 3 times and 0.2 M glycine/0.1% BSA for 2 min, followed by neutralization with 1 M Tris, the cells were spun down at 2000 rpm for 7 min at 4°C, and incubated with anti-M13 antibody (IgG) conjugated to horseradish peroxidase (HRP) (Amersham, Piscataway, NJ) for 30 min on ice. After washing 3 times with PBS/0.2% Tween-20 and once with 0.2 M glycine, pH 2.2/0.1% BSA for 2 min, tetramethylbenzidine (TMB) substrate (Sigma, Saint Louis, MO) was added to the cells after neutralization. The optical density (absorbance) was measured at 450 nm. Untreated cells were used as controls.
Peptide synthesis
The candidate peptides were synthesized using standard solid phase FMOC (Fluorenyl-MethOxy-Carbonyl) chemistry [20]. A GGGSK linker was added to the C-terminus for FITC labeling. This arrangement exposes the peptide for binding with the same orientation as that on the phage. In addition, this linker has the same amino acid sequence (GGGS) as that which fuses the peptides to the pIII coat protein of the M13 bacteriophage, and is terminated with a lysine (K). The compound was purified to 95% by HPLC and analyzed using reverse-phase HPLC and mass spectrometry. A control peptide with sequence GGGAGGGAGGGK was also synthesized and FITC-labeled. This sequence of glycines (G) and alanines (A), terminated with lysine, has the same size as that of the candidate peptides, but does not have functional groups on the amino acid side chains to enable binding.
Competitive Binding Assay
Preferential binding of the candidate peptide to OE33 cells was validated by a competitive binding assay. A total of 107 OE33 cells were grown to log-phase, detached, and blocked, as described above. The cells were then incubated with 2×10¹¹ pfu of the candidate phage in triplicate. The candidate peptide was then added at concentrations of 100, 200, 400 and 800 μM, and the control peptide was added at a concentration of 400 μM. After washing 3 times with PBS/0.2% Tween-20 and once with 0.2 M glycine/0.1% BSA for 2 min, the bound phage were recovered and tittered.
Measurement of Binding Affinity
The binding affinity of the candidate peptide to the OE33 plasma membrane was determined using a constant number of cells and measuring the fluorescence intensity as the concentration of bound peptide increased to saturation [21]. The FITC-labeled peptide was serially diluted in PBS at concentrations that varied from 0 to 200 μM in 25 μM increments, and incubated with 106 OE33 cells at RT for 20 min. After washing 3 times with cold PBS/0.2% Tween-20 solution, the unbound peptide was rinsed off. The cells were kept moist by adding 200 μL PBS, and the fluorescence intensity I was measured with 485 nm excitation and 525 nm emission on a multi-well plate reader (CytoFluor Series 4000, Applied Biosystems Inc, Foster City, CA). The equilibrium dissociation constant Kd = 1/Ka was calculated by performing a least squares fit of the data to the non-linear equation I = (I0 + ImaxKa[X])/(I0 + Ka[X]). I0 and Imax are the initial and maximum fluorescence intensities, corresponding to no peptide and at saturation, respectively, and [X] represents the concentration of the bound peptide. Origin 6.1 data analysis software (OriginLab Corp, Northampton, MA) was used.
Fluorescence-Activated Cell Sorting (FACS) Analysis
Preferential binding of the candidate peptide to OE33 cells was also validated on flow cytometry. OE33, H460, and Q-hTERT cells (106) were grown, detached, and blocked, as described above. These cells were incubated with the candidate and control peptides after FITC labeling at a final concentration of 10 μM for 20 min on ice. The cells were then washed with cold PBS/0.2% Tween-20 for 3 times and suspended in 1 mL PBS. Flow cytometry was performed on each sample (BD® LSRII, BD Biosciences, San Jose, CA) and the results were analyzed using Flowjo analysis program.
Fluorescence Microscopy
Preferential binding of the candidate peptide to OE33 cells was also validated on fluorescence microscopy. OE33, H460, and Q-hTERT cells were grown in four-chamber slides to 80% confluence. Blocking of non-specific binding was performed by adding PBS/0.5% BSA. The cells were then incubated with 10 μM of either the FITC-labeled candidate or control peptide for 10 min at RT. After washing with PBS/0.2% Tween-20 and fixed in 4% praformaldehyde on ice for 5 min, the cells were mounted with ProLong® Gold reagent containing DAPI (Invitrogen, Carlsbad, CA). Fluorescence images were collected with a Zeiss Axioskop 2 plus microscope.
Fluorescence Stereomicroscopy
Preferential binding of the candidate peptide to dysplastic mucosa in Barrett's esophagus was validated on fluorescence stereomicroscopy. Patients with previously diagnosed dysplasia who were referred for an endoscopic mucosal resection (EMR) were recruited. IRB approval was obtained from the University of Michigan and informed consent was acquired. After resection, the specimens were rinsed in PBS to remove debris, and then incubated with either the FITC-labeled candidate or control peptide at a concentration of 100 μM for 5 min. The unbound peptide was rinsed off with PBS. The mucosal surface of the specimen was oriented face up, and a dab of ink was applied to the at middle of the upper border. This landmark is used to register the white light and fluorescence images with histology. A white light image was collected from the specimen with and without an overlying transparent grid that contains squares with dimensions of 1×1 mm2. Fluorescence images were collected at 12 ms per frame without the grid using a stereomicroscope (Olympus SZX-16) with 477–500 nm excitation and 500-630 nm emission.
A correction to the fluorescence images was performed to allow for quantitative analysis over the entire field of view. The fluorescence intensity is sensitive to the distance between the detector and the tissue, which is greater at the periphery than in the center. A fluorescence image was collected from a solution of FITC in a plate to provide a uniform target for calibrating the stereomicroscope's non-uniform illumination pattern. Noise in the calibration image was reduced using a 5 point Gaussian blur function. The resulting intensities range in value from a min of 0 to a max of 256, and appear in the fluorescence image over a linear gradation from black to white. After the fluorescence intensities were corrected, lines along the length of the specimen spaced by 2 mm intervals in each image were identified using the grid from the white light image. The mean intensity from each 1 × 1 mm2 interval along this length of tissue was calculated using NIH Image J, and compared to histology.
Histological Evaluation
The specimens were fixed in formalin overnight, and tissue sections were cut along the lines evaluated by fluorescence, using ink landmark for registration. Histopathological interpretation of each section was performed by a gastrointestinal pathologist (HA) in 1 mm intervals from longitudinal sections, and classified as 1) squamous, 2) intestinal metaplasia, 3) dysplasia (low and high-grade), or 4) gastric mucosa for comparison to the average fluorescence intensity in 1 mm2 squares. Cancer, inflammation, and indefinite for dysplasia were not included. Since the histology was being compared to fluorescence from the bound peptides on the mucosal surface, the diagnostic criteria used was based solely on the nuclear and cytoplasmic features within the epithelium, the superficial layer of the mucsoa. Non-dysplastic epithelium was identified by the presence of small uniform nuclei located predominantly at the base of the cells with focal stratification up to half of the cell height. Dysplastic epithelium was identified by the presence of larger, less uniform nuclei that stratify extensively and by the presence of little or no cytoplasmic mucin. For mixtures of intestinal metaplasia, low-grade dysplasia (LGD) and high-grade dysplasia (HGD), the most advanced histology present was assigned to each 1 mm interval.
Statistical Analysis
For the EMR specimens, a log transformation of the fluorescence intensities for each of the 4 histological classifications was performed to approximate normality. Differences in the mean intensity for all classifications were first compared using a two-way ANOVA, and then differences in the mean value between classifications were evaluated using Tukey's multiple comparisons of the means. Statistical significance was assessed at the 0.01 level. For all of the other validation methods, a comparison of the difference in the mean findings between two groups was performed using a two-sided Student's t-test with unequal variance, and statistical significance was assessed at the 0.05 level. All results are presented as mean ± standard deviation unless otherwise noted.
Results
Phage Selection
After completion of biopanning, plaques from a total of 60 phage that demonstrated preferential binding to the OE33 cells were selected. We found that 48 out of these 60 clones (80%) contained the identical DNA sequence, and corresponded to the peptide with amino acid sequence SNFYMPL. The other 12 clones expressed different unique amino acid sequences. All of the sequences were analyzed with the National Center of Biotechnology Information BLAST (Basic Local Alignment Search Tool). While complete homology for the entire sequence was not found, this peptide does have partial homology to the Atrophin-1-like protein (5 of 7 amino acids, SN/HPFYMPL), which has increased expression in tumor cells [22].
Bound Phage Counts
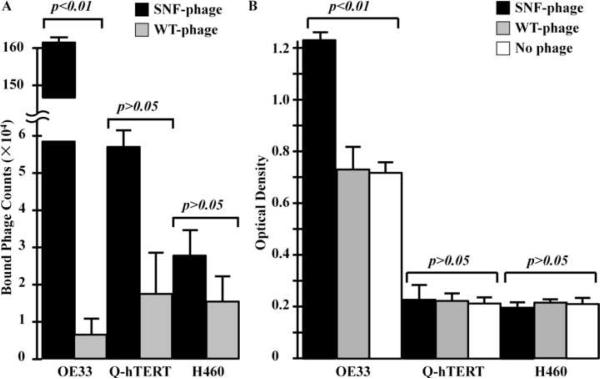
On bound phage counts, a total of 161±14.6×10⁴ SNFYMPL phage demonstrated affinity binding to the OE33 cells in comparison to 0.65±0.53×10⁴ for WT-phage (p<0.01), as shown in Fig. 1A. This finding represents a specificity ratio (SNFYMPL-to-WT) of ~250×. Furthermore, we found a total of 5.8±1.3×10⁴ SNFYMPL phage demonstrated affinity binding to the Q-hTERT cells in comparison to 1.8±1.3×10⁴ for the WT-phage (p>0.05). The number of SNFYMPL and WT-phage that demonstrated affinity binding to the H460 cells are 2.8±0.62×10⁴ and 1.57±0.7×10⁴ (p>0.05), respectively. These results suggest that the SNFYMPL phage binds specifically to the OE33 (target) cells and not to the Q-hTERT and H460 (control) cells.
Fig. 1.
Preferential phage binding to OE33 cells. A) Bound phage counts showed increased binding of SNFYMPL phage to OE33 cells in comparison to WT-phage (p<0.01), representing a specificity factor >250. No significant difference was found for this phage to the control cells Q-hTERT and H460. B) Phage capture ELISA revealed a greater optical density for binding of SNFYMPL phage to the OE33 cells compared that for WT-phage (p<0.01) and no phage. No significant difference was found for binding of SNFYMPL phage to the control cells.
Phage Capture ELISA
On the phage capture ELISA assay, the optical density (O.D.) for binding of the SNFYMPL phage to the OE33 cells is 1.23±0.06 compared to that of 0.73±0.08 and 0.72±0.04 for the WT-phage (p<0.01) and for no phage (p<0.01), respectively, as shown in Fig. 1B. The O.D. for binding of the SNFYMPL phage to the Q-hTERT cells is 0.231±0.063 compared to that of 0.225±0.030 and 0.210±0.011 for the WT-phage (p>0.05) and for no phage (p>0.05), respectively. The O.D. for the H460 cells was found to be 0.198±0.02, 0.211±0.012 and 0.213±0.008 for the SNFYMPL phage, WT-phage (p>0.05), and no phage (p>0.05), respectively. The results suggest that the SNFYMPL phage binds specifically to the OE33 (target) cells and not to the Q-hTERT and the H460 (control) cells. Furthermore, WT-phage and no phage shows no evidence specific binding to any of the 3 cells, as expected.
Competitive Binding Assay
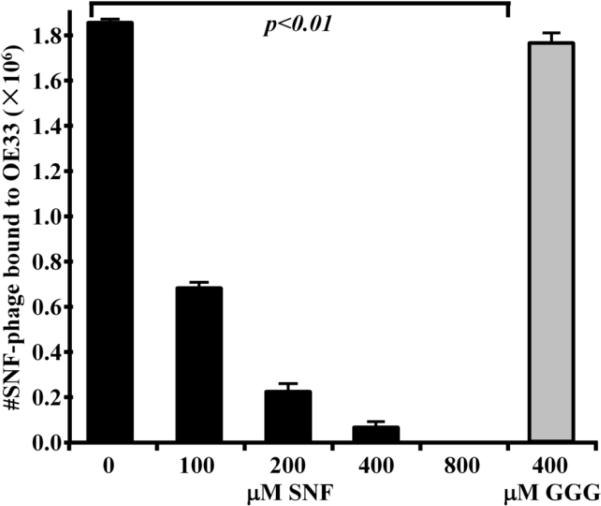
In the competitive binding assay, we found a total of 1850±14×103 SNFYMPL phage demonstrated affinity binding to the OE33 cells in the absence of competition, as shown in Fig. 2. We observed that the addition of 100, 200, 400, and 800 μM of the unlabeled SNFYMPL peptide with GGGSK linker (SNFYMPLGGGSK) resulted in a significant reduction in the number of bound phage, corresponding to values of 680±22×103, 22±4×10³, 6±2×10³, and 0 (p<0.01), respectively. Moreover, we did not see a change in the number of bound phage with the addition of 400 μM of the control peptide (GGGAGGGAGGGK), which resulted in a total of 1760±41×103 bound phage (p<0.01). These results suggest that the SNFYMPL peptide can compete with the SNFYMPL phage for binding to the OE33 plasma membrane, and that binding is determined by the specific sequence of the expressed peptide, rather than by the phage coat proteins.
Fig. 2.
Competition binding assay. Binding of SNFYMPL phage to OE33 cells is reduced by competition with increasing concentrations of SNFYMPL peptide (p<0.01) in a dose dependent manner. The addition of the control peptide at a concentration of 400 μM revealed no competitive inhibition.
Measurement of Binding Affinity
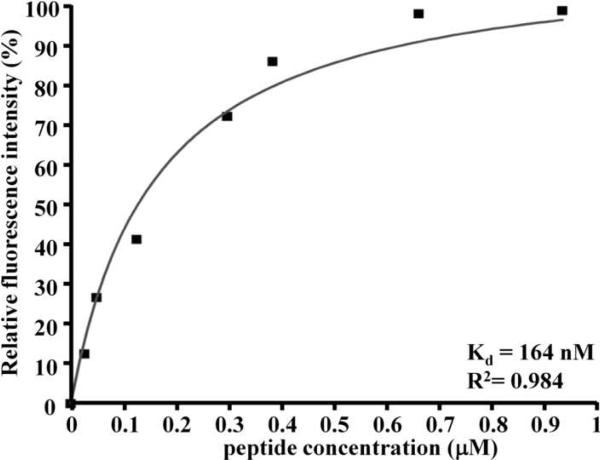
The relative fluorescence intensity at 525 nm as a function of the concentration of the fluorescent-labeled SNFYMPL peptide with GGGSK linker and FITC label (SNFYMPLGGGSK-FITC) bound to the OE33 cells is shown in Fig. 3. A non-linear increase in intensity is observed until saturation is reached at a concentration of bound peptide of 0.93 μM. A regression of this data results in an equilibrium association and dissociation constants of Ka = 6.10×10⁶ M−1 and Kd = 164 nM (R2 = 0.984), respectively. This result suggests that the SNFYMPL peptide binds to the OE33 plasma membrane with high affinity.
Fig. 3.
Peptide binding affinity. The affinity for binding of SNFYMPL peptide to OE33 cells is determined from a non-linear fit of the relative fluorescence intensity to concentration of bound peptide, and reveals an equilibrium dissociation constant of Kd = 164 nM (R2 = 0.984).
Fluorescence-Activated Cell Sorting (FACS) Analysis
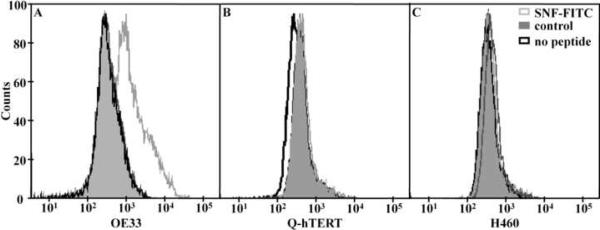
The specific binding activity of the fluorescent-labeled peptide (SNFYMPLGGGSK-FITC) to OE33 cells was validated by FACS analysis, as shown in Fig. 4. The mean fluorescence result for binding of this peptide to OE33 cells is 2613 compared to 441 and 462 for the fluorescent-labeled control peptide (GGGAGGGAGGGK-FITC) and for no peptide, respectively. Furthermore, the mean fluorescence result for binding of candidate peptide to Q-hTERT cells is 464 compared to 460 and 398 for the control peptide and no peptide. In addition, the mean fluorescence values for binding to the H460 cells are 502, 470 and 474 for the candidate, the control and no peptide, respectively. These results suggest that the fluorescent-labeled candidate peptide has specific binding activity to the OE33 (target) cells and not to the Q-hTERT and H460 (control) cells.
Fig. 4.
FACS analysis. A) The mean value for the fluorescence-labeled SNFYMPL peptide (gray line) binding to OE33 cells on FACS is 2613 compared to 441 and 462 for the control peptide (shaded) and cells only (black line). Minimal differences were observed in the mean value for peptide binding to the control cells B) Q-hTERT and C) H460.
Fluorescence Microscopy
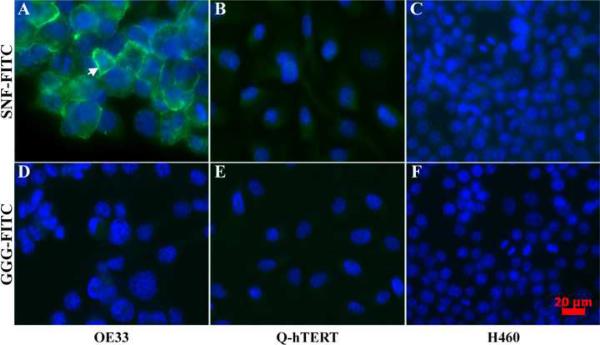
On fluorescence microscopy, the fluorescent-labeled candidate peptide (SNFYMPLGGGSK-FITC) was found to bind to the plasma membrane on >90% of OE33 cells and to <1% of Q-hTERT and H460 cells, as shown by the images in Fig. 5, scale bar 20 μm. The overlay of the peptide and DAPI stained images reveals the spatial extent of the cell nuclei, and demonstrates affinity binding of the SNFYMPL peptide to the plasma membrane of the OE33 cells, as shown by the arrow in Fig. 5A, and not to the Q-hTERT or H460 cells, as shown in Fig. 5B and C, respectively. By comparison, the fluorescent-labeled control peptide (GGGAGGGAGGGK-FITC) did not bind to the OE33, Q-hTERT, and H460 cells, as shown by in Fig. 5D, E, and F, respectively.
Fig. 5.
Fluorescence microscopy. The SNFYMPL peptide binds to the plasma membrane (arrow) of A) OE33 cells but not to that of the control cells B) Q-hTERT or C) H460, scale bar 20 μm. The control peptide demonstrates minimal binding to D) OE33, E) Q-hTERT, and C) H460 cells.
Fluorescent Stereomicroscopy
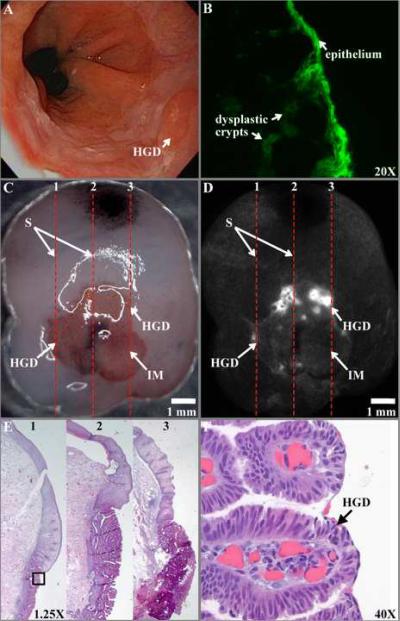
On white light endoscopy, a foci of HGD reveals minimal architecture features (Fig. 6A). A fluorescence photomicrograph shows the FITC-labeled peptide binding to dysplastic epithelium and to sub-surface crypts, magnification 20× (Fig. 6B). On stereomicroscopy of the resected specimen (Fig. 6C), squamous (S) epithelium and intestinal metaplasia (IM) can be identified by color, pink and red, respectively, but not HGD, scale bar 1 mm. The dashed red lines (1–3) are spaced 2 mm apart and identify lines for registering fluorescence to histology. Increased intensity can be seen from FITC-labeled peptide bound to foci of HGD on the fluorescence image (Fig. 6D). Histology cut along the lines (1–3) is evaluated in 1 mm intervals, magnification 1.25× (Fig. 6E). HGD (expanded view of black box in 6E) is identified histologically by large, non-uniform stratified nuclei and lack of cytoplasmic mucin, magnification 40× (Fig. 6F).
Fig. 6.
Dysplasia in Barrett's esophagus. A) On white light endoscopy, a flat foci of HGD is present. B) A fluorescence photomicrograph shows the FITC-labeled peptide binding to dysplastic epithelium to sub-surface crypts, magnification 20×.C) On stereomicroscopy, squamous (S) epithelium and intestinal metaplasia (IM) can be identified by a pink and red color, respectively, but not HGD, scale bar 1 mm. The dashed lines (1–3) spaced 2 mm apart identify the length of sections to be cut for histology. D) Increased intensity can be seen from FITC-labeled peptide bound to foci of HGD on the fluorescence image. E) Histology cut along sections (1–3) is evaluated in 1 mm intervals, magnification 1.25×. F) HGD (expanded view of black box in 6E) is identified histologically by large, non-uniform nuclei with extensive stratification and lack of cytoplasmic mucin, magnification 40×.
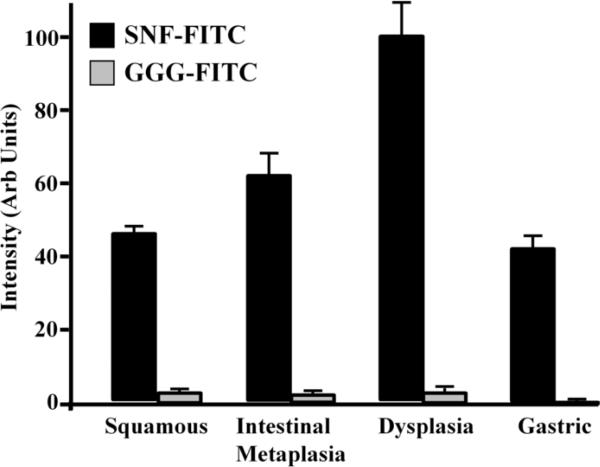
The fluorescence intensities (mean±SEM) for the 4 histological classifications associated with binding by the fluorescent-labeled candidate (SNFYMPLGGGSK-FITC), n = 12 specimens, and control (GGGAGGGAGGGK-FITC), n = 5 specimens, peptides are shown in Fig. 7. For the SNFYMPL peptide, the results for squamous (n=145), intestinal metaplasia (n=83), dysplasia (n=61, including n=15 LGD and n=46 HGD) and gastric mucosa (n=69) were 46.5±1.6, 62.3±5.8, 100.0±9.0, and 42.4±3.0 arb units, respectively. For the control peptide, the values for squamous (n=41), intestinal metaplasia (n=16), dysplasia (n=32, including n=8 LGD and n=24 HGD) and gastric mucosa (n=23) were 3.2±1.9, 2.2±2.4, 3.4±2.1, and 0.7±0.3 arb units, respectively. The two-way ANOVA resulted in a F-value of 25.3 (p<0.01), demonstrating that the mean of at least one histology classification is statistically different from the others. Tukey's multiple comparisons showed a statistically significant difference between the mean value for dysplasia and that for intestinal metaplasia (p<0.01), squamous (p<0.01), and gastric mucosa (p<0.01). There was no statistically significant difference in the mean intensity for squamous and intestinal metaplasia (p=0.97), squamous and gastric mucosa (p=0.53), and intestinal metaplasia and gastric mucosa (p=0.15).
Fig. 7.
The mean fluorescence intensities (±SEM) for binding of the FITC-labeled SNFYMPL and control peptides to mucosa classified histologically as squamous, intestinal metaplasia, dysplasia, and gastric mucosa are shown.
Discussion
Here, we demonstrate a systematic approach for the selection, characterization, and validation of an affinity peptide that targets dysplasia in Barrett's esophagus. The peptide sequence SNFYMPL was identified in an unbiased manner using the technique of phage display and a subtractive whole cell biopanning strategy. This peptide was found to have partial homology (5 of 7 amino acids) to the Atrophin-1-like protein. Also, a binding affinity in the nanomolar range was found, a result comparable to that of antibodies [23]. Moreover, selective binding to transformed esophageal cells was validated on 1) bound phage counts, 2) ELISA, 3) competitive binding, 4) FACS analysis, and 5) fluorescence microscopy. In addition, we demonstrated preferential binding to dysplasia over large mucosal surface areas with a stereomicroscope, demonstrating the potential of this approach to localize pre-malignant foci. The intensity ratio for tissue (dysplasia versus intestinal metaplasia) was less than that for cells (OE33 versus Q-hTERT) because the presence of the extra-cellular matrix in tissue probably results in more non-specific binding. These results support the effort required to meet the demanding regulatory challenges needed to perform future in vivo validation studies.
Molecular imaging represents a novel approach for diagnostic imaging based on unique protein expression patterns rather than non-specific architectural changes, and highly specific probes are needed to advance this field [24]. Previously, antibodies [25], antibody fragments [26], RNA aptamers [27], and dequenching probes [28] have been used for targeting in small animal models. Peptides represent a new class of imaging agent that are compatible with clinical use in the digestive tract, in particular with topical administration. The use of phage display for peptide selection represents an unbiased approach to achieving affinity binding to cell surface targets, and was chosen to maximize selectivity. Future efforts will focus on the development of peptides that bind to known targets that can be used to personalize chemotherapy. It is likely that more than one peptide will be needed to achieve the desired diagnostic sensitivity and specificity on imaging, given the heterogeneous nature of gene expression in this disease [29,30].
Several wide area imaging methods that go beyond conventional white light have been explored for performing endoscopic surveillance of dysplasia in Barrett's esophagus. Autofluorescence imaging (AFI) provides optical contrast by exciting endogenous fluorophores and measures differences in the concentration of metabolites, such as FAD, NADH, and porphyrins as well as in hemoglobin content and collagen thickness [31]. Narrow band imaging (NBI) assesses differences in the tissue penetration depth of light at various wavelengths to enhance the visualization of glandular and vascular structures in the mucosa [32]. In these methods, neoplastic mucosa is distinguished by a reduction in signal intensity compared to that of adjacent non-neoplastic mucosa. This feature is susceptible to non-specific sources that are frequently encountered during endoscopy, including mucous, shadows, and inflammation. Labeled peptides, on the other hand, produce an increased fluorescence intensity at the site of neoplastic mucosa, providing a more desirable strategy for in vivo detection. This feature of targeted imaging has been previously demonstrated [12].
Future efforts will focus on the in vivo validation of peptide binding to dysplastic esophageal mucosa. The FITC label was chosen for compatibility with fluorescence endoscopes and confocal microscopes that are already being used in the clinic. This combination of instruments provide wide area surveillance to localize the lesions and optical sectioning to validate cell binding. Because this labeled peptide represents a novel imaging agent, FDA approval will be needed for future clinical use. In vivo validation studies will be conducted under regulatory oversight and will be performed using an investigational new drug (IND) application. These results demonstrate the potential future use of fluorescent-labeled peptides to target dysplasia on screening endoscopy for guiding tissue biopsy in patients at increased risk for developing adenocarcinoma and increasing the yield of detection of pre-malignant mucosa.
Acknowledgements
The authors acknowledge funding support from the Doris Duke Charitable Foundation (clinical scientist development award) and NIH U54 CA13642. We thank Peter S. Rabinovitch (Dept of Pathology, University of Washington) for the Q-hTERT cells. We thank Rich Kwon, Zhongyao Liu, and Sharon Miller for technical support.
Grant Support: Doris Duke Charitable Foundation (Clinical Scientist Development Award to TD Wang) and NIH U54 CA13642 (P.I. TD Wang)
Footnotes
Publisher's Disclaimer: This is a PDF file of an unedited manuscript that has been accepted for publication. As a service to our customers we are providing this early version of the manuscript. The manuscript will undergo copyediting, typesetting, and review of the resulting proof before it is published in its final citable form. Please note that during the production process errors may be discovered which could affect the content, and all legal disclaimers that apply to the journal pertain.
Disclosures: The University of Michigan has filed a provisional patent on behalf of Meng Li and Thomas Wang on the fluorescent-labeled peptide presented in this study.
Study Concept and Design: Meng Li, Thomas D. Wang
Acquisition of Data: Meng Li, Costas P. Anastassiades, Bishnu Joshi, Chris M. Komarck
Analysis and Interpretation of Data: Meng Li, Chris M. Komarck, Timothy D. Johnson, Henry Appelman, Thomas D. Wang
Drafting of the manuscript: Meng Li, Thomas D. Wang
Obtained funding: Thomas D. Wang
Technical support: Cyrus Piraka, Badih J. Elmunzer, Danielle K. Turgeon
Study supervision: Thomas D. Wang
References
- 1.American Cancer Society . Cancer Facts & Figures 2009. American Cancer Society; Atlanta: 2009. [Google Scholar]
- 2.Shaheen NJ, Richter JE. Barrett's oesophagus. Lancet. 2009;373:850–61. doi: 10.1016/S0140-6736(09)60487-6. [DOI] [PubMed] [Google Scholar]
- 3.Sharma P. Clinical practice. Barrett's esophagus. N Engl J Med. 2009;361:2548–56. doi: 10.1056/NEJMcp0902173. [DOI] [PubMed] [Google Scholar]
- 4.Odze RD. Update on the diagnosis and treatment of Barrett esophagus and related neoplastic precursor lesions. Arch Pathol Lab Med. 2008;132:1577–85. doi: 10.5858/2008-132-1577-UOTDAT. [DOI] [PubMed] [Google Scholar]
- 5.Solaymani-Dodaran M, Logan RF, West J, Card T, Coupland C. Risk of oesophageal cancer in Barrett's oesophagus and gastro-oesophageal reflux. Gut. 2004;53:1070–4. doi: 10.1136/gut.2003.028076. [DOI] [PMC free article] [PubMed] [Google Scholar]
- 6.Zhu W, Appelman HD, Greenson JK, Ramsburgh SR, Orringer MB, Chang AC, McKenna BJ. A histologically defined subset of high-grade dysplasia in Barrett mucosa is predictive of associated carcinoma. Am J Clin Pathol. 2009;132:94–100. doi: 10.1309/AJCP78CKIOJWOVFN. [DOI] [PubMed] [Google Scholar]
- 7.Levine DS, Haggitt RC, Blount PL. An endoscopic biopsy protocol can differentiate high-grade dysplasia from early adenocarcinoma in Barrett's esophagus. Gastroenterology. 1993;105:40–50. doi: 10.1016/0016-5085(93)90008-z. [DOI] [PubMed] [Google Scholar]
- 8.Gerson LB, Triadafilopoulos G. Screening for esophageal adenocarcinoma: an evidence-based approach. Am J Med. 2002;15(113):499–505. doi: 10.1016/s0002-9343(02)01234-2. [DOI] [PubMed] [Google Scholar]
- 9.Goetz M, Wang TD. Molecular Imaging in Gastrointestinal Endoscopy. Gastroenterology. 2010;138:828–833. doi: 10.1053/j.gastro.2010.01.009. [DOI] [PMC free article] [PubMed] [Google Scholar]
- 10.Hsiung P, Hardy J, Friedland S, Soetikno R, Du CB, Wu AP, Sahbaie P, Crawford JM, Lowe AW, Contag CH, Wang TD. Detection of colonic dysplasia in vivo using a targeted heptapeptide and confocal microendoscopy. Nature Medicine. 2008;14:454–58. doi: 10.1038/nm1692. [DOI] [PMC free article] [PubMed] [Google Scholar]
- 11.Uedo N, Higashino K, Ishihara R, Takeuchi Y, Iishi H. Diagnosis of Colonic Adenomas by New Autofluorescence Imaging System: a Pilot Study. Digestive Endoscopy. 2007;19:S134–8. [Google Scholar]
- 12.Li M, Wang TD. Targeted Endoscopic Imaging. In: Wang K, Elta G, editors. Gastrointestinal Endoscopy Clinics of North America 2009. Elsevier Saunders; PA: pp. 283–98. [DOI] [PMC free article] [PubMed] [Google Scholar]
- 13.Soldes OS, Kuick RD, Thompson IA, 2nd, Hughes SJ, Orringer MB, Iannettoni MD, Hanash SM, Beer DG. Differential expression of Hsp27 in normal oesophagus, Barrett's metaplasia and oesophageal adenocarcinomas. Br J Cancer. 1999;79:595–603. doi: 10.1038/sj.bjc.6690094. [DOI] [PMC free article] [PubMed] [Google Scholar]
- 14.Boonstra JJ, van Marion R, Beer DG, Lin L, Chaves P, Ribeiro C, Pereira AD, Roque L, Darnton SJ, Altorki NK, Schrump DS, Klimstra DS, Tang LH, Eshleman JR, Alvarez H, Shimada Y, vanDekken H, Tilanus HW, Dinjens WN. Verification and Unmasking of Widely Used Human Esophageal Adenocarcinoma Cell Lines. J Natl Cancer Inst. 2010;102(4):271–4. doi: 10.1093/jnci/djp499. [DOI] [PMC free article] [PubMed] [Google Scholar]
- 15.Palanca-Wessels MC, Klingelhutz A, Reid BJ, Norwood TH, Opheim KE, Paulson TG, Feng Z, Rabinovitch PS. Extended lifespan of Barrett's esophagus epithelium transduced with the human telomerase catalytic subunit: a useful in vitro model. Carcinogenesis. 2003;24:1183–90. doi: 10.1093/carcin/bgg076. [DOI] [PMC free article] [PubMed] [Google Scholar]
- 16.Scott JK, Smith GP. Searching for peptide ligands with an epitope library. Science. 1990;249:386–90. doi: 10.1126/science.1696028. [DOI] [PubMed] [Google Scholar]
- 17.Cwirla SE, Peters EA, Barrett RW, Dower WJ. Peptides on phage: a vast library of peptides for identifying ligands. PNAS. 1990;87:6378–82. doi: 10.1073/pnas.87.16.6378. [DOI] [PMC free article] [PubMed] [Google Scholar]
- 18.Kelly K, Alencar H, Funovics M, Mahmood U, Weissleder R. Detection of invasive colon cancer using a novel, targeted, library-derived fluorescent peptide. Cancer Res. 2004;64:6247–51. doi: 10.1158/0008-5472.CAN-04-0817. [DOI] [PubMed] [Google Scholar]
- 19.Zhao P, Grabinski T, Gao C, Skinner RS, Giambernardi T, Su Y, Hudson E, Resau J, Gross M, Vande Woude GF, Hay R, Cao B. Identification of a met-binding peptide from a phage display library. Clin Cancer Res. 2007;13:6049–55. doi: 10.1158/1078-0432.CCR-07-0035. [DOI] [PubMed] [Google Scholar]
- 20.Fields GB, Noble RL. Solid phase peptide synthesis utilizing 9-fluorenylmethoxycarbonyl amino acids. Int J Pept Protein Res. 1990;35:161–214. doi: 10.1111/j.1399-3011.1990.tb00939.x. [DOI] [PubMed] [Google Scholar]
- 21.Thomas R, Chen J, Roudier MM, Vessella RL, Lantry LE, Nunn AD. In vitro binding evaluation of 177Lu-AMBA, a novel 177Lu-labeled GRP-R agonist for systemic radiotherapy in human tissues. Clin Exp Metastasis. 2009;26:105–19. doi: 10.1007/s10585-008-9220-0. [DOI] [PubMed] [Google Scholar]
- 22.Waerner T, Gardellin P, Pfizenmaier K, Weith A, Kraut N. Human RERE is localized to nuclear promyelocytic leukemia oncogenic domains and enhances apoptosis. Cell Growth Differ. 2001;12:201–10. [PubMed] [Google Scholar]
- 23.Alford R, Ogawa M, Choyke PL, Kobayashi H. Molecular probes for the in vivo imaging of cancer. Mol Biosyst. 2009;5:1279–91. doi: 10.1039/b911307j. [DOI] [PMC free article] [PubMed] [Google Scholar]
- 24.Burgess T, Coxon A, Meyer S, Sun J, Rex K, Tsuruda T, Chen Q, Ho SY, Li L, Kaufman S, McDorman K, Cattley RC, Sun J, Elliott G, Zhang K, Feng X, Jia XC, Green L, Radinsky R, Kendall R. Fully human monoclonal antibodies to hepatocyte growth factor with therapeutic potential against hepatocyte growth factor/c-Met-dependent human tumors. Cancer Res. 2006;66:1721–9. doi: 10.1158/0008-5472.CAN-05-3329. [DOI] [PubMed] [Google Scholar]
- 25.Goetz M, Ziebart A, Foersch S, Vieth M, Waldner MJ, Delaney P, Galle PR, Neurath MF, Kiesslich R. In vivo molecular imaging of colorectal cancer with confocal endomicroscopy by targeting epidermal growth factor receptor. Gastroenterology. 2010;138:435–46. doi: 10.1053/j.gastro.2009.10.032. [DOI] [PubMed] [Google Scholar]
- 26.Olafsen T, Kenanova VE, Sundaresan G, Anderson AL, Crow D, Yazaki PJ, Li L, Press MF, Gambhir SS, Williams LE, Wong JY, Raubitschek AA, Shively JE, Wu AM. Optimizing radiolabeled engineered anti-p185HER2 antibody fragments for in vivo imaging. Cancer Res. 2005;65:5907–16. doi: 10.1158/0008-5472.CAN-04-4472. [DOI] [PMC free article] [PubMed] [Google Scholar]
- 27.Sefah K, Tang ZW, Shangguan DH, Chen H, Lopez-Colon D, Li Y, Parekh P, Martin J, Meng L, Phillips JA, Kim YM, Tan WH. Molecular recognition of acute myeloid leukemia using aptamers. Leukemia. 2009;23:235–44. doi: 10.1038/leu.2008.335. [DOI] [PMC free article] [PubMed] [Google Scholar]
- 28.Marten K, Bremer C, Khazaie K, Sameni M, Sloane B, Tung CH, Weissleder R. Detection of dysplastic intestinal adenomas using enzyme-sensing molecular beacons in mice. Gastroenterology. 2002;122:406–14. doi: 10.1053/gast.2002.30990. [DOI] [PubMed] [Google Scholar]
- 29.Miller CT, Moy JR, Lin L, Schipper M, Normolle D, Brenner DE, Iannettoni MD, Orringer MB, Beer DG. Gene amplification in esophageal adenocarcinomas and Barrett's with high-grade dysplasia. Clin Cancer Res. 2003;9:4819–25. [PubMed] [Google Scholar]
- 30.Lin L, Aggarwal S, Glover TW, Orringer MB, Hanash S, Beer DG. A minimal critical region of the 8p22–23 amplicon in esophageal adenocarcinomas defined using sequence tagged site-amplification mapping and quantitative polymerase chain reaction includes the GATA-4 gene. Cancer Res. 2000;60:1341–7. [PubMed] [Google Scholar]
- 31.Borovicka J, Fischer J, Neuweiler J, Netzer P, Gschossmann J, Ehmann T, Bauerfeind P, Dorta G, Zürcher U, Binek J, Meyenberger C. Autofluorescence endoscopy in surveillance of Barrett's esophagus: a multicenter randomized trial on diagnostic efficacy. Endoscopy. 2006;38:867–72. doi: 10.1055/s-2006-944726. [DOI] [PubMed] [Google Scholar]
- 32.Wolfsen HC, Crook JE, Krishna M, Achem SR, Devault KR, Bouras EP, Loeb DS, Stark ME, Woodward TA, Hemminger LL, Cayer FK, Wallace MB. Prospective, controlled tandem endoscopy study of narrow band imaging for dysplasia detection in Barrett's Esophagus. Gastroenterology. 2008;135:24–31. doi: 10.1053/j.gastro.2008.03.019. [DOI] [PubMed] [Google Scholar]


