Abstract
Farnesyl diphosphate synthase (FDPS) catalyzes the conversion of isopentenyl diphosphate and dimethylallyl diphosphate to farnesyl diphosphate, a crucial metabolic intermediate in the synthesis of cholesterol, ubiquinone and prenylated proteins; consequently, much effort has gone into developing inhibitors that target FDPS. Currently most FDPS assays use either radiolabeled substrates and are discontinuous, or monitor pyrophosphate release and not farnesyl diphosphate (FPP) creation. Here we report the development of a continuous coupled enzyme assay for FDPS activity that involves the subsequent incorporation of the FPP product of that reaction into a peptide via the action of protein farnesyltransferase (PFTase). By using a dansylated peptide whose fluorescence quantum yield increases upon farnesylation, the rate of FDPS-catalyzed FPP production can be measured. We show that this assay is more sensitive than existing coupled assays, that it can be used to conveniently monitor FDPS activity in a 96-well plate format and that it can reproduce IC50 values for several previously reported FDPS inhibitors. This new method offers a simple, safe and continuous method to assay FDPS activity that should greatly facilitate the screening of inhibitors of this important target.
Keywords: Farnesyl diphosphate synthase, pyrophosphate, assay, protein farnesyl transferase, diphosphate, fluorescence assay, coupled assay
Introduction
Farnesyl diphosphate synthase (FDPS) catalyzes the reaction between two isopentenyl diphosphate (IPP) molecules and one dimethylallyl diphosphate (DMAPP) molecule to produce farnesyl diphosphate (FPP). It does this through a sequential process where one IPP molecule and one DMAPP molecule react to form geranyl diphosphate (GPP), followed by a second reaction between GPP and an additional IPP molecule to create FPP. This 15 carbon diphosphate is a key biosynthetic intermediate in the formation of a variety of small molecules including cholesterol, heme, ubiquinone, and geranylgeranyl pyrophosphate[1] as well as prenylated proteins[2].
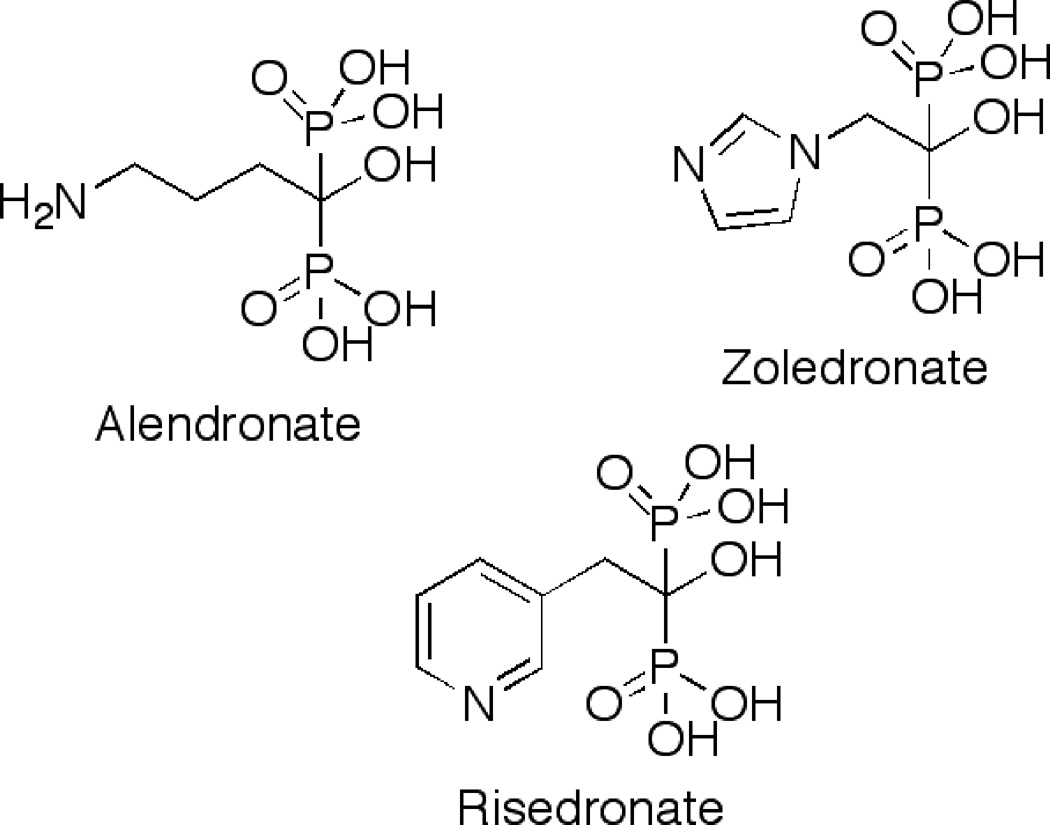
FDPS is a promising target for the development of therapeutics because it has been implicated in a number of different diseases including malaria[3], Chagas’ disease[4], osteoporosis, hypertension and heart disease[5] and many different types of cancers[6]. To date, there are only a few FDPS inhibitors on the market, including alendronate (Fosamax®), zoledronate (Zometa®) and risedronate (Actonel®)[7]. These inhibitors target diseases of osteoclasts, mainly because they are all based on a nitrogen-containing bisphosphonate motif. This type of chemical moiety causes the inhibitors to localize in bone tissue which renders them effective in several types of osteopathologies but relatively ineffective against other cell types. Such functionality also results in cellular accumulation in certain parasites involved in a number of different diseases, because these types of organisms contain a higher level of pyrophosphates[8].
Recently, considerable effort has been invested in developing FDPS inhibitors based on alternative scaffolds (including non-bisphosphonates) that allow other tissue types and parasite-derived forms of FDPS[3; 9] to be targeted. There are several limits in analyzing inhibitors of FDPS activity: the most widely used assays are discontinuous, time and labor intensive, and involve the use of radiolabelled substrates or only measure the release of pyrophosphate[10; 11] and not FPP production and can hence be susceptible to artifacts. The most common FDPS assay involves using radiolabeled IPP in the enzymatic reaction followed by separation of residual IPP from FPP and subsequent quantification of radioactivity via liquid scintillation counting. Clearly, such a labor-intensive process is an impediment to efficient high throughput screening. As an alternative, a continuous spectrophotometric assay for FDPS has been developed[12; 13]. That assay uses a series of coupled enzymatic reactions where a pyrophosphatase initially converts the diphosphate product, generated in the FDPS reaction, to inorganic phosphate. The resulting phosphate is then used by a purine nucleoside phosphorylase to convert 2-amino-6-mercapto-7-methyl-purine riboside to ribose 1-phosphate and 2-amino-6-mercapto-7-methyl-purine; the purine product of that last reaction is UV active and its production can be monitored at 360 nm (ε360 = 11,000 M−1•cm−1). While the resulting assay is continuous, its limit of detection is approximately one nanomole of product. Additionally, because the assay monitors phosphate production, it is prone to artifacts due to background phosphate production when performed using biological extracts. Finally because this assay involves the use of two coupling enzymes to measure FDPS activity, there is increased likelihood for the assay to yield false positives in inhibitor screening since inhibition of either of the coupling enzymes will result in apparent reductions in FDPS activity.
Protein Farnesyltransferase (PFTase) catalyzes the post-translational attachment of a sesquiterpenoid farnesyl moiety onto the C-terminal ends of proteins which contain a four amino acid consensus sequence commonly referred to as a “CAAX box” where C is cysteine, “A” refers to aliphatic amino acids and “X” is a directing residue, typically serine or methionine[14]. PFTase catalyzes the reaction using FPP as a substrate and links it to the target protein via a thioether bond. Prenylation plays a role in targeting proteins to the plasma membrane and is critical for enabling key protein-protein interactions to occur[15]. It has been implicated as a possible therapeutic target for cancer treatment because mutated forms of RAS are present in many human cancers, but in order for these oncogenic variants to be active, they must be prenylated[16].
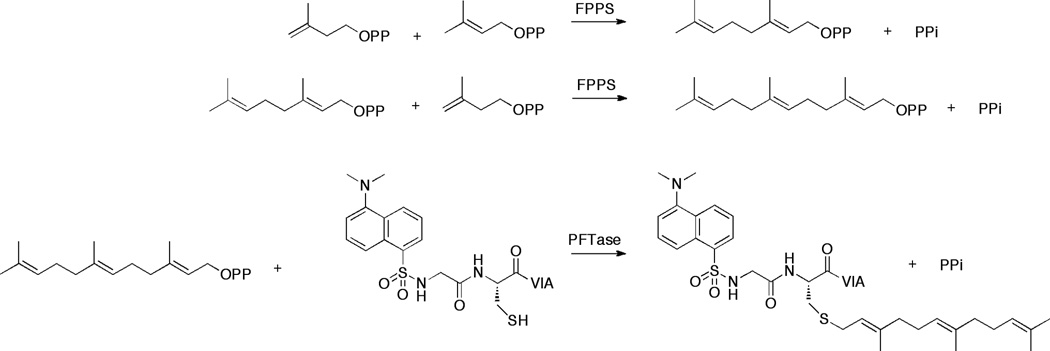
In 1992, Pompliano and coworkers developed a continuous spectrofluorimetric assay for monitoring the activity of PFTase[17] that has been extensively used by a number of groups [18; 19]. This assay uses FPP and a CAAX box-containing peptide functionalized with an N-terminal dansyl glycine residue. In this continuous assay, farnesylation of the peptide results in an increase in dansyl group fluorescence (an environmentally sensitive fluorophore) due to the increase in hydrophobicity that occurs in the peptide upon prenylation. Since the smaller isoprenoid diphosphates DMAPP and GPP are relatively poor substrates for PFTase, we reasoned that the production of FPP by FDPS could be coupled with its subsequent incorporation into a peptide substrate catalyzed by PFTase. Several groups have developed coupled assays to detect FPP based on this sequence of enzymatic reactions, but in all cases to date, the assays have been discontinuous in nature[20; 21]. The amounts of prenylated products were determined via HPLC separation and peak integration. We hypothesized that by using a dansylated peptide as noted above, a continuous increase in fluorescence would occur as FPP is generated by FDPS and transferred to the peptide by PFTase (Fig. 1). In this report we describe this new assay and demonstrate its utility by employing it to measure the IC50 values for several inhibitors of FDPS.
Fig. 1.
Coupled enzymatic scheme for assaying the activity of FDPS. FDPS converts one IPP and one DMAPP molecule into one GPP molecule, then converts that GPP molecule into FPP with an additional IPP molecule. Once the FPP is generated, PFTase catalyzes the attachment of farnesyl to a dansylated CAAX peptide. Measuring the fluorescence intensity at an excitation wavelength of 340 nm and an emission wavelength 505 nm allows the direct monitoring of prenylated peptide which is directly related to the amount of FPP produced by FDPS.
Methods and Materials
E. coli JM109(DE3) cells containing a derivative plasmid of pUCmod that encodes E. coli FDPS (IspA) previously described by Schmidt-Dannert and coworkers[22] were grown in LB media containing 150 µg/mL of ampilicin. E. coli was grown directly from stock cells stored at −80°C. Initially, they were grown overnight at 37°C with shaking at 240 rpm. The next morning, one liter flasks were innoculated with 10 mL of the overnight culture and grown to an OD600 of approximately 0.8. Cells were harvested by centrifugation at 5400×g, and the cell pellets (one pellet equivalent to one liter of cell growth) were frozen and stored at −80°C.
FDPS was purified using a previously reported procedure [22] with minor modifications. Briefly, E. coli cell pellets expressing FDPS were thawed and resuspended in 50 mL of 50 mM phosphate buffer (pH=8.0), 50 mM NaCl, and 1 mL of protease inhibitor cocktail, a cocktail developed for His-tagged proteins (SigmaAldrich, # P8849). This was loaded onto a 25 mL Ni-NTA column bed that had been pre-equilibrated with the cell suspension buffer. This column was then washed with 100 mL of a 50 mM phosphate buffer (pH=8.0) containing 300 mM NaCl, followed by a second wash with 200 mL of a 50 mM phosphate buffer containing 300 mM NaCl and 20 mM imidiazole. The enzyme was eluted from the column with a 50 mM phosphate buffer (pH=8.0) containing 300 mM NaCl, and 300 mM imidazole. Fractions containing the enzyme were pooled together and concentrated and then diluted three times with a 12-fold dilution with 50 mM Tris-HCl (pH=8.0) using an Amicon® Ultra-15 centrifugal filter device (Millipore). After concentration, the enzyme was diluted to 50% glycerol (final enzyme concentration of 2 mg/mL) and stored at −80°C. This purification typically yielded 2 mg/L of liquid culture of FDPS with a purity of 80%.
PFTase Purification
A frozen stock of BL21(DE3)pLysS E. coli cells containing yeast PFTase on a CDF-Duet1 vector, created by the Lorena Beese lab using a design previously employed for the mammalian PFTase[23], was used to inoculate a small culture of LB containing 50 µg/mL of streptomycin and grown overnight at 37°C with shaking at 240 rpm. The next morning, flasks containing 1 L LB media were inoculated with 10 mL of the overnight culture and grown to an OD600 of approx. 0.8. Cells were then induced with 1 mM IPTG and supplemented with 500 µM ZnSO4 followed by incubation overnight at 15°C with shaking at 250 rpm. Cells were harvested by centrifugation at 5400×g, and the pellets (one pellet equivalent to one liter of cell growth) were frozen and stored at −80°C.
Two cell pellets were thawed and resuspended in 50 mL of a buffer containing 50 mM Tris-HCl (pH= 7.0), 200 mM NaCl, 5 µM ZnCl2, 5 mM MgCl2, 20 mM imidazole, and 1 mM β-mercaptoethanol (Lysis Buffer). To this mixture was added 1 mL of protease inhibitor cocktail, a cocktail developed for His-tagged proteins from (SigmaAldrich, #P8849). Cells were pulse sonicated for a total of five min (10 s on, 10 s off) at 50 W followed by centrifugation at 13,000×g for 30 min to remove insoluble cell material. The soluble fraction was then loaded onto a 30 mL Ni-NTA column bed equilibrated with lysis buffer at a rate of approximately 2 mL/min and the column was washed with lysis buffer until the A280 dropped to 0.25 (approximately 200 mL). The desired protein was then eluted using buffer containing 50 mM Tris-HCl (pH= 7.0), 20 mM NaCl, 5 µM ZnCl2, 5 mM MgCl2, 250 mM imidazole, and 1 mM β-mercaptoethanol. Fractions containing PFTase were pooled in an Amicon® Ultra-15 centrifugal filter from Millipore, and concentrated to 4 mL. This was diluted three times at a ten-fold dilution with 50 mM Tris-HCl, 200 mM NaCl, 5 µM ZnCl2, 5 mM MgCl2, and 1 mM β-mercaptoethanol buffer and stored in the latter buffer containing 50% glycerol at −80°C. This purification typically yielded 13 mg/L of liquid culture of PFTase with a purity of 90%.
FDPS Assay Conditions
For the FDPS assays, N-dansyl-GCVIA, prepared as previously described[24], was pre-incubated with DTT for one h to insure that no disulfide was present. After incubation, the peptide DTT solution was used to make a FDPS assay solution that had a final concentration of 2 µM Dansyl-CVIA, 5 mM DTT, 50 mM Tris-HCl (pH=7.5), 10 mM MgCl2, 10 µM ZnCl2, 0.04% n-dodecyl β-D-maltoside, 50 µM IPP and 50 µM DMAPP. For the enzyme concentrations 5 µM of FDPS and 120 nM of PFTase were used. All these reagent concentrations were standard for all FDPS reactions unless otherwise noted.
The reactions were performed in 96-well microtiter plates and the fluorescence emission for each sample was obtained using a DTX 880 Multimode Detector plate reader (Beckman Coulter). The reaction was performed in a black 96-well pinch bar plate (Nunc, # 237105) with no top. The total volume of each reaction was 250 µL. Reactions were performed by adding 100 µL of a concentrated assay solution (5 µM Dansyl-GCVIA, 12.5 mM DTT, 125 mM Tris-HCl (pH=7.5), 25 mM MgCl2, 25 µM ZnCl2, 0.1% n-dodecyl β-D-maltoside, 125 µM IPP and 125 µM DMAPP) and 30 µL of H2O without enzyme to each well using a multi channel pipette. The initial fluorescence reading was recorded (λex = 340 nm, λem = 505 nm) followed by initiation of the reaction through the addition of 100 µL of FDPS and 20 µL PFTase, which brought the final concentration of all the reagents as they are described above. The increase in fluorescence was then monitored until the fluorescence intensity plateaued and no further increase was observed. This occurred over a period of 60 min with a fluorescence reading taken every 45 s. Fluorescence data was initially recorded and visualized using Multimode Analysis Software from Beckman-Coulter.
The data was exported from the Multimode Analysis Software, and the initial rate values were calculated using Microsoft Excel by taking the rate of change in fluorescence intensity versus time over the period of the data that was linear with respect to the rate and usually consisted of 20 data points. IC50 values were obtained using a similar method as described by Leon et al.[11] by plotting the % inhibition versus inhibitor concentration and fitting to the equation I = ImaxC/(IC50 + C) where I is the percent inhibition, Imax is 100% inhibition, C is the concentration of inhibitor, and IC50 is the concentration of inhibitor for 50% inhibition using the non-linear curve-fitting program KaleidaGraph 3.6.
Results
FDPS catalyzes the sequential addition of two molecules of IPP to DMAPP to yield FPP, a substrate for PFTase. Thus, it should be possible to couple the production of FPP with its subsequent PFTase-catalyzed incorporation into a fluorescent peptide, provided the rate of the prenylation reaction is not rate-limiting.
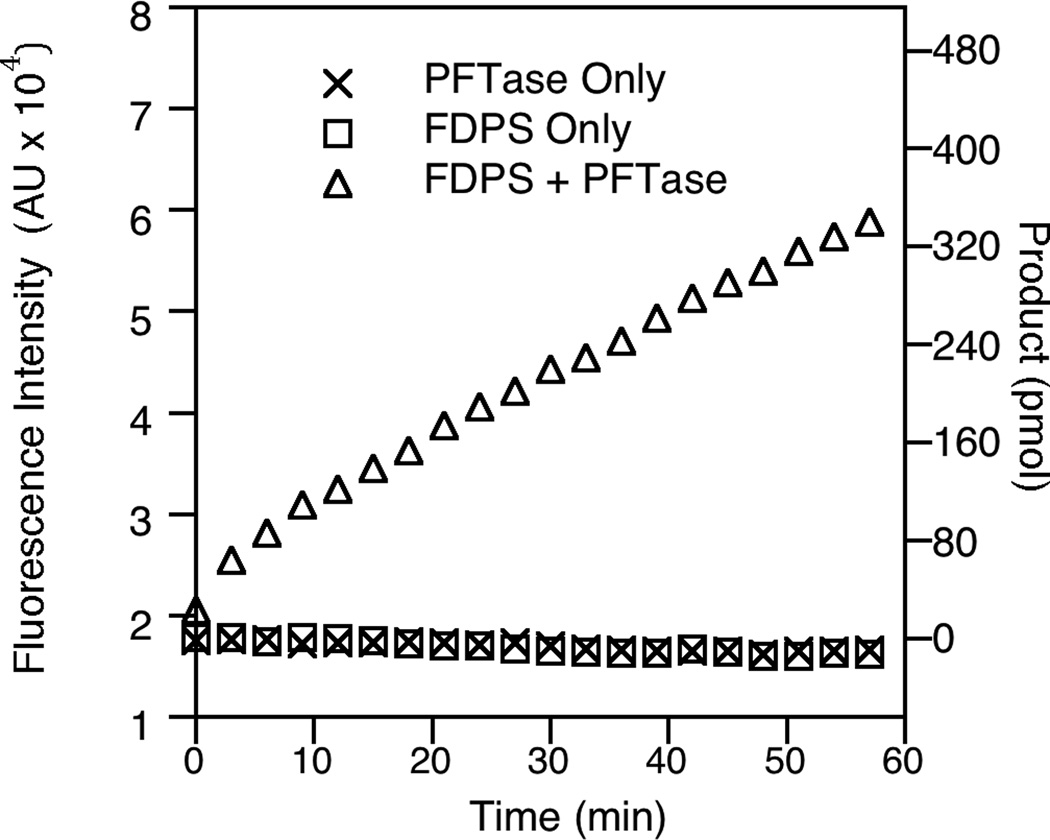
To determine the feasibility of this assay for measuring FDPS activity, initial studies were performed to examine the increase in fluorescence in the presence and absence of both enzymes (Fig. 2). When the reaction mixture contains only DMAPP, IPP and N-dansyl-GCVIA substrates, there was no significant increase in fluorescence; additionally, no fluorescence increase was observed when only one of the two necessary enzymes (FDPS or PFTase) was present in the reaction. Only when both of the enzymes were present was there an increase in fluorescence consistent with the generation of FPP by FDPS.
Fig. 2.
Fluorescence data from reaction conditions using the coupled enzyme methodology. The first two traces show no increase in fluorescence when only FDPS or PFTase is present. It is only in the third trace—when both enzymes are present—that there is an increase in fluorescence.
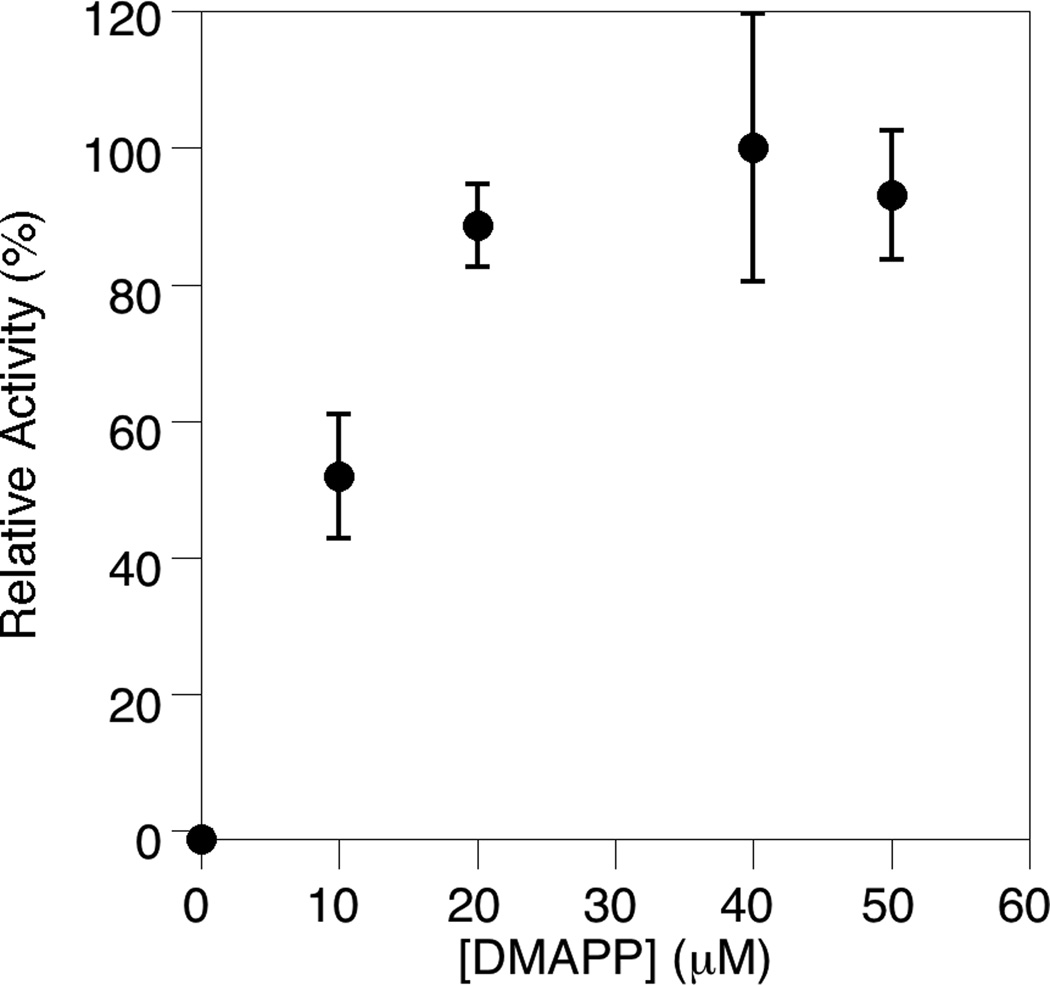
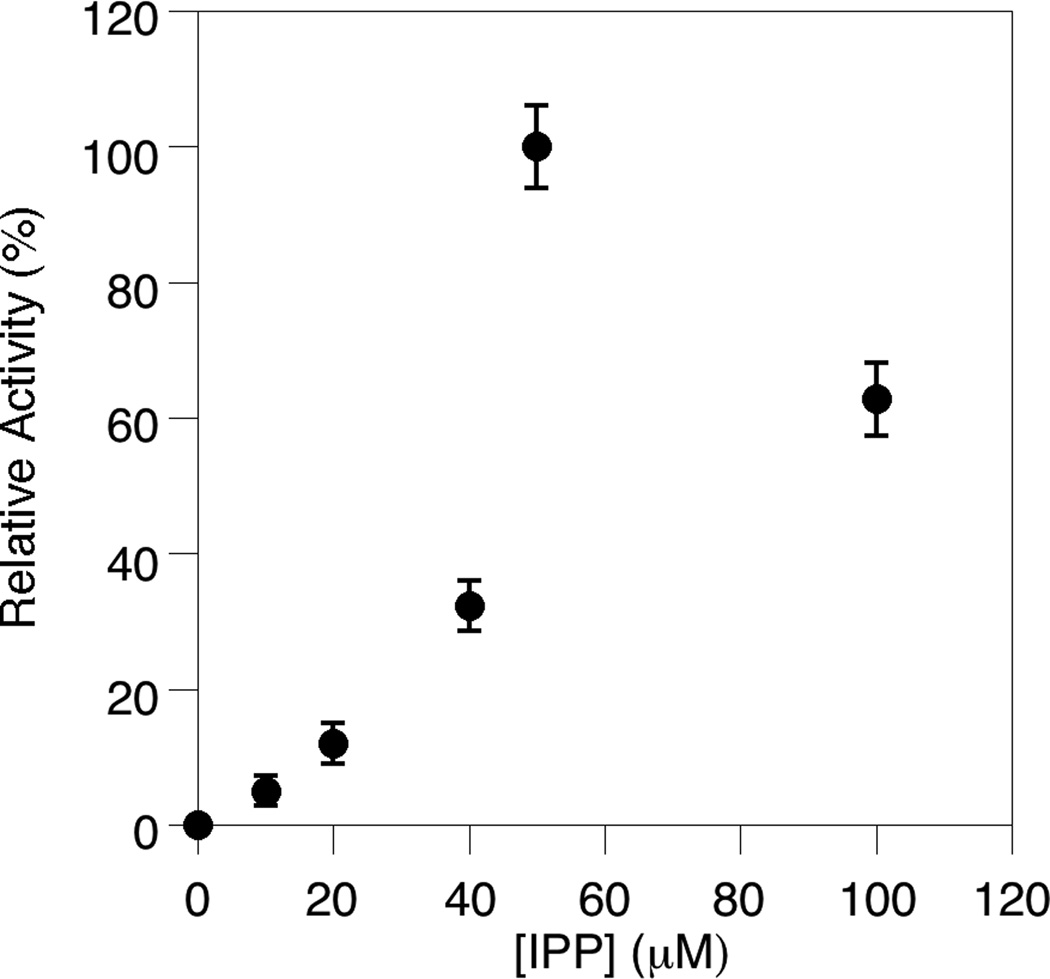
Next, to establish appropriate reaction conditions, the concentrations of the two FDPS substrates, DMAPP (Fig. 3) and IPP (Fig. 4), were varied in the FDPS assay. That data shows that as the concentration of DMAPP is increased, the reaction rate increases up to 25 µM DMAPP before leveling off. This is reasonable because the IPP concentration in the assay was held constant at 50 µM; since FDPS uses IPP and DMAPP in a 2:1 ratio to generate FPP, IPP is the limiting reagent; this means that increasing the concentration of DMAPP beyond 25 µM (half of the amount of IPP) would not result in additional FPP production or an increase in rate (provided that the KM for DMAPP is not significantly greater than 25 µM[25]). The relationship between FDPS activity and the concentration of IPP is more complex. A significant increase in reaction rate was observed as IPP was increased to 50 µM, followed by a decrease when the IPP concentration was increased further. This is consistent with previous observations of substrate inhibition[26] and is presumably due to binding of IPP in the DMAPP binding site at high IPP concentrations. Based on the above experiments and previous work with FDPS enzymes, concentrations of 50 µM were chosen for both the DMAPP and IPP concentrations.
Fig. 3.
Demonstration of the effect of variation in DMAPP concentration on the FDPS assay. The assay was performed in triplicate for each substrate concentration. The average rate (normalized to the maximal rate obtained) is plotted here with the standard deviation indicated by the error bars.
Fig. 4.
Determination of the effect of IPP concentration on the rate of the FDPS-catalyzed reaction. The assay was performed in triplicate for each substrate concentration. The average rate (normalized to the maximal rate obtained) is plotted here with the standard deviation indicated by the error bars.
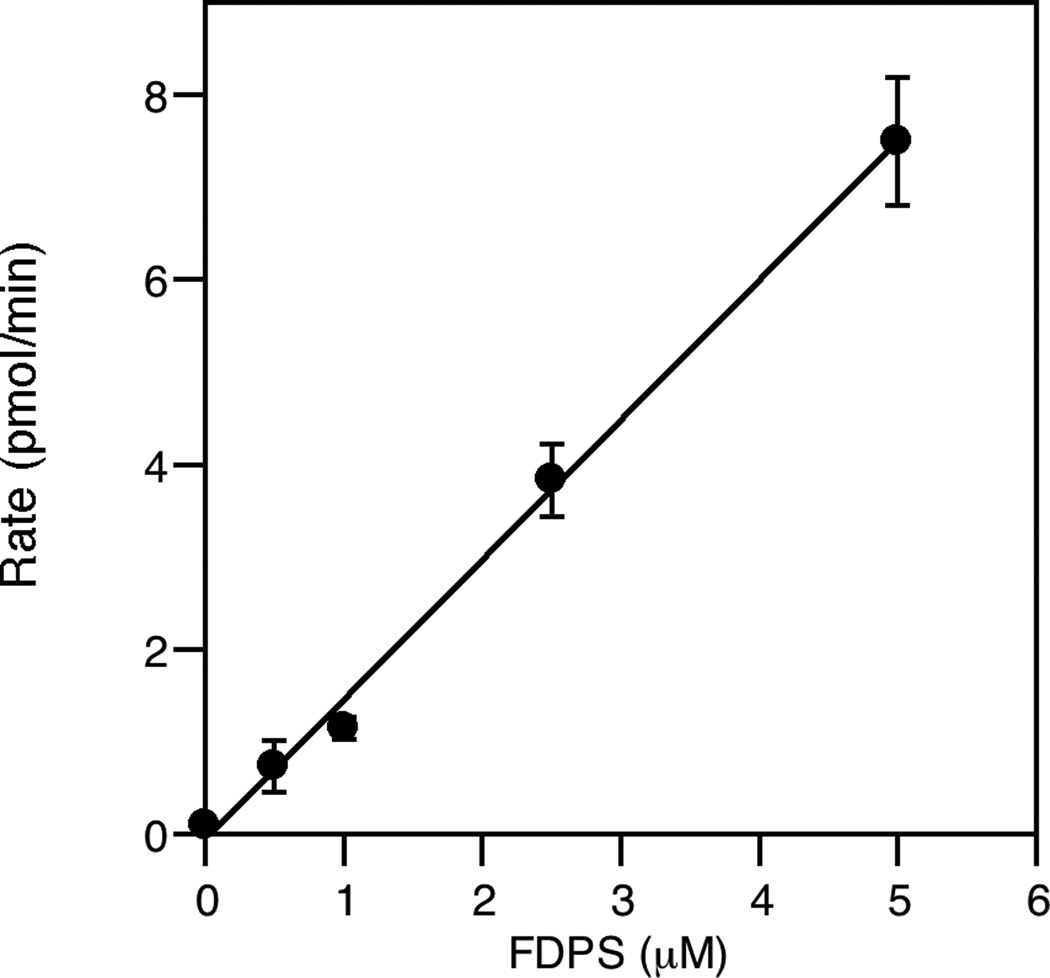
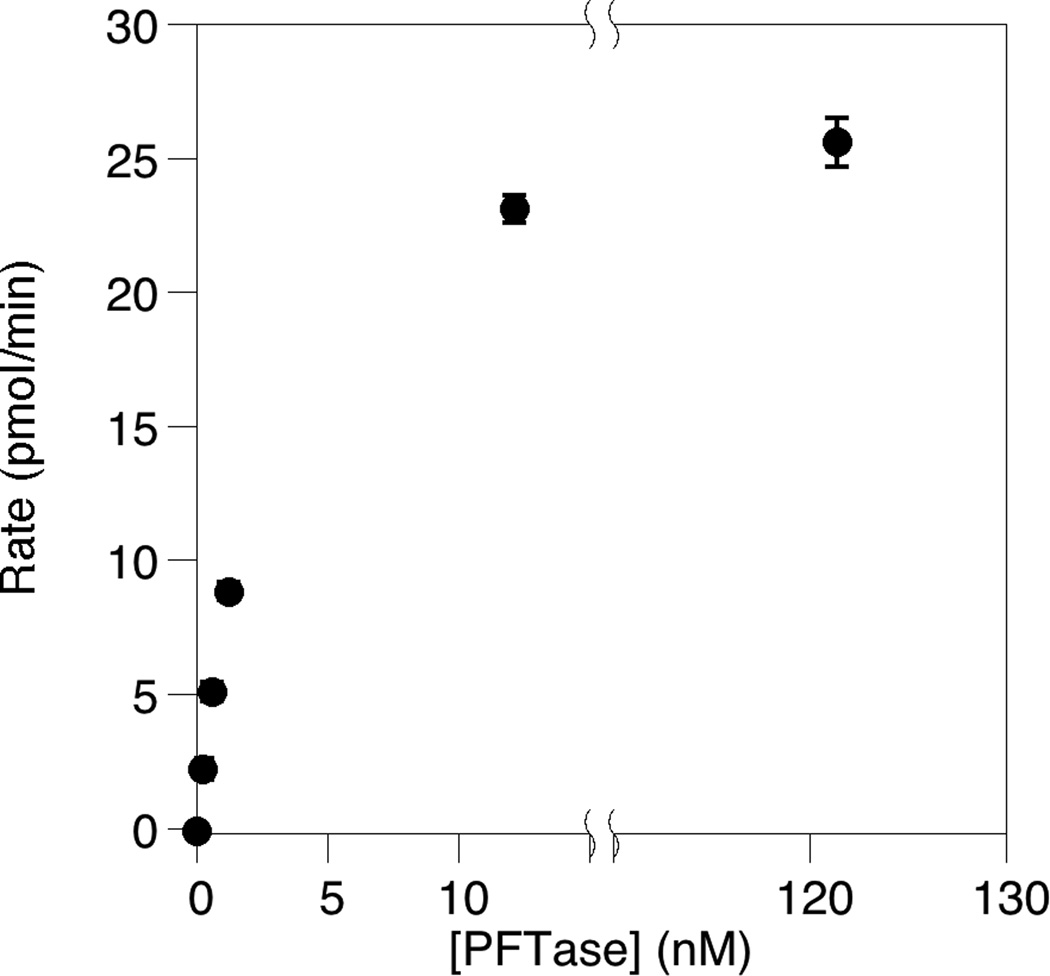
Finally, the concentrations of the two enzymes were varied to determine appropriate concentrations and insure that the rate of the FPP synthesis reaction and not the subsequent coupling reaction was being monitored. Thus, as can be seen when the amount of FDPS was increased in the assay (Fig. 5), the reaction rate increased in a linear manner. When varying the concentration of PFTase, an increase in the reaction rate was observed at low concentrations (Fig. 6) indicating that in that regime, the coupling reaction was controlling the overall rate. However, at higher PFTase concentrations, no further increase in overall reaction rate was observed indicating that the coupling reaction was no longer limiting the process and that the rate being observed reflected the rate of FPP production. Based on those experiments, enzyme concentrations of 5 µM and 120 nM were chosen for FDPS and PFTase, respectively.
Fig. 5.
Effect of FDPS concentration on the rate of reaction. The assay was performed in triplicate for each enzyme concentration. The average rate is plotted here with the standard deviation indicated by the error bars. This data shows that the rate increases linearly with the FDPS concentration.
Fig. 6.
The rate of the reaction is independent of coupling enzyme (PFTase) concentration at high PFTase concentrations. The assay was performed in triplicate for each enzyme concentration. The average rate is plotted here with the standard deviation indicated by the error bars. This data shows that the rate increases linearly with the PFTase concentration indicating that peptide prenylation is the rate-limiting step in the assay at low PFTase concentrations, however, there is no further change in the reaction rate above 12 nM PFTase.
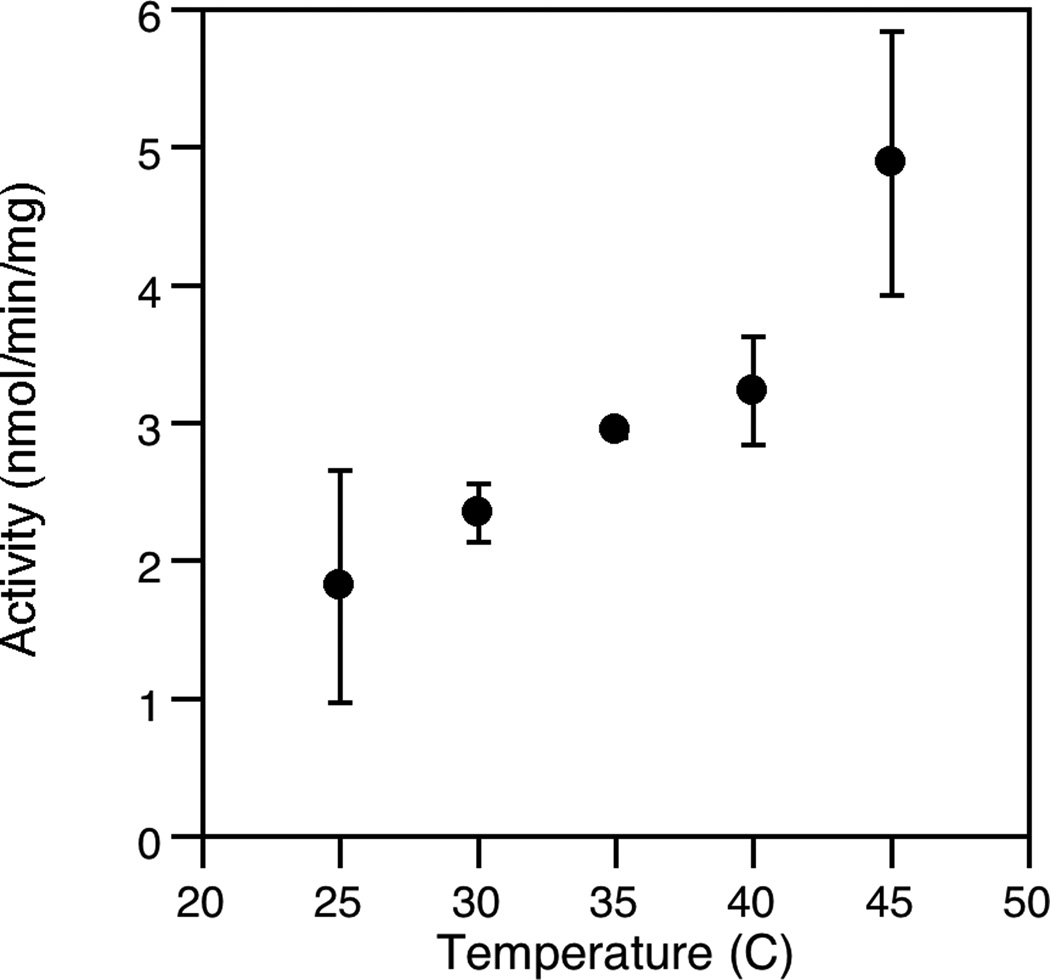
Several other assay parameters were also explored. First, the thermal dependence of the assay was investigated by measuring the specific activity at different temperatures (Fig. 7). That data shows that enzymatic activity increases with increasing temperature. Interestingly, the observed rate increased up to 45°C (the highest temperature attainable in our plate reader) suggesting that FDPS from E. coli and PFTase from S. cerevisiae are stable above their physiologically relevant temperatures of 37°C and 30°C, respectively; this also indicates that this assay should be applicable for monitoring FDPS activity from mesophillic sources.
Fig. 7.
The specific activity of the enzyme rises as temperature is increased. The assay was performed in triplicate for each temperature. The average rate is plotted here with the standard deviation indicated by the error bars. Note that specific activity as low as 2 nmol/min/mg can be detected.
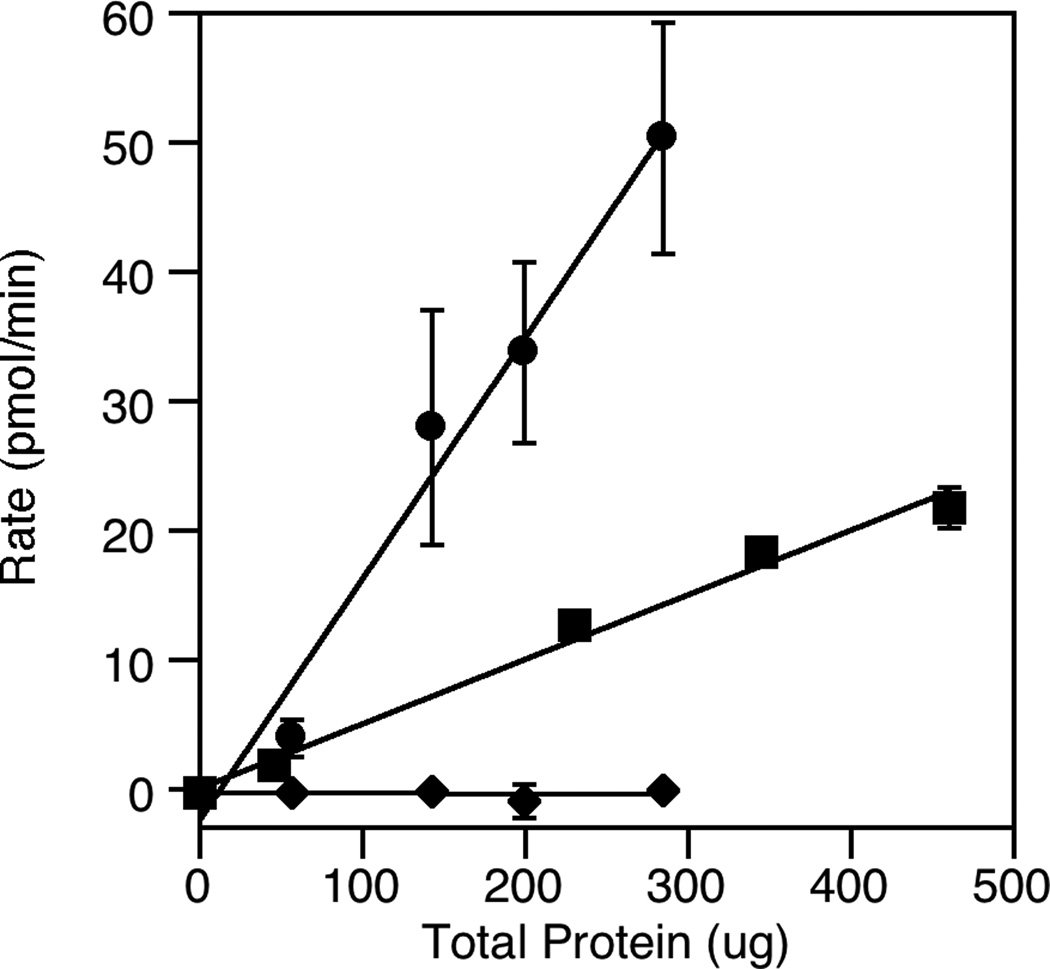
Next, we wanted to explore whether this assay could be used to monitor FDPS activity in crude lysate. Accordingly, E. coli lysates were prepared and assayed for activity using the coupled assay. Activity was monitored for E. coli lysate derived from cells that overexpressed the FDPS gene as well as for cells expressing only endogenous levels of FDPS. That data, illustrated in Fig. 8, shows that FDPS activity can easily be detected in E. coli lysate even when the enzyme is present in impure form with no genetic manipulation to increase its level. It is useful to compare the sensitivity of this new assay with that of the aforementioned pyrophosphate release assay often employed for measuring FDPS activity. Data presented in Fig. 2 shows that quantities of FPP product (converted to farnesylated Dansyl-GCVIA) ranging from 100 to 200 pmol can be easily detected using the PFTase-coupled assay. In contrast, because the pyrophosphate release assay employs UV detection in lieu of fluorescence, its limit of detection is much higher[12]; commercially available kits that use this assay claim a limit of detection of 1 to 2 nmol[27]. Thus, this comparison suggests that the PFTase-based coupled assay is at least an order of magnitude more sensitive than the pyrophosphate release method.
Fig. 8.
Analysis of FDPS activity in crude lysate from E. coli. The assay was performed in triplicate for each protein concentration. The average rate is plotted here with the standard deviation indicated by the error bars. Circles (●) represent rates measured using E. coli cells that overexpress FDPS; squares (■) represent rates measured using E. coli cells that express endogenous levels of FDPS; diamonds (◆) represent the rate measured using E. coli cells that overexpress FDPS incubated with 50 µM Zoledronate
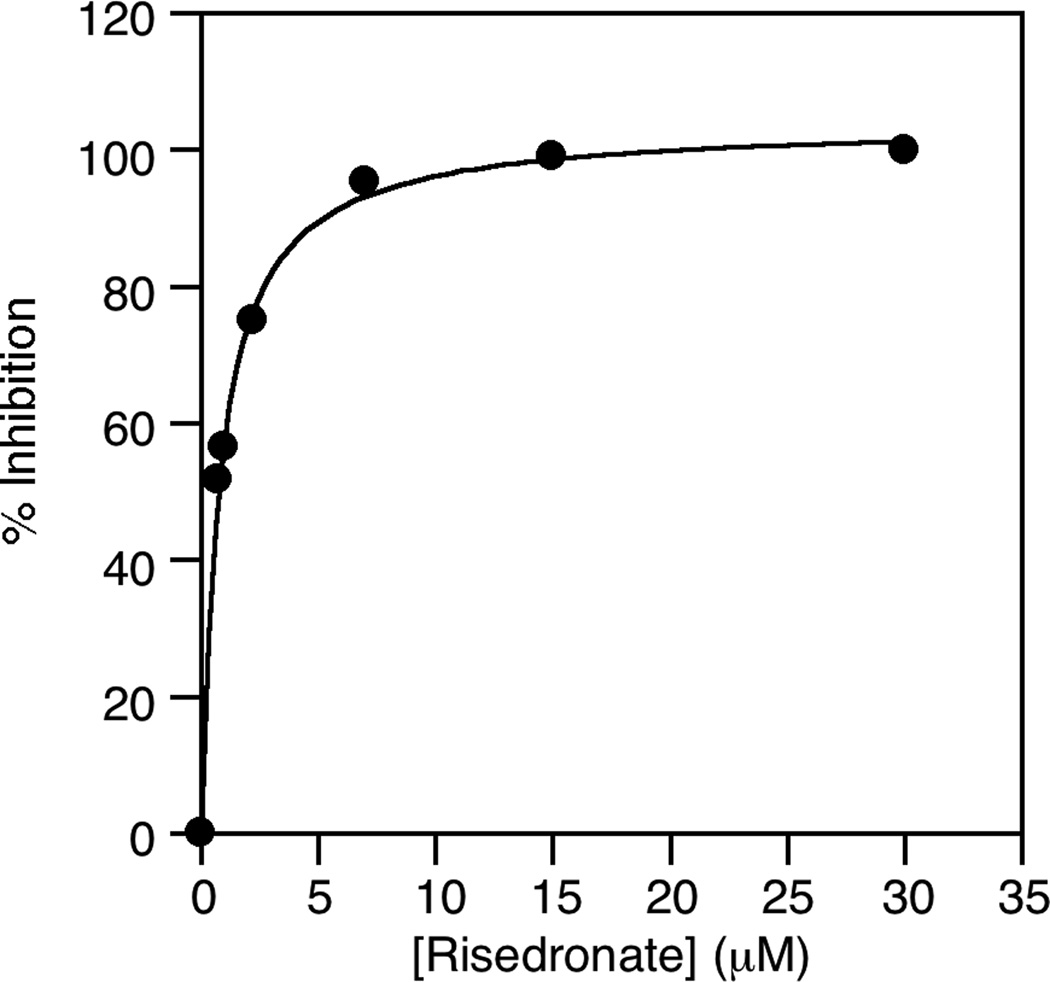
With appropriate reaction conditions defined from the above experiments, we next sought to examine the utility of this assay for screening inhibitors. Accordingly, three inhibitors (see Fig. 9), previously characterized using a spectrophotometric assay for phosphate releasing enzymes, were obtained and analyzed using the coupled enzyme assay developed here. Using Zoledronate, an IC50 value of 0.7 µM was obtained (Fig. 10). That value compares favorably with the previously reported value of 1.1 µM [11]. Similarly, values of 0.7 µM for Risedronate and 11 µM for Alendronate were obtained that also compare well with previously reported values. That data is summarized in Table 1. Control experiments showed that none of these compounds inhibited PFTase at any of the concentrations employed. Additional control experiments were performed where FPP was added to FDPS reactions containing Zoledronate present at saturating concentrations. With the addition FPP, an increase in fluorescence was observed (data not shown), confirming that Zoledronate was not inhibiting PFTase, In a general sense, this experiment provides an easy method for verifying that a given inhibitor is a bone fide inhibitor of FDPS and is not an off-target artifact resulting from inhibition of the PFTase coupling enzyme instead. Finally, we analyzed the ability of the coupled assay to monitor FDPS inhibition by Zoledronate in E. coli lysate produced from cells overexpressing FDPS (Fig. 8, diamonds). Those experiments demonstrate that inhibition experiments can be performed with impure FDPS. More importantly, they suggest that this new coupled assay could be used to screen inhibitors present in complex biological samples including extracts containing natural products derived from animals, plants or microorganisms.
Fig. 9.
Structures of inhibitors tested in the fluorescence assay. All three are bisphosphonates that have previously been shown to be inhibitors of FDPS.
Fig. 10.
Graph of the percent inhibition of FDPS activity observed versus the concentration of Risedronate present.
Table 1.
Comparison of IC50 values determined via the coupled enzyme assay described here and measured using a spectrophotometric assay for phosphate releasing enzymes method. Error in the table represents the standard deviation for three independent experiments.
| Compound | IC50 (µM) | Previously Reported IC50 (µM) |
|---|---|---|
| Zoledronate | 0.7 ± 0.3 | 1.1a |
| Risedronate | 0.7 ± 0.2 | 2.5 b |
| Alendronate | 11 ± 7 | 26b |
From Leon et al. [11]. No IPP or GPP concentrations were included therein.
Eric Oldfield, personal communication.
Conclusion
The coupled enzyme assay described here provides a simple method to measure the rate of FDPS-catalyzed FPP production and can be used to measure IC50 values for inhibitors of that reaction. Relative to current methods, it has the significant advantage of providing a continuous optical readout and is hence amenable to implementation in a high throughput format; this new fluorescence-based assay is more sensitive than the currently existing coupled assay (that is based on absorbance). Thus, it should be useful for screening large libraries which in turn could lead to the development of new classes of inhibitors for this medically important target.
Acknowledgements
This research was supported by the National Institutes of Health Grants GM58442 and GM084152, as well as the National Institutes of Health Predoctoral Training Grant 5T32GM008700-13. We thank Eric Oldfield (University of Illinois, Urbana-Champaign) for providing the FDPS inhibitors, and Claudia Schmidt-Dannert (University of Minnesota, Twin Cities) for providing the FDPS plasmid. We would also like to thank Michael Hast and Lorena Beese (Duke University) for the creation of the yPFTase plasmid.
Footnotes
Publisher's Disclaimer: This is a PDF file of an unedited manuscript that has been accepted for publication. As a service to our customers we are providing this early version of the manuscript. The manuscript will undergo copyediting, typesetting, and review of the resulting proof before it is published in its final citable form. Please note that during the production process errors may be discovered which could affect the content, and all legal disclaimers that apply to the journal pertain.
References
- 1.Dunford JE, Kwaasi AA, Rogers MJ, Barnett BL, Ebetino FH, Russell RGG, Oppermann U, Kavanagh KL. Structure-Activity Relationships Among the Nitrogen Containing Bisphosphonates in Clinical Use and Other Analogues: Time-Dependent Inhibition of Human Farnesyl Pyrophosphate Synthase. J Med Chem. 2008;51:2187–2195. doi: 10.1021/jm7015733. [DOI] [PubMed] [Google Scholar]
- 2.Wiemer AJ, Hohl RJ, Wiemer DF. The Intermediate Enzymes of Isoprenoid Metabolism as Anticancer Targets. Anti-Cancer Agent Med. 2009;9:526–542. doi: 10.2174/187152009788451860. [DOI] [PubMed] [Google Scholar]
- 3.Martin MB, Grimley JS, Lewis JC, Heath HT, Bailey BN, Kendrick H, Yardley V, Caldera A, Lira R, Urbina JA, Moreno SNJ, Docampo R, Croft SL, Oldfield E. Bisphosphonates Inhibit the Growth of Trypanosoma brucei, Trypanosoma cruzi, Leishmania donovani, Toxoplasma gondii, and Plasmodium falciparum: A Potential Route to Chemotherapy. J Med Chem. 2001;44:909–916. doi: 10.1021/jm0002578. [DOI] [PubMed] [Google Scholar]
- 4.Gabelli SB, McLellan JS, Montalvetti A, Oldfield E, Docampo R, Amzel LM. Structure and mechanism of the farnesyl diphosphate synthase from Trypanosoma cruzi: Implications for drug design. Proteins. 2006;62:80–88. doi: 10.1002/prot.20754. [DOI] [PubMed] [Google Scholar]
- 5.Li L, Chen GP, Yang Y, Ye Y, Yao L, Hu SJ. Chronic inhibition of farnesyl pyrophosphate synthase attenuates cardiac hypertrophy and fibrosis in spontaneously hypertensive rats. Biochem Pharmacol. 2010;79:399–406. doi: 10.1016/j.bcp.2009.08.033. [DOI] [PubMed] [Google Scholar]
- 6.Notarnicola M, Messa C, Cavallini A, Bifulco M, Tecce MF, Eletto D, Di Leo A, Montemurro S, Laezza C, Caruso MG. Higher Farnesyl Diphosphate Synthase Activity in Human Colorectal Cancer Inhibition of Cellular Apoptosis. Oncology. 2004;67:351–358. doi: 10.1159/000082918. [DOI] [PubMed] [Google Scholar]
- 7.De Schutter JW, Zaretsky S, Welbourn S, Pause A, Tsantrizos YS. Novel bisphosphonate inhibitors of the human farnesyl pyrophosphate synthase. Bioorg Med Chem Lett. 2010;20:5781–5786. doi: 10.1016/j.bmcl.2010.07.133. [DOI] [PubMed] [Google Scholar]
- 8.Urbina JA, Moreno B, Vierkotter S, Oldfield E, Payares G, Sanoja C, Bailey BN, Yan W, Scott DA, Moreno SNJ, Docampo R. Trypanosoma cruzi Contains Major Pyrophosphate Stores, and Its Growth in Vitro and in Vivo Is Blocked by Pyrophosphate Analogs. J Biol Chem. 1999;274:33609–33615. doi: 10.1074/jbc.274.47.33609. [DOI] [PubMed] [Google Scholar]
- 9.Jahnke W, Rondeau JM, Cotesta S, Marzinzik A, Pellé X, Geiser M, Strauss A, Götte M, Bitsch F, Hemmig R, Henry C, Lehmann S, Glickman JF, Roddy TP, Stout SJ, Green JR. Allosteric non-bisphosphonate FPPS inhibitors identified by fragment-based discovery. Nat Chem Biol. 2010;6:660–666. doi: 10.1038/nchembio.421. [DOI] [PubMed] [Google Scholar]
- 10.Gao J, Chu X, Qiu Y, Wu L, Qiao Y, Wu J, Li D. Discovery of potent inhibitor for farnesyl pyrophosphate synthase in the mevalonate pathway. Chem Commun. 2010;46:5340–5342. doi: 10.1039/c0cc00992j. [DOI] [PubMed] [Google Scholar]
- 11.Leon A, Liu L, Yang Y, Hudock MP, Hall P, Yin F, Studer D, Puan KJ, Morita CT, Oldfield E. Isoprenoid Biosynthesis as a Drug Target: Bisphosphonate Inhibition of Escherichia coli K12 Growth and Synergistic Effects of Fosmidomycin. J Med Chem. 2006;49:7331–7341. doi: 10.1021/jm060492b. [DOI] [PubMed] [Google Scholar]
- 12.Webb MR. A continuous spectrophotometric assay for inorganic phosphate and for measuring phosphate release kinetics in biological systems. Proc. Natl. Acad. Sci. U. S. A. 1992;89:4884–4887. doi: 10.1073/pnas.89.11.4884. [DOI] [PMC free article] [PubMed] [Google Scholar]
- 13.Rieger CE, Lee J, Turnbull JL. A Continuous Spectrophotometric Assay for Aspartate Transcarbamylase and ATPases. Anal Biochem. 1997;246:86–95. doi: 10.1006/abio.1996.9962. [DOI] [PubMed] [Google Scholar]
- 14.Scott Reid T, Terry KL, Casey PJ, Beese LS. Crystallographic Analysis of CaaX Prenyltransferases Complexed with Substrates Defines Rules of Protein Substrate Selectivity. J Mol Biol. 2004;343:417–433. doi: 10.1016/j.jmb.2004.08.056. [DOI] [PubMed] [Google Scholar]
- 15.Sinensky M. Recent advances in the study of prenylated proteins. BBA-Mol Cell Biol. 2000;L 1484:93–106. doi: 10.1016/s1388-1981(00)00009-3. [DOI] [PubMed] [Google Scholar]
- 16.Crul M, de Klerk GJ, Beijnen JH, Schellens JH. Ras biochemistry and farnesyl transferase inhibitors: a literature survey. Anti-Cancer Drug. 2001;12:163–184. doi: 10.1097/00001813-200103000-00001. [DOI] [PubMed] [Google Scholar]
- 17.Pompliano DL, Gomez RP, Anthony NJ. Intramolecular fluorescence enhancement: a continuous assay of Ras farnesyl:protein transferase. J Am Chem Soc. 1992;114:7945–7946. [Google Scholar]
- 18.Krzysiak AJ, Rawat DS, Scott SA, Pais JE, Handley M, Harrison ML, Fierke CA, Gibbs RA. Combinatorial Modulation of Protein Prenylation. ACS Chem Biol. 2007;2:385–389. doi: 10.1021/cb700062b. [DOI] [PMC free article] [PubMed] [Google Scholar]
- 19.DeGraw AJ, Keiser MJ, Ochocki JD, Shoichet BK, Distefano MD. Prediction and Evaluation of Protein Farnesyltransferase Inhibition by Commercial Drugs. J Med Chem. 2010;53:2464–2471. doi: 10.1021/jm901613f. [DOI] [PMC free article] [PubMed] [Google Scholar]
- 20.Hooff G, Volmer D, Wood W, Müller W, Eckert G. Isoprenoid quantitation in human brain tissue: a validated HPLC-fluorescence detection method for endogenous farnesyl- (FPP) and geranylgeranylpyrophosphate (GGPP) Anal Bioanal Chem. 2008;392:673–680. doi: 10.1007/s00216-008-2306-3. [DOI] [PMC free article] [PubMed] [Google Scholar]
- 21.Tong H, Wiemer AJ, Neighbors JD, Hohl RJ. Quantitative determination of farnesyl and geranylgeranyl diphosphate levels in mammalian tissue. Anal Biochem. 2008;378:138–143. doi: 10.1016/j.ab.2008.04.021. [DOI] [PubMed] [Google Scholar]
- 22.Lee PC, Petri R, Mijts BN, Watts KT, Schmidt-Dannert C. Directed evolution of Escherichia coli farnesyl diphosphate synthase (IspA) reveals novel structural determinants of chain length specificity. Metab Eng. 2005;7:18–26. doi: 10.1016/j.ymben.2004.05.003. [DOI] [PubMed] [Google Scholar]
- 23.DeGraw AJ, Hast MA, Xu J, Mullen D, Beese LS, Barany G, Distefano MD. Caged Protein Prenyltransferase Substrates: Tools for Understanding Protein Prenylation. Chem Biol Drug Des. 2008;72:171–181. doi: 10.1111/j.1747-0285.2008.00698.x. [DOI] [PMC free article] [PubMed] [Google Scholar]
- 24.Gaon I, Turek TC, Weller VA, Edelstein RL, Singh SK, Distefano MD. Photoactive Analogs of Farnesyl Pyrophosphate Containing Benzoylbenzoate Esters: Synthesis and Application to Photoaffinity Labeling of Yeast Protein Farnesyltransferase. J Org Chem. 1996;61:7738–7745. doi: 10.1021/jo9602736. [DOI] [PubMed] [Google Scholar]
- 25.Ku B, Jeong JC, Mijts BN, Schmidt-Dannert C, Dordick JS. Preparation, Characterization, Optimization of an In Vitro C30 Carotenoid Pathway. Appl Environ Microbiol. 2005;71:6578–6583. doi: 10.1128/AEM.71.11.6578-6583.2005. [DOI] [PMC free article] [PubMed] [Google Scholar]
- 26.Kavanagh KL, Guo K, Dunford JE, Wu X, Knapp S, Ebetino FH, Rogers MJ, Russell RGG, Oppermann U. The molecular mechanism of nitrogen-containing bisphosphonates as antiosteoporosis drugs. Proc Natl Acad Sci USA. 2006;103:7829–7834. doi: 10.1073/pnas.0601643103. [DOI] [PMC free article] [PubMed] [Google Scholar]
- 27.Molecular Probes. [accessed Sep 30 2011];EnzChek® Pyrophosphate Assay Kit (E-6645) http://probes.invitrogen.com/media/pis/mp06645.pdf.


