

Abstract
The presence of gap junctions between rods in mammalian retina suggests a role for rod-rod coupling in human vision. Rod coupling is known to reduce response variability, but because junctional conductances are not known, the downstream effects on visual performance are uncertain. Here we assessed rod coupling in guinea pig retina by measuring: (1) the variability in responses to dim flashes, (2) Neurobiotin tracer coupling, and (3) junctional conductances. Results were consolidated into an electrical network model and a model of human psychophysical detection. Guinea pig rods form tracer pools of 1 to ∼20 rods, with junctional conductances averaging ∼350 pS. We calculate that coupling will reduce human dark-adapted sensitivity ∼10% by impairing the noise filtering of the synapse between rods and rod bipolar cells. However, coupling also mitigates synaptic saturation and is thus calculated to improve sensitivity when stimuli are spatially restricted or are superimposed over background illumination.
Introduction
Gap junctions are direct intercellular channels that allow electrical current and small molecules to pass between coupled cells. Rod photoreceptors of cold-blooded vertebrates are electrically coupled to one another (Fain, 1975; Zhang and Wu, 2005) through gap junctions located between adjacent rod inner segments (Custer, 1973; Zhang and Wu, 2004). In mammals, rod-rod gap junctions have been observed primarily in the outer plexiform layer, between rod spherules and between spherules and passing rod axons (Raviola and Gilula, 1973; Tsukamoto et al., 2001). Apparent gap junctions have also been reported between rod inner segments in macaque and human retina (Uga et al., 1970; Cohen, 1989).
In macaque retina, rod coupling was demonstrated by the spread of Neurobiotin within discrete pools of neighboring rods and by the reduction in rod response variability due to signal averaging within the coupled network (Hornstein et al., 2005). Although this effect of coupling on response variability in rods is well established (Fain, 1975; Attwell et al., 1984), downstream effects on visual performance are not well understood. Based on electrical measurements of rod light responses in macaque retina, Hornstein et al. (2005) calculated that rod-rod coupling elevates human psychophysical thresholds by as much as 62% for detection of diffuse stimuli, but also lowers thresholds for detection of very small spots of light. However, lacking direct measurements of junctional conductances between rods, those calculations relied on the simplifying assumption that small local groups of rods are coupled through infinite conductance.
Here we present results from guinea pig retina, including the first direct measurements of rod-rod junctional conductance in a mammalian retina. We incorporated these results into an electrical circuit model of the rod network and reexamined the effects of coupling on human visual detection, replacing the assumption of “perfect” coupling (i.e., rods coupled via infinite conductance) with our directly measured conductances. The updated model clarifies the impact of rod coupling on the psychophysical trade-offs governing mammalian night vision.
Materials and Methods
Retinal preparation.
Recordings were made from rod photoreceptors in isolated retinal preparations from 4- to 30-week-old pigmented guinea pigs, Cavia porcellus, of either sex. Guinea pigs were housed and cared for according to guidelines established by the National Institutes of Health. All procedures were approved by the University of California San Francisco Committee on Animal Research, which has approved assurance from the Office of Protection from Research Risks at the National Institutes of Health.
Guinea pigs were typically dark adapted for 1 h and all subsequent procedures were performed in darkness with infrared imaging. Following euthanasia and enucleation, the eye was hemisected anterior to the ora serrata, the vitreous was removed, and the eyecup was placed in 36°C bicarbonate-buffered Ames medium (Sigma) equilibrated with 95% O2/5% CO2. If a guinea pig had not been dark adapted before euthanasia, the eyecup was dark adapted for at least 1 h before recording. A 6 × 6 mm piece of retina was isolated and mounted photoreceptor side up in the recording chamber on a coverslip coated with poly-l-lysine (2 mg/ml, 150–300 kDa, Sigma).
Photoreceptors were visualized with infrared differential interference contrast (DIC) microscopy. To give recording electrodes clean access to photoreceptor plasma membranes, the retina was incubated for 3–15 min in Ames solution containing the following enzymes (in U/ml): 80 collagenase, 300 hyaluronidase, 500 deoxyribonuclease, and 0.2 chondroitin ABC lyase. The enzymes collagenase CLSPA, hyaluronidase HSEP, and deoxyribonuclease I DPFF were obtained from Worthington Biochemical. Chondroitin ABC lyase 190334 was obtained from ICN Biochemicals. In some cases, the enzyme treatment was simplified to a 3–5 min incubation in 2500 U/ml Deoxyribonuclease 1 (Sigma). After enzyme treatment, the retina was superfused with bicarbonate-buffered Ames medium maintained at 36°C.
A single female macaque monkey, Macaca mulatta, was used for characterizing voltage-dependent properties of primate rods. The retinal preparation was made as described previously (Hornstein et al., 2005), and subsequent methods were identical to those described below for guinea pig.
Electrical recording and light stimulation.
Rod membrane voltages and currents were recorded with patch electrodes (Schneeweis and Schnapf, 1995). The standard electrode solution contained (in mm): 130 K-gluconate, 10 KCl, 4 MgCl2, 10 HEPES, 3 ATP-Na2, 1 GTP-Na3, titrated to pH 7.25 with KOH. When loading cells with Neurobiotin or measuring junctional conductance with paired recordings, rods were recorded in whole-cell mode; otherwise, perforated patch recordings were made. For perforated recordings 0.12 mm amphotericin B (Sigma) was added to the standard electrode solution.
Electrical signals were recorded with an Axopatch 1D amplifier (Molecular Devices). Signals were low-pass filtered by Bessel analog filters with cutoff frequencies of 200 Hz for photovoltage recordings, and 2000 Hz for junctional conductance measurements. Signals were digitized at 1–5 kHz. Response latencies introduced by analog filtering were corrected. Additional digital filtering of records shown in figures are as indicated in figure legends. Signals were corrected for electrode junction potential, series resistance, and membrane leak errors (van Rijen et al., 1998).
Photoreceptors were stimulated with unpolarized, monochromatic (10 nm half-width) light. Stimulus intensity was calibrated before each experiment and was controlled by calibrated neutral density filters. Unless otherwise indicated, the wavelength of light was 500 nm and the flash duration 10 ms. R* (mean number of photoisomerizations per rod) was calculated as the product of the measured photon density and the rod collecting area. Based on the dimensions and photopigment density of guinea pig rods (Parry and Bowmaker, 2002; Yin et al., 2006), and 0.67 quantal efficiency (Dartnell, 1972), the collecting area was taken to be 1 μm2 for 500 nm wavelength.
Tracer coupling.
The tracer coupling of rods and cones in macaque retina was examined by including 12.4 mm Neurobiotin (Vector Laboratories) in the standard electrode solution, with a compensatory decrease in K-gluconate to 127 mm. The tracer diffused into photoreceptors while recording in whole-cell mode for 5–10 min.
Twenty to 90 min after tracer loading, the retina was placed in 4% paraformaldehyde in sodium phosphate buffer (PB) (0.1 m) for 45–60 min. The retina was then rinsed in PB and incubated overnight in a 1:200 dilution of cyanine 3-conjugated streptavidin (Jackson ImmunoResearch) and 0.3% Triton X-100 in PB. Finally, the retina was rinsed in PB and coverslipped with Vectashield (Vector Laboratories). Some retinas were subsequently reprocessed to label cones with peanut agglutinin. These retinas were rinsed in sodium PBS, and incubated overnight in a 1:50 dilution of fluorescein-conjugated peanut agglutinin (Vector Laboratories), 0.05% BSA, and 0.3% Triton X-100 in PBS. The retinas were then rinsed in PBS and re-coverslipped with Vectashield.
Cells were imaged with a Zeiss LSM 5 or LSM 700 confocal microscope. The extent of Neurobiotin spread between cells was not noticeably affected by variations in the time between Neurobiotin loading and fixation. Cells were counted as Neurobiotin-positive if their fluorescence intensity was at least 20% higher than peak background fluorescence, and the signal could be followed over a substantial portion of the cell's radial dimension. In practice, cell detection was straightforward as the cellular fluorescence signal usually exceeded background fluorescence by a factor of 10 or more.
Resistive network model.
The pool of coupled rods was first modeled as a resistive circuit network (see Figs. 4–6). Rods were modeled as a set of nodes a∈A, with each node having a membrane resistance to ground Ra. Gap junctions were modeled as resistances Ra→b = Rb→a between a subset of geometrically neighboring nodes a and b. Phototransduction was modeled as an independent current source ia at each photoreceptor node. The effects of membrane capacitance and voltage-activated conductances are considered below (see Complex impedance model).
Figure 4.
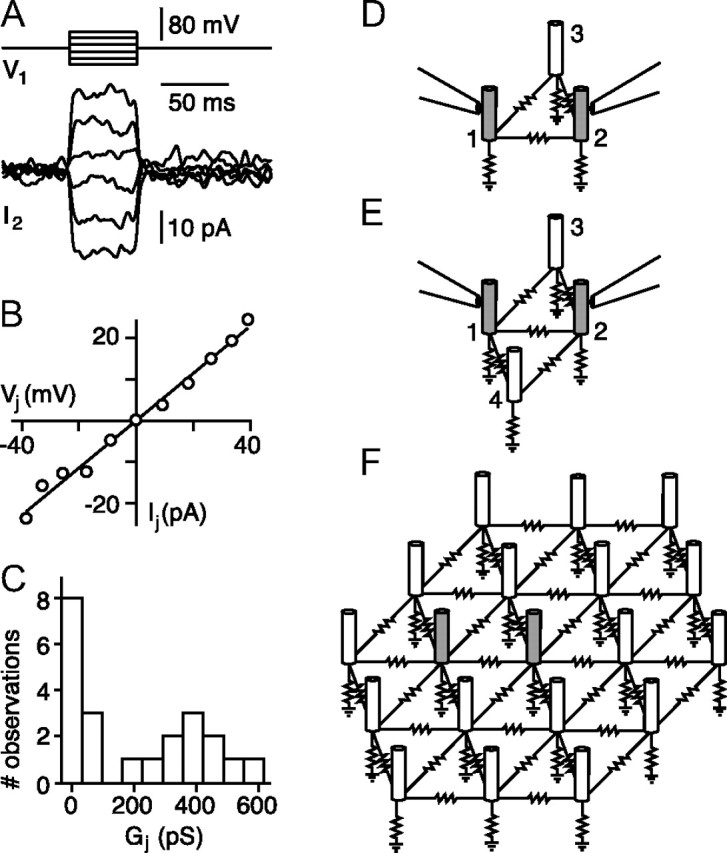
Rod-rod gap-junctional conductance. A, Changes in junctional current in a voltage-clamped rod in response to voltage steps applied to a neighboring rod. Bandwidth, DC–100 Hz. B, Peak junctional current IJ versus junctional voltage VJ for the rod pair in A averaged from 25 to 50 ms after onset of the voltage step. The slope of the best-fitting line gives a junctional conductance GJ of 572 pS. C, Histogram of GJ from 22 rod pairs. Measurements were corrected for series resistance. D, Schematic of indirect current path between two voltage-clamped rods, 1 and 2, via rod 3. E, Rod 4 provides an additional indirect path. F, In a hexagonal network, a maximum of two indirect paths with single intervening rods are possible.
Figure 5.

Hexagonal network modeling. A, DIC photomicrograph of the inner segment layer illustrating the roughly hexagonal packing of the guinea pig rod mosaic. Scale bar, 10 μm. B, Schematic of a resistive rod network model: a field of hexagonally packed rods grouped into several discrete coupled networks with varying connectivities. Rm is rod membrane resistance; Rj is gap junctional resistance. C, Network model with complex impedance. Cm is membrane capacitance; electrical equivalent of voltage-dependent conductances represented by an inductance L and shunt resistance RL. D, Average change in membrane potential in a guinea pig rod in response to a 1 pA current injection. Smooth curve gives the expected waveform of the voltage response of an isolated rod (equation 2 from Baylor et al., 1984a); best-fitting model parameters were Rm = 1.65 GΩ, RL = 3.50 GΩ, L = 450 MH, and Cm = 5 pF. Average of 100 responses. Vrest = −35 mV. Timing of the 300 ms current pulse indicated by the bar below the voltage trace. Bandwidth, DC–500 Hz.
Figure 6.

Primate rod network model. A, Average change in membrane current in a macaque rod in response to a pulse in holding potential from −50 mV to −51 mV. The response of an isolated rod is expected to decay exponentially; from the best-fitting exponential function (smooth curve) the calculated model parameters were Rm = 1.67 GΩ, RL = 1.15 GΩ, and L = 101 MH. Average of 100 responses. Timing of the 300 ms voltage pulse indicated by the bar below the current trace. Capacitive transients were reduced by filtering; bandwidth, DC–100 Hz. B, Schematic of the two-rod network with perfect coupling (Hornstein et al., 2005). Voltage transfer ratios relative to rod 1 are w1|1 = w1|2 = 0.5. C, Schematic of the four-rod network used in psychophysical modeling; voltage transfer ratios relative to rod 1 are w1|1 = 0.624, w1|2 = 0.154, w1|3 = 0.154, w1|4 = 0.068.
For a purely resistive network, the voltage Va at any node a depends on ia, Ra, and any net current flow from coupled neighbors:
 |
where the gap junctional conductance Gb→a ≡ 1/Rb→a is taken to be zero for unconnected nodes. Equation 1 can be rearranged to:
 |
where Ga ≡ 1/Ra. For the set of nodes A, Equation 2 defines a system of simultaneous linear equations in V:
with the conductance matrix S given by:
 |
and m ≡ |A| the total number of nodes. The network voltages under any combination of current inputs can then be calculated using the resistance matrix Ω ≡ S−1:
Solving for Ω given S is readily accomplished computationally for network sizes up to thousands of nodes. In the resistance matrix Ω, each element va|b represents the current–voltage transfer ratio from b to a. This value gives the voltage generated at node a for a current of unitary amplitude injected at node b.
Because S is symmetric, Ω is also necessarily symmetric so that va|b = vb|a. Thus, for any given pattern of network connectivity and set of membrane resistances and junctional resistances, the network inherently has the property that the voltage generated at a given a current injected at b is the same as the voltage generated at b given equivalent current injected at a.
For the rod networks modeled here, it was assumed that membrane and gap junctional resistances are uniform throughout the network, i.e., Ra = Rm for all a∈A, and Ra→b = Rb→a = Rj for all a and b that are directly coupled. In this case, it was useful to define, in addition to the current–voltage transfer ratio va|b, a voltage-voltage transfer ratio wa|b, which is equal to the voltage generated at a by any current input at b, normalized by the voltage that would have been generated at b if b were uncoupled:
 |
where wa|b = wb|a.
For uniform Rm and Rj, Equation 2 can be condensed to:
 |
where β ≡ Rj/Rm, Ba is the set of all nodes directly connected to a, and |Ba| is the number of elements in the set. The connectivity of a network of m rods was captured by an m-by-m symmetric matrix C with ones for directly connected rod pairs, and zeros for all other pairs. Rods were not considered connected to themselves. A normalized conductance matrix SC was then calculated from:
where SC ≡ Rj S, and D is an m-by-m diagonal matrix with the values on diagonal specified by (β + |Ba|).
The answer matrix W gives values of the voltage-voltage transfer ratios wa|b between all pairs of rods within the network:
Thus from the perspective of w, the behavior of the network depends only on β and on the pattern of connectivity C between neighboring nodes.
To relate the network model to the measured variability in responses to dim flashes, the peak current associated with a single photoisomerization was defined as j and input current at each photoreceptor node was calculated as jX, where X, the number of photoisomerizations, was Poisson distributed with an average value given by R*. Over many iterations, the peak voltage at node a has expected value:
 |
and variance:
 |
The coupling metric N, determined experimentally by fluctuation analysis, was predicted by the network model from:
 |
Thus, as with W, N depends only on β and C.
Tessier-Lavigne and Attwell (1988) derived a related quantity, Neff, defined as the network input resistance measured from node a, divided by the uncoupled membrane resistance Rm. In the present analysis this quantity corresponds to 1/wa|a. The precise relationship between N and Neff depends on the network connectivity, although both quantities increase with decreasing β and greater connectivity. In the present analysis, any two rod networks with differing connectivities but identical N will have an identical signal-to-noise ratio (SNR), while in the Tessier-Lavigne and Attwell (1988) analysis, rod networks with differing connectivity and identical Neff will generally have different SNRs.
Arbitrarily large geometric networks of cells were used as approximate representations of infinite networks. In practice, for a hexagonally connected network with β = 2.7 (see Results) and 4 concentric layers of cells (61 cells total), the calculated value of N did not increase significantly (<0.1%) with additional layers. In addition, equation 15 from the work by Lamb and Simon (1976) gives an analytic solution for the value wa|a for an infinite square network. Modeling moderate sized finite square networks via the computational method described here closely approximated their results. For a square network with β = 2.7 and only 13 cells total, the difference between our numerically computed wa|a for central node a and the value given by Lamb and Simon (1976) for an infinite network was <0.5%. This difference decreases further as the modeled finite network grows.
Complex impedance model.
To account for frequency-dependent effects of membrane capacitance and voltage-activated conductances, Equation 1 can be rewritten in terms of the complex membrane impedance:
 |
where the impedance Za depends on the frequency f of the input, and Va and ia also become functions of frequency. We modeled rod voltage-activated conductances as an inductance La in series with a shunt resistance RLa (Detwiler et al., 1980; Demontis et al., 1999). Placing the shunted inductance in parallel with the membrane resistance, and adding a parallel membrane capacitance Ca, the rod membrane impedance is then given by:
 |
where z = 2π f .
To characterize the frequency dependence of the current–voltage transfer of the network, we rearranged Equation 13, as was done for Equations 1–4, to arrive at the complex admittance matrix, Y(f). Solving for the inverse of Y yields a function matrix, H(f), whose complex elements va|b(f) give the magnitude and phase of the current–voltage transfer between nodes a and b. The effects of network filtering on photoresponse as calculated from H were further confirmed using circuit simulation software (GnuCAP, http://www.gnucap.org/), with large hexagonal netlist inputs created generatively via context-sensitive L-systems (Lindenmayer, 1968).
Psychophysical threshold detection model.
Psychophysical detection threshold was modeled as described previously (Hornstein et al., 2005), but expanded to replace the simplified perfect coupling model with the electrical network model described above. Following the treatment of Baylor et al. (1979), the probability distribution of response amplitudes in an isolated rod, pI(r), was modeled as Poisson distributed photon capture with single photon response peak amplitudes of α ± σ1 (mean ± SD), overlaid with Gaussian distributed dark noise (SD = σ0):
 |
The parameters α = 1 mV, σ1 = 0.4 mV, and σ0 = 0.4 mV, were chosen according to the values estimated previously in primate rods (Hornstein et al., 2005). To account for spontaneous thermal photopigment isomerizations, the value of R* in light and dark conditions was incremented by Ti ID, where Ti = 0.4 s is the integration time of the rod (Hornstein et al., 2005), and ID = 0.0063 R*/s is the dark rate of isomerization (Baylor et al., 1984b).
Equation 15 describes the expected distribution of responses in an isolated rod, a. If a is coupled to its neighbors, the expected distribution of amplitudes in a due to phototransduction in b is:
The total response distribution in a is obtained by convolving pa|b across every b∈ Ba.
Given that rods share signals, however, the response distributions across rods are not statistically independent of one another. Consequently, determining the voltage distribution for the output of the summed rod network based on the distributions from individual rods requires calculating the distribution of a sum of dependent random variables. For networks larger than a few rods, and given nonlinear synaptic output (see below), a numerical solution is computationally intractable. Therefore, the distributions of summed voltages for an entire coupled network were obtained via Monte Carlo simulation, as follows.
Voltages for rods within a coupled network were simulated by first generating photocurrent signals for each rod (Eq. 15), then linearly transferring signals between rods according to the network voltage-voltage transfer ratios, w. The resulting simulated rod voltages were then passed through two nonlinear stages representing the rod output synapse. The first stage was a cutoff nonlinearity that selectively attenuated low-amplitude noise while passing higher-amplitude signals (Field and Rieke, 2002). The cutoff nonlinearity was optimized for discriminating between the dark condition and a diffuse light flash of intensity 0.001 R*. This intensity reflects the threshold of human detection (Sharpe, 1990), defined here as the minimal flash intensity above which a human observer can correctly identify the flash versus no-flash presentation in ≥73% of trials. The cutoff was calculated by applying the expected rod response distributions in dark and light to equation 1 given by Field and Rieke (2002), and fitting the result with a cumulative Gaussian distribution.
The second stage of the rod output synapse was a saturating nonlinearity, whereby the synaptic output was truncated for responses >2 mV (Robson and Frishman, 1995; Berntson et al., 2004). At a flash intensity of 0.001 R* photon delivery is very sparse and hence the likelihood of amplitudes >2 mV in individual rods is very small. Consequently the effect of the saturating nonlinearity is negligible. However, for more concentrated spots of light delivered to a subregion of the entire detection pool, or for contrast detection against background illumination, the saturating nonlinearity can affect detection threshold (see Results).
Following the nonlinear transformations at the synapse, synaptic outputs were summed linearly across a pool of 104 rods to model input summation of the theoretical detector (Graham and Bartlett, 1939). The voltage distribution of this detector was computed by convolution of the synaptic output distributions of each independent discrete pool of coupled rods. Convolutions were calculated via frequency space multiplication and verified by selective Monte Carlo simulation.
Psychophysical detection was modeled as a two alternative forced choice task: a subject presented with two epochs, one with a flash and one without, must identify which epoch contained the flash. This task was modeled by calculating the expected amplitude distribution of the detector for the flash epoch, pF(r), and for the dark epoch, pD(r). Assuming that on each trial the subject identifies the epoch with the larger amplitude as the flash epoch, the fraction of trials in which the subject identifies the flash epoch correctly, FC, is given by:
 |
Detection threshold was defined as the total number of photoisomerizations in the detection pool at which FC = 0.73.
The amplitude distributions of the detector were also used to calculate the effects of coupling on signal detection in the presence of a background light. The calculations were based on the increment threshold data measured in a human rod monochromat (Sharpe et al., 1992). We assumed that 1 scotopic troland evokes 8.5 R*/s (Kraft et al., 1993). The amplitude distributions were adjusted to include the additional photoisomerizations evoked by the background. For a background of intensity IB, the mean number of additional photoisomerizations was taken as Ti IB. The effective number of photoisomerizations evoked by the 200 ms test flash of intensity IF was taken as TF IF, where TF was calculated from the integral of the convolution of the normalized flash response r(t) with the time course of the 200 ms flash s(t):
 |
where
tp is the time to the peak of the response, and K = (e/tp)n. For monkey rods, n = 2 and tp = 220 ms (Hornstein et al., 2005). The SNR was taken as the mean of pF(r) minus the mean of pD(r), divided by the SD of pF(r).
Results
Spectral sensitivity of guinea pig rods
Dark-adapted guinea pig rods were targeted for electrical recording based on their smaller inner segment diameters relative to cones (Yin et al., 2006). Rod identification was further confirmed by measuring spectral sensitivity in 9 cells (Fig. 1). Sensitivity at 430, 500, 570, and 660 nm was calculated as the inverse of the intensity evoking a half-saturating response. The mean spectral sensitivities were fit with a standard photopigment nomogram (Baylor et al., 1987), with corrections for photopigment self-screening calculated from reported transverse optical density (Parry and Bowmaker, 2002) and rod dimensions (Yin et al., 2006). The best-fit nomogram for the average spectral sensitivity function peaked at 496 nm, in agreement with previous estimates from microspectrophotometry (Jacobs and Deegan, 1994) and from electrical recordings in downstream retinal neurons (Yin et al., 2006).
Figure 1.

Guinea pig rod spectral sensitivity. Points plot the mean sensitivity of 9 rods for 430, 500, 570, and 660 nm wavelength stimuli. SDs are smaller than symbol diameters. The curve is equation 6 from Baylor et al. (1987) after correction for photopigment self-screening, with λmax = 496 nm.
Fluctuation analysis
Electrical coupling reduces variability in response amplitudes by averaging the membrane potential across neighboring rods (Fain, 1975; Hornstein et al., 2005). To study the effects of coupling on response variability we recorded rod voltage in perforated patch mode and measured responses to brief, full-field flashes at a series of intensities evoking ∼1–6 R* (mean number of photoisomerizations per rod). The large response variability in some rods indicated weak or no coupling (Fig. 2A), while the small variability in other rods was consistent with strong coupling (Fig. 2B).
Figure 2.

Coupling reduces the variability of dim flash responses. A, B, Rod voltage responses recorded in two rods to a series of dim flashes evoking ∼1 R*. Tick marks indicate flash timing. Bandwidth, DC–5 Hz. C, E, Response mean (C) and variance (E) of rod in A to 50–100 flashes evoking 1.5, 2.8, and 5.5 R*. D, F, Peak amplitude of the mean (μ) and variance (σ2) as a function of R*, measured from rod A (○) and B (▿). The lines near the data points are the best-fit linear functions passing through the origin. From the slopes of the lines, N was calculated as 0.9 (○) and 10.2 (▿). G, Histogram of N from 14 rods.
To quantify the signal averaging effect of coupling, we computed the ensemble mean and variance for 50–100 repetitions at each flash intensity (Fig. 2C,E). Both the peak amplitude of the mean (μ) and peak amplitude of the variance (σ2) were proportional to R* (Fig. 2D,F), as expected if photon responses summed linearly and amplitude variability was dominated by quantal fluctuations in the number of photoisomerizations. The average single photon response amplitude, calculated from the value of μ at R* = 1, was 0.61 ± 0.16 mV (mean ± SD, 14 rods). The waveform of the photon response could be described by Equation 19 with n = 3 and tp = 180 ms.
Response variability depends on the number of rods coupled, as well as on the ratio of gap junctional conductance to rod membrane conductance. As a metric to quantify the degree of coupling we calculated N, the number of “perfectly” coupled rods (Gj = ∞) that would lower response variability to the observed value. N was calculated from the mean and variance via: N = k12/k2, where k1 = μ/R* and k2 = σ2/R*. For uncoupled rods (N = 1), k12 = k2. The values for k1 and k2 were obtained from the slopes of the lines passing through the origin that best fit the functions μ versus R* and σ2 versus R* (Fig. 2D,F).
The measured variability in some rods (Fig. 2A and ○ in D,F) was consistent with the absence of electrical coupling (k12 ≈ k2), while in other rods (Fig. 2B and ▿ in D,F), the observed reduction in variability (k12 ≫ k2) was consistent with signal averaging within a coupled network. In 14 rods, the coupling metric N ranged from 0.7 to 11.6, averaging 4.8 ± 4.5 (Fig. 2G).
Tracer coupling
We determined the number of rods physically coupled to one another by recording from individual rods with whole-cell electrodes containing the tracer Neurobiotin and counting the rods subsequently labeled. Occasionally tracer pools also contained cones, as identified by peanut agglutinin binding and by the absence of a narrowing of the cell diameter between the inner segment and cell body (data not shown). Of 37 rod injections, only 5 showed tracer coupling to cones, and these pools were not included in the subsequent analysis.
Of the remaining 32 rod injections, 8 (25%) showed no tracer coupling (Fig. 3A) while 24 (75%) were coupled to one or more neighboring rods (Fig. 3B). The total number of rods in a tracer-coupled pool ranged from 1 to 21, averaging 4.0 ± 4.7 (Fig. 3C). Many rod pairs had multiple apparent sites of contact, including rod spherules, axons, cell bodies, and inner segments. Some rods appeared to be laterally separated by several micrometers from all the other rods in the pool at one plane within the photoreceptor layer (Fig. 3B), but were found to be in close apposition at a different plane. For most injections the labeling was restricted to a small clearly demarcated cluster of rods. However, in 2 injections labeling intensity decreased with distance from the injected rod until it was no longer detectable. Thus while rods generally appeared to be coupled in discrete pools, a continuous network of rods could not be ruled out in some instances.
Figure 3.

Rod tracer coupling. A, B, Combined confocal fluorescence and DIC images of the outer nuclear layer after single rod injections with Neurobiotin (green). Scale bar, 10 μm. A, Rod is not tracer coupled to neighbors. B, Four tracer-coupled rods. C, Histogram of tracer-coupled pool sizes for 32 Neurobiotin-filled rods.
Gap junctional conductance
To measure gap junctional conductance, we made whole-cell voltage-clamp recordings from pairs of neighboring rods. While holding one rod at a constant voltage, changes in that rod's membrane current were measured in response to voltage pulses applied to one of its neighbors (Fig. 4A). Changes in membrane currents were linear with voltage (Fig. 4B), reflecting the ohmic behavior of the gap junctions for brief voltage pulses. The slope of the current–voltage relationship gives the junctional conductance Gj. As expected for junctions between homologous cell types, conductance was symmetric; Gj was independent of which rod in the pair was the driver and which the follower.
Not all rod pairs showed measurable coupling conductances; in 11 of 22 paired rod recordings Gj was below the resolvable limit given measurement noise. The remaining 11 rod pairs had junctional conductances ranging from 195 to 580 pS, with an average of 386 ± 112 pS (Fig. 4C).
This estimate of Gj assumed that the only current path between rods was via a gap junction directly between the recorded rods. However, current could also flow via indirect paths through intervening mutually coupled rods and thus increase the apparent junctional conductance. For a pair of recorded rods connected directly to one another and also connected indirectly via one intervening rod (Fig. 4D) the fraction of the total measured current due to the indirect path would be (3 + β)−1 (see Materials and Methods). In guinea pig, with β = 2.7 (see Guinea pig rod network model), the indirect current would be 18% of the measured current. For a pair of coupled rods that are also connected via two indirect paths (Fig. 4E), the proportion of indirect current would increase to (2 + β/2)−1, or 30% of the measured current. If we assume hexagonal rod packing (Fig. 5A), there can be at most two such indirect paths with single intervening rods (Fig. 4F). In an infinite fully connected hexagonal network, there are an infinite number of indirect current paths with varying numbers of intervening rods. However, the proliferation of current paths to ground makes each indirect path more leaky such that the overall proportion of indirect current is never greater than (2 + β/2)−1. In practice, given the modest connectivity observed in tracer-coupling pools, the fraction of indirect current is expected to be small for most of the pairs from which we recorded. Rods may also be connected via intervening cones. However, the rod-evoked light responses recorded in dark-adapted cones in primate retina (Hornstein et al., 2005) and guinea pig retina (data not shown) are an order of magnitude smaller than those measured directly in rods. Consequently, network analysis indicates that any signaling from rod to rod via intervening cones is negligible.
Given that our recording electrodes were on the rod inner segments while gap junctions between rods are reported as far away as the rod synaptic spherule (Raviola and Gilula, 1973; Tsukamoto et al., 2001), the electrotonic distance between the inner segment and spherule might reduce the apparent junctional conductance. Smith et al. (1986) estimated ∼15% voltage loss across the axon connecting the inner segment and spherule in cat rods. Adjusting for species differences in axon diameter and length, we calculate the voltage loss in guinea pig rods to be ∼12%. Hence junctional conductance estimates could be underestimated by as much as 24%. However, to the extent that gap junctions are present between rod inner segments (Uga et al., 1970; Cohen, 1989), the electrotonic distance errors in Gj could be negligible. Overall, errors in the estimated junctional conductance due to incomplete space clamping or indirect current flow between rod pairs are expected to be small and opposing.
Guinea pig rod network model
A resistive circuit model of the rod network was constructed to consolidate the measurements of fluctuation analysis, junctional conductance, and tracer coupling, and to enable further psychophysical modeling. For the purposes of modeling, rod-cone coupling was ignored under the assumption that it would contribute negligibly to rod network behavior.
A roughly hexagonal packing pattern of rods was observed in the inner and outer segment layers (Fig. 5A). Since gap-junctional coupling requires close membrane apposition, and rods do not send processes to distant targets (Raviola and Gilula, 1973; Kolb, 1977), the model assumed that each rod could make direct gap junctional connections with at most six nearest neighbors. Rods were modeled as nodes with membrane resistances to ground (Rm) and current sources representing phototransduction. Some nodes were connected laterally through junctional resistances (Rj) to represent coupling (Fig. 5B).
The model assumed a value for Rm of 1.5 GΩ based on the instantaneous input resistances measured in our whole-cell recordings. Since input resistance is reduced by rod coupling, Rm was based on our highest measured input resistances. For comparison, Rm was estimated as 2.5 GΩ for guinea pig rods in bright light (Demontis et al., 1999). It was assumed that the average measured Gj of 386 pS was slightly overestimated due to indirect coupling through other rods (Fig. 4D–F). Hence the assumed value of Rj, where Rj = 1/Gj, was rounded up to 3 GΩ.
For a resistive network of a given connectivity, the signal averaging behavior of the network depends only on the ratio β = Rj/Rm. For guinea pig, with the resistances determined above, β = 2. Equations 9 and 12 were used to calculate signal transfer ratios and to predict the degree of signal averaging as quantified by N. For an infinite network of coupled rods with full hexagonal connectivity, the model predicts a value of N = 9.1. By restricting the connectivity of the model to just two surrounding layers of rods (19 rods total), the predicted N for the central rod was reduced by only 10%. Thus, with β = 2, signal averaging is effectively restricted to only the first few layers of surrounding neighbors, even for an infinite pool of connected rods.
Effects of capacitance on guinea pig rod network model
The inclusion of membrane capacitance into the network model had a negligible effect. In whole-cell recordings, rod membrane capacitance ranged from 5 to 10 pF (data not shown). Taking Ca = Cm = 10 pF for all a, and assuming Rm = 1.5 GΩ and Rj = 3 GΩ, we calculated the transfer matrix H for f = 0–10 kHz.
While capacitative filtering is expected to draw out the response time course and hence reduce the peak amplitude of the voltage responses in coupled cells, the magnitude of this effect was found to be negligible, reducing the peak amplitude of the signal transfer by <0.5%. Capacitance altered the times to the peak of the response in coupled cells as well, but this effect was also negligible.
Effects of voltage-activated conductances on guinea pig rod network model
Light-evoked hyperpolarization in guinea pig rods evokes changes in voltage-dependent conductances, resulting in membrane depolarization (Demontis et al., 1999). These conductance changes are expected to reduce the spread of photon signals within the rod network in a frequency-dependent manner (Detwiler et al., 1980). For small perturbations in membrane potential, this effect can be modeled by adding a shunted inductance in parallel with Rm (Fig. 5C) (Detwiler et al., 1980). In turtle and guinea pig rods recorded at room temperature (Detwiler et al., 1980; Demontis et al., 1999) the observed changes in membrane potential evoked by injecting small steps in current were consistent with an equivalent inductance L of 1–2 GH in series with a shunting resistance RL of 0.6–4.0 GΩ. The voltage transfer was thus band-passed (Eq. 14), with a peak at ∼1–2.5 Hz.
At mammalian body temperature however, we expect faster channel activation and a shift in the band-pass of signal transfer to higher frequencies (Demontis et al., 1999). We measured these effects in 8 guinea pig rods recorded at 35°C by applying a −1 mV voltage pulse from a holding potential of −50 mV, or by injecting a 1 pA hyperpolarizing current pulse (Fig. 5D). We observed voltage-activated conductances consistent with a modeled inductance of ∼250 MH in series with a shunt resistance of ∼2.5 GΩ. The voltage transfer under these conditions peaks at ∼8 Hz, significantly faster than the dynamics of the guinea pig photocurrent, which has 95% of its power below 5 Hz. Consequently the voltage-activated conductances quickly counteract the rod photoresponse, reducing rod-rod transfer by an additional 15% compared with the transfer in a purely resistive network. This reduction in signal transfer is equivalent to an increase in β from 2 to ∼2.7.
The filtering of the network is computed to have only a small effect on the time course of transferred signals, reducing the time-to-peak of the photovoltage in the neighboring cell by ∼3%, and reducing the integration time by ∼7%. While the effects on time course accumulate as the signal gets transferred from one rod to the next, the cumulative effect is small because signal spread is effectively restricted to only the first two layers of surrounding neighbors. As was shown above for the purely resistive network, by restricting the connectivity of the hexagonal model to just two surrounding layers of rods, the predicted N for the central rod was reduced by only 5% compared with that of an infinite hexagonal network. Thus, with β = 2.7, the temporal changes across the network are modest. These results were confirmed using a circuit simulator.
Taking voltage-activated conductances into account reduces the calculated value of N expected in a fully connected hexagonal network by 25%, from 9.1 to 6.8. This is the maximal expected value; with less than full connectivity (Fig. 5B), N would be <6.8. However, the values of N derived experimentally from responses to dim flashes (Fig. 2G) were observed to be as large as 11.6, suggesting that at least in some cases the coupling conductance or connectivity might be greater than that modeled here, or else that the counteracting effects of voltage-activated conductances were less. Although the packing of inner segments is roughly hexagonal (Fig. 5A), rods typically also have points of contact with additional neighbors in the nuclear layer (Hornstein et al., 2005, their Fig. 9B,C). Changing the hexagonal connectivity model to a square model in which each rod contacts 8 neighbors increases the calculated N from 6.8 to 9.9 for β = 2.7. The discrepancy between the maximal modeled versus observed values may further reflect the difficulty of precisely estimating N from fluctuation measurements when N is large and the amplitude of the light-evoked variance is small compared with the baseline fluctuations in variance.
Note that while the predicted value of N is highly sensitive to the value assumed for β, the signal transfer ratio w is only ∼60% as sensitive, and the psychophysical effects considered below are even less sensitive.
Primate rod network model
In macaque monkey, rods form tracer-coupled pools of 1–10 rods and exhibit signal averaging of N = 1–5.9 (Hornstein et al., 2005). Although junctional conductances have not been measured directly in primate rods, we asked whether an Rj of 3 GΩ as measured in guinea pig would be consistent with the tracer coupling and signal averaging found in primate. Taking Rm = 1.2 GΩ in primate rods (Schneeweis and Schnapf, 1995) and Rj = 3 GΩ gives β = 2.5.
Assuming from the tracer coupling data a maximal pool size of 10 rods, a hexagonal network was constructed with 1 central rod connected directly to an inner layer of 6 rods, and indirectly to 3 additional rods in a second layer. The predicted N = 5.6 was close to the maximum value of N = 5.9 measured in primate rod recordings. Thus the tracer coupling and signal averaging observed in primate rods are consistent with a model in which each rod connects to between zero and six neighbors with a junctional resistance of 3 GΩ.
Because the value of Rm = 1.2 GΩ in primate rods was derived by taking the ratio of the peak photon response amplitude of the photovoltage to the photocurrent (Schneeweis and Schnapf, 1995), any effects of voltage-dependent conductances on β were already accounted for. To ascertain whether voltage-dependent conductances play a role in shaping photon responses in primate, we measured membrane current in response to −1 mV pulses in 6 rods in macaque monkey at 35°C (Fig. 6A). Results were very similar to those in guinea pig except that the peak frequency was shifted to 6 Hz. Changes in the response kinetics were calculated to be small, reducing the time-to-peak in the neighboring rod relative to the central rod by ∼8%, and reducing the integration time by ∼6%. These temporal effects were ignored in the modeling described below.
Previous modeling of the effect of rod coupling on signal detection in primates (Hornstein et al., 2005) was based on fluctuation analysis and the simplifying assumption of perfect coupling between connected rods. Since the average N calculated from fluctuation analysis was 2.3 rods, the model had assumed a network consisting of pairs of rods coupled via Rj = 0 (i.e., N = 2, Fig. 6B). Here we enhanced the model by replacing perfect coupling with the more realistic junctional resistance of 3 GΩ. While the pattern of rod connectivity was found to be quite variable, for simplicity we assumed a uniform pattern of coupled rods whose network properties reflected the average behavior measured experimentally. Assuming a repeated arrangement of four rods linked in a ring (Fig. 6C) with β = 2.5, the model predicts N = 2.3, precisely the average value found experimentally in primate. Compared with the previous two-rod model, the four-rod resistive network is also a better match for the primate tracer data, where the average tracer-coupled pool size was 3.4 rods.
Human psychophysical model
Our rod-rod coupling measurements were incorporated into a psychophysical model to evaluate how coupling affects visual performance. For a given intensity and spatial pattern of retinal illumination, this model computed (1) the Poisson statistics of photon capture and resulting phototransduction in individual rods, (2) the spread of signal and noise across the rod network for a given coupling connectivity, (3) the signal and noise in rod-bipolar cells after accounting for nonlinearities at the rod output synapse, and (4) psychophysical detection performance, assuming that detection depends on dark/light comparison by a detector stage that linearly sums the output of bipolar cells, with input from a total of 10,000 rods (see Materials and Methods).
We found that a uniformly illuminated pool of 10,000 uncoupled rods yields a detection threshold of 9.7 photoisomerizations over the entire pool, closely matching earlier modeling (Hornstein et al., 2005) and the psychophysically measured threshold of 10 photoisomerizations (Sharpe, 1990). Under the perfect coupling assumption, where the detection pool was divided into 5000 pairs of coupled rods with Rj = 0 (Fig. 6B), detection threshold increased by 62% (Hornstein et al., 2005). This elevation in threshold can be attributed to less effective noise filtering at the rod-bipolar cell synapse of coupled rods (Field and Rieke, 2002). However, assuming instead a detection pool divided into 2500 discrete four-rod networks with realistic junctional resistance (Fig. 6C), the detection threshold for uniform illumination is calculated to be 11.0 photoisomerizations, just 13% greater than the threshold for uncoupled rods. Thus although the perfect and resistive coupling models were set to have equivalent SNRs within their respective rod pools (i.e., N ≈ 2), the resistive model performed significantly better in the psychophysical detection task. Replacing perfect coupling with realistic physiological junctional resistances mitigates most of coupling's putative detrimental effects by allowing the noise filtering nonlinearity of the rod synapse to function more effectively.
As the diameter of the model stimulus decreases so as to illuminate less than the full 10,000 rods in the detector pool, performance improves for resistively coupled networks relative to the uncoupled network (Fig. 7A). This improvement reflects the benefit of rod coupling in mitigating synaptic saturation as stimulus size decreases and photon density increases. For stimulus diameters < 0.11°, performance of the coupled network surpasses the performance of the uncoupled network. The smallest retinal image practically achievable, i.e., the retinal image resulting from a point source of light, is limited by the optics of the eye. This point-spread function, which varies with pupil size, was calculated as the Fourier transform of the modulation transfer function of the human eye (Artal and Navarro, 1994; Guirao et al., 1999). The transform is valid at the large pupil diameters (6–8 mm) typical for dark-adapted eyes (Spring and Stiles, 1948). For computational tractability, the light intensity was set to zero when the number of photons delivered per rod dropped to <0.05% of the total number of photons in the stimulus. For a 6 mm pupil diameter, the calculated detection threshold for a point source was found to be 30% lower in the coupled rod network compared with uncoupled rods; for an 8 mm pupil it was 17% lower (Fig. 7A, arrows). Thus at absolute threshold, electrical coupling is expected to have beneficial effects for detection of small stimuli, offsetting the modest detrimental effects expected for large stimuli.
Figure 7.

Coupling effects on human visual detection. A, Dark-adapted detection threshold for coupled rod network TC relative to uncoupled rod network TU, as a function of stimulus diameter on the retina. Points plot model calculations with β = 2.5. For small pupil sizes, the stimuli are all optically realizable, but for the larger pupils of dark-adapted eyes, stimuli <∼0.06° diameter are significantly broadened by the optical point spread function of the eye. Arrows indicate the threshold ratios calculated for a point source stimulus after accounting for optical blur of an eye with a 6 or 8 mm pupil. B, Signal-to-noise ratio of coupled rod network SNRC relative to uncoupled rod network SNRU as a function of background light intensity, with β = 2.5. Illumination in B is uniform across the detector pool. SNRs were modeled based on the psychophysical threshold data of a rod monochromat given by Sharpe et al. (1992). The curves in A and B are empirical functions fitted to the data points.
The extension of the dynamic range of the rod to rod bipolar synapse due to coupling is also expected to be beneficial for contrast detection against background illumination. As background intensity increases, the intensity of a just detectable test flash also increases, resulting in increasing synaptic saturation. Using the psychophysically derived incremental threshold data from a human rod monochromat (Sharpe et al., 1992), we calculated the SNR at the detector for stimuli that uniformly illuminated the detection pool (Fig. 7B). The calculation was limited to backgrounds < 3 R*/s, the range over which rods and rod bipolar cells maintain their dark sensitivity (Baylor et al., 1984b; Kraft et al., 1993; Dunn et al., 2006). The SNR of the coupled network surpassed that of the uncoupled network at background light intensities >0.17 R*/s, and exceeded it by 14% at the highest light levels modeled. Thus the benefits of coupling on incremental sensitivity also roughly balance the detrimental effects for detection at absolute threshold.
Discussion
Strength of rod coupling
We report here the first measurements of rod-rod junctional conductance in mammals. Our network model demonstrates that this conductance is roughly consistent with the signal averaging observed in guinea pigs as well as that in primates (Hornstein et al., 2005), suggesting that a conductance of this order could be a general feature of mammalian retinas.
The conductance of ∼350 pS between guinea pig rods is at the low end of reported gap junction conductances. For comparison, guinea pig cardiac cells, whose strong coupling is critical for synchronization of heart rhythms, can have junctional conductances approaching 4 μS (Kameyama, 1983), 4 orders of magnitude greater than reported here. With β ≈ 0.1, the cardiac network behaves much like a perfectly coupled syncytium. Even in retina, some gap junctions, such as those between fish horizontal cells, have conductances 2–3 orders of magnitude greater than those found here (Qian et al., 1993; Lu and McMahon, 1996). However, as shown by our circuit analysis, the relatively high membrane resistance of rods means that significant signal transfer occurs even with coupling conductances of only 350 pS. Furthermore, our psychophysical modeling indicates that stronger coupling would be undesirable for detection of dim stimuli. The bias toward weaker coupling seems to be a general feature of photoreceptor networks (Table 1).
Table 1.
Photoreceptor junctional conductances Gj
| Cell type | Mean Gj (pS) | References |
|---|---|---|
| Guinea pig rods | 386 | This study |
| Primate cones | 631 | Hornstein et al. (2004) |
| Ground squirrel cones | 317 | DeVries et al. (2002) |
| Ground squirrel cones | 217 | Li and DeVries (2004) |
| Salamander rods | 500 | Zhang and Wu (2005) |
The relatively weak coupling of mammalian rods is also roughly consistent with their junctional anatomy. The surface areas for gap junctions in mammalian rods, ∼0.01 μm2 (Uga et al., 1970; Raviola and Gilula, 1973; Cohen, 1989; Tsukamoto et al., 2001), are some of the smallest reported. The open probability, single channel conductance, and other properties of gap junction channels depend on the molecular subunits constituting the junctions. In cold-blooded vertebrates the rod-rod junction appears to be composed of connexin 35/36 (Zhang and Wu, 2004). Assuming that mammalian rod-rod gap junctions are also composed of connexin 35/36, with open probability of ∼0.8 and single channel conductance of ∼15 pS (Srinivas et al., 1999; Teubner et al., 2000), and with channel density of 1000–5000 μm−2 (Owen, 1985), the expected Gj would range from 120 to 600 pS, consistent with the range of our measured values. In mammals however, the connexin comprising rod-rod gap junctions has not been determined. Cx35/36 has been localized to contacts between mammalian rods and cones, but it may reside only on the cone side of these junctions (Lee et al., 2003; Dang et al., 2004). A direct test of the role of Cx36 in rod-rod coupling, e.g., a comparison of coupling in wild-type versus Cx36 knock-out mice (Deans et al., 2002), has not been attained.
Psychophysical significance of coupling
Our model shows that, for stimuli larger than 0.11° in diameter, rod-rod coupling is expected to reduce absolute sensitivity of human vision by up to 13%. However, the model also suggests that, by mitigating saturation of the rod synapse, coupling is beneficial for contrast detection as well as detection of small concentrated stimuli. Furthermore, as background intensities increase to ∼1R*/s and beyond, pupil size will decrease (Spring and Stiles, 1948), thus decreasing the minimal diameter of an optically resolvable stimulus and allowing the benefits of coupling to extend to detection of even smaller stimuli.
Here we assumed that rod synaptic nonlinearities do not vary with background light levels over the range of intensities modeled. But the nonlinearities optimized for separating signals from noise at absolute threshold are not optimal at brighter lights (Field and Rieke, 2002). Is the synapse altered during light adaptation so as to optimize for contrast sensitivity (Packer et al., 2010)? An inhibitory feedback pathway from horizontal cells to rods has been described in mouse retina (Babai and Thoreson, 2009) that could in principle subserve this function. Empirical estimates of both the high- and low-amplitude cutoffs of the rod synapse show considerable spread (Robson and Frishman, 1995; Field and Rieke, 2002; Berntson et al., 2004; Robson et al., 2004), suggesting that these synaptic nonlinearities might indeed be adaptable. However, studies that have specifically investigated reoptimization of the rod-bipolar cell synapse have not found evidence for it (Sampath and Rieke, 2004; Okawa et al., 2010).
Light adaptation may also modulate gap junction channels themselves by altering single channel conductance, channel open probability, or the number of channels at the junction. Indeed, light and dopamine have been found to modulate tracer coupling and signal averaging across rod-cone gap junctions in several species (Yang and Wu, 1989; Krizaj et al., 1998; Ribelayga et al., 2008; Li et al., 2009). In contrast, however, rod-rod tracer coupling in salamander was not modulated by dopamine even though rod-cone coupling was modulated by dopamine in the same retina (Krizaj et al., 1998). Furthermore, in studies where current flow across cone-cone and rod-rod gap junctions was measured directly, neither light nor pharmacology was found to modulate junctional conductance (Attwell et al., 1985; DeVries et al., 2002; Li and DeVries, 2004). Thus, adaptation of rod-rod coupling has not been demonstrated.
While our model was designed to ascertain the effects of coupling on visual threshold, it remains possible that coupling serves other purposes such as conduction of metabolites (Goldberg et al., 1999), intercellular adhesion (Elias et al., 2007), or visual detection in brighter light (Tessier-Lavigne and Attwell, 1988). From this perspective it remains critical that, for the junctional conductances found here, coupling is expected to cause only a modest detriment to visual performance at absolute threshold. Previously it has been proposed (Smith et al., 1986) that under scotopic conditions mammalian rods must decouple to avoid the detrimental impacts of coupling on absolute detection threshold. The current results show that with a realistic junctional conductance the detriment to absolute detection threshold is only modest, while for detection of small stimuli coupling can instead be beneficial.
Lateral coupling among roughly homogeneous networks of neurons, as demonstrated here for the mammalian rod system, is a common feature of neural circuitry (Hormuzdi et al., 2004; Söhl et al., 2005). The ultimate task of the rod system is to detect sparse signals among a convergent network of noisy sensors. An important insight is that, because rod signals converge downstream, the critical effect of coupling is not the observed signal averaging within the rod network itself, but rather the interaction between coupling and the synaptic nonlinearities that lie between the rod network and downstream convergence. The trade-off between less reliable encoding of weak signals and the relief of saturation at higher levels of activation may be a more general feature of coupling in neural circuits.
Footnotes
This work was supported by National Institutes of Health Grants EY07642 (J.L.S.) and Vision Research Core Grant EY02162, a Research to Prevent Blindness Senior Investigator Award (J.L.S.), a fellowship from the National Science Foundation Graduate Research Fellowship Program (P.H.L.), and support from That Man May See Inc. We thank Marie Burns, Felice Dunn, Greg Field, Loren Frank, Eric Hornstein, Jonathan Horton, Juan Korenbrot, and Erik Ullian for helpful discussions.
The authors declare no competing financial interests.
References
- Artal P, Navarro R. Monochromatic modulation transfer function of the human eye for different pupil diameters: an analytical expression. J Opt Soc Am A Opt Image Sci Vis. 1994;11:246–249. doi: 10.1364/josaa.11.000246. [DOI] [PubMed] [Google Scholar]
- Attwell D, Wilson M, Wu SM. A quantitative analysis of interactions between photoreceptors in the salamander (Ambystoma) retina. J Physiol. 1984;352:703–737. doi: 10.1113/jphysiol.1984.sp015318. [DOI] [PMC free article] [PubMed] [Google Scholar]
- Attwell D, Wilson M, Wu SM. The effect of light on the spread of signals through the rod network of the salamander retina. Brain Res. 1985;343:79–88. doi: 10.1016/0006-8993(85)91160-6. [DOI] [PubMed] [Google Scholar]
- Babai N, Thoreson WB. Horizontal cell feedback regulates calcium currents and intracellular calcium levels in rod photoreceptors of salamander and mouse retina. J Physiol. 2009;587:2353–2364. doi: 10.1113/jphysiol.2009.169656. [DOI] [PMC free article] [PubMed] [Google Scholar]
- Baylor DA, Lamb TD, Yau KW. Responses of retinal rods to single photons. J Physiol. 1979;288:613–634. [PMC free article] [PubMed] [Google Scholar]
- Baylor DA, Matthews G, Nunn BJ. Location and function of voltage-sensitive conductances in retinal rods of the salamander, Ambystoma tigrinum. J Physiol. 1984a;354:203–223. doi: 10.1113/jphysiol.1984.sp015372. [DOI] [PMC free article] [PubMed] [Google Scholar]
- Baylor DA, Nunn BJ, Schnapf JL. The photocurrent, noise and spectral sensitivity of rods of the monkey Macaca fascicularis. J Physiol. 1984b;357:575–607. doi: 10.1113/jphysiol.1984.sp015518. [DOI] [PMC free article] [PubMed] [Google Scholar]
- Baylor DA, Nunn BJ, Schnapf JL. Spectral sensitivity of cones of the monkey Macaca fascicularis. J Physiol. 1987;390:145–160. doi: 10.1113/jphysiol.1987.sp016691. [DOI] [PMC free article] [PubMed] [Google Scholar]
- Berntson A, Smith RG, Taylor WR. Transmission of single photon signals through a binary synapse in the mammalian retina. Vis Neurosci. 2004;21:693–702. doi: 10.1017/S0952523804215048. [DOI] [PubMed] [Google Scholar]
- Cohen AI. Interphotoreceptor contacts at the inner segment level in primate retinas. Brain Res. 1989;490:200–203. doi: 10.1016/0006-8993(89)90453-8. [DOI] [PubMed] [Google Scholar]
- Custer NV. Structurally specialized contacts between the photoreceptors of the retina of the axolotl. J Comp Neurol. 1973;151:35–56. doi: 10.1002/cne.901510104. [DOI] [PubMed] [Google Scholar]
- Dang L, Pulukuri S, Mears AJ, Swaroop A, Reese BE, Sitaramayya A. Connexin 36 in photoreceptor cells: studies on transgenic rod-less and cone-less mouse retinas. Mol Vis. 2004;10:323–327. [PubMed] [Google Scholar]
- Dartnell HJA. Photosensitivity. In: Dartnell HJA, editor. Photochemistry of vision. New York: Springer; 1972. pp. 122–145. [Google Scholar]
- Deans MR, Volgyi B, Goodenough DA, Bloomfield SA, Paul DL. Connexin36 is essential for transmission of rod-mediated visual signals in the mammalian retina. Neuron. 2002;36:703–712. doi: 10.1016/s0896-6273(02)01046-2. [DOI] [PMC free article] [PubMed] [Google Scholar]
- Demontis GC, Longoni B, Barcaro U, Cervetto L. Properties and functional roles of hyperpolarization-gated currents in guinea-pig retinal rods. J Physiol. 1999;515:813–828. doi: 10.1111/j.1469-7793.1999.813ab.x. [DOI] [PMC free article] [PubMed] [Google Scholar]
- Detwiler PB, Hodgkin AL, McNaughton PA. Temporal and spatial characteristics of the voltage response of rods in the retina of the snapping turtle. J Physiol. 1980;300:213–250. doi: 10.1113/jphysiol.1980.sp013159. [DOI] [PMC free article] [PubMed] [Google Scholar]
- DeVries SH, Qi X, Smith R, Makous W, Sterling P. Electrical coupling between mammalian cones. Curr Biol. 2002;12:1900–1907. doi: 10.1016/s0960-9822(02)01261-7. [DOI] [PubMed] [Google Scholar]
- Dunn FA, Doan T, Sampath AP, Rieke F. Controlling the gain of rod-mediated signals in the mammalian retina. J Neurosci. 2006;26:3959–3970. doi: 10.1523/JNEUROSCI.5148-05.2006. [DOI] [PMC free article] [PubMed] [Google Scholar]
- Elias LAB, Wang DD, Kriegstein AR. Gap junction adhesion is necessary for radial migration in the neocortex. Nature. 2007;448:901–907. doi: 10.1038/nature06063. [DOI] [PubMed] [Google Scholar]
- Fain GL. Quantum sensitivity of rods in the toad retina. Science. 1975;187:838–841. doi: 10.1126/science.1114328. [DOI] [PubMed] [Google Scholar]
- Field GD, Rieke F. Nonlinear signal transfer from mouse rods to bipolar cells and implications for visual sensitivity. Neuron. 2002;34:773–785. doi: 10.1016/s0896-6273(02)00700-6. [DOI] [PubMed] [Google Scholar]
- Goldberg GS, Lampe PD, Nicholson BJ. Selective transfer of endogenous metabolites through gap junctions composed of different connexins. Nat Cell Biol. 1999;1:457–459. doi: 10.1038/15693. [DOI] [PubMed] [Google Scholar]
- Graham CH, Bartlett NR. The relation of size of stimulus and intensity in the human eye: II. Intensity thresholds for red and violet light. J Exp Psychol. 1939;24:574–587. [Google Scholar]
- Guirao A, González C, Redondo M, Geraghty E, Norrby S, Artal P. Average optical performance of the human eye as a function of age in a normal population. Invest Ophthalmol Vis Sci. 1999;40:203–213. [PubMed] [Google Scholar]
- Hormuzdi SG, Filippov MA, Mitropoulou G, Monyer H, Bruzzone R. Electrical synapses: a dynamic signaling system that shapes the activity of neuronal networks. Biochim Biophys Acta. 2004;1662:113–137. doi: 10.1016/j.bbamem.2003.10.023. [DOI] [PubMed] [Google Scholar]
- Hornstein EP, Verweij J, Schnapf JL. Electrical coupling between red and green cones in primate retina. Nat Neurosci. 2004;7:745–750. doi: 10.1038/nn1274. [DOI] [PubMed] [Google Scholar]
- Hornstein EP, Verweij J, Li PH, Schnapf JL. Gap-junctional coupling and absolute sensitivity of photoreceptors in macaque retina. J Neurosci. 2005;25:11201–11209. doi: 10.1523/JNEUROSCI.3416-05.2005. [DOI] [PMC free article] [PubMed] [Google Scholar]
- Jacobs GH, Deegan JF., 2nd Spectral sensitivity, photopigments, and color vision in the guinea pig (Cavia porcellus) Behav Neurosci. 1994;108:993–1004. doi: 10.1037//0735-7044.108.5.993. [DOI] [PubMed] [Google Scholar]
- Kameyama M. Electrical coupling between ventricular paired cells isolated from guinea-pig heart. J Physiol. 1983;336:345–357. doi: 10.1113/jphysiol.1983.sp014585. [DOI] [PMC free article] [PubMed] [Google Scholar]
- Kolb H. The organization of the outer plexiform layer in the retina of the cat: electron microscopic observations. J Neurocytol. 1977;6:131–153. doi: 10.1007/BF01261502. [DOI] [PubMed] [Google Scholar]
- Kraft TW, Schneeweis DM, Schnapf JL. Visual transduction in human rod photoreceptors. J Physiol. 1993;464:747–765. doi: 10.1113/jphysiol.1993.sp019661. [DOI] [PMC free article] [PubMed] [Google Scholar]
- Krizaj D, Gábriel R, Owen WG, Witkovsky P. Dopamine D2 receptor-mediated modulation of rod-cone coupling in the Xenopus retina. J Comp Neurol. 1998;398:529–538. [PMC free article] [PubMed] [Google Scholar]
- Lamb TD, Simon EJ. The relation between intercellular coupling and electrical noise in turtle photoreceptors. J Physiol. 1976;263:257–286. doi: 10.1113/jphysiol.1976.sp011631. [DOI] [PMC free article] [PubMed] [Google Scholar]
- Lee EJ, Han JW, Kim HJ, Kim IB, Lee MY, Oh SJ, Chung JW, Chun MH. The immunocytochemical localization of connexin 36 at rod and cone gap junctions in the guinea pig retina. Eur J Neurosci. 2003;18:2925–2934. doi: 10.1046/j.1460-9568.2003.03049.x. [DOI] [PubMed] [Google Scholar]
- Li H, Chuang AZ, O'Brien J. Photoreceptor coupling is controlled by connexin 35 phosphorylation in zebrafish retina. J Neurosci. 2009;29:15178–15186. doi: 10.1523/JNEUROSCI.3517-09.2009. [DOI] [PMC free article] [PubMed] [Google Scholar]
- Li W, DeVries SH. Separate blue and green cone networks in the mammalian retina. Nat Neurosci. 2004;7:751–756. doi: 10.1038/nn1275. [DOI] [PubMed] [Google Scholar]
- Lindenmayer A. Mathematical models for cellular interactions in development. I. Filaments with one-sided inputs. J Theor Biol. 1968;18:280–299. doi: 10.1016/0022-5193(68)90079-9. [DOI] [PubMed] [Google Scholar]
- Lu C, McMahon DG. Gap junction channel gating at bass retinal electrical synapses. Vis Neurosci. 1996;13:1049–1057. doi: 10.1017/s0952523800007707. [DOI] [PubMed] [Google Scholar]
- Okawa H, Miyagishima KJ, Arman AC, Hurley JB, Field GD, Sampath AP. Optimal processing of photoreceptor signals is required to maximize behavioural sensitivity. J Physiol. 2010;588:1947–1960. doi: 10.1113/jphysiol.2010.188573. [DOI] [PMC free article] [PubMed] [Google Scholar]
- Owen WG. Chemical and electrical synapses between photoreceptors in the retina of the turtle, Chelydra serpentina. J Comp Neurol. 1985;240:423–433. doi: 10.1002/cne.902400410. [DOI] [PubMed] [Google Scholar]
- Packer OS, Verweij J, Li PH, Schnapf JL, Dacey DM. Blue-yellow opponency in primate S cone photoreceptors. J Neurosci. 2010;30:568–572. doi: 10.1523/JNEUROSCI.4738-09.2010. [DOI] [PMC free article] [PubMed] [Google Scholar]
- Parry JW, Bowmaker JK. Visual pigment coexpression in Guinea pig cones: a microspectrophotometric study. Invest Ophthalmol Vis Sci. 2002;43:1662–1665. [PubMed] [Google Scholar]
- Qian H, Malchow RP, Ripps H. Gap-junctional properties of electrically coupled skate horizontal cells in culture. Vis Neurosci. 1993;10:287–295. doi: 10.1017/s0952523800003680. [DOI] [PubMed] [Google Scholar]
- Raviola E, Gilula NB. Gap junctions between photoreceptor cells in the vertebrate retina. Proc Natl Acad Sci U S A. 1973;70:1677–1681. doi: 10.1073/pnas.70.6.1677. [DOI] [PMC free article] [PubMed] [Google Scholar]
- Ribelayga C, Cao Y, Mangel SC. The circadian clock in the retina controls rod-cone coupling. Neuron. 2008;59:790–801. doi: 10.1016/j.neuron.2008.07.017. [DOI] [PMC free article] [PubMed] [Google Scholar]
- Robson JG, Frishman LJ. Response linearity and kinetics of the cat retina: the bipolar cell component of the dark-adapted electroretinogram. Vis Neurosci. 1995;12:837–850. doi: 10.1017/s0952523800009408. [DOI] [PubMed] [Google Scholar]
- Robson JG, Maeda H, Saszik SM, Frishman LJ. In vivo studies of signaling in rod pathways of the mouse using the electroretinogram. Vision Res. 2004;44:3253–3268. doi: 10.1016/j.visres.2004.09.002. [DOI] [PubMed] [Google Scholar]
- Sampath AP, Rieke F. Selective transmission of single photon responses by saturation at the rod-to-rod bipolar synapse. Neuron. 2004;41:431–443. doi: 10.1016/s0896-6273(04)00005-4. [DOI] [PubMed] [Google Scholar]
- Schneeweis DM, Schnapf JL. Photovoltage of rods and cones in the macaque retina. Science. 1995;268:1053–1056. doi: 10.1126/science.7754386. [DOI] [PubMed] [Google Scholar]
- Sharpe LT. Night vision: basic, clinical and applied aspects. Cambridge, UK: Cambridge UP; 1990. The light-adaptation of the human rod visual system; pp. 49–124. [Google Scholar]
- Sharpe LT, Fach CC, Stockman A. The field adaptation of the human rod visual system. J Physiol. 1992;445:319–343. doi: 10.1113/jphysiol.1992.sp018926. [DOI] [PMC free article] [PubMed] [Google Scholar]
- Smith RG, Freed MA, Sterling P. Microcircuitry of the dark-adapted cat retina: functional architecture of the rod-cone network. J Neurosci. 1986;6:3505–3517. doi: 10.1523/JNEUROSCI.06-12-03505.1986. [DOI] [PMC free article] [PubMed] [Google Scholar]
- Söhl G, Maxeiner S, Willecke K. Expression and functions of neuronal gap junctions. Nat Rev Neurosci. 2005;6:191–200. doi: 10.1038/nrn1627. [DOI] [PubMed] [Google Scholar]
- Spring KH, Stiles WS. Variation of pupil size with change in the angle at which the light stimulus strikes the retina. Br J Ophthalmol. 1948;32:340–346. doi: 10.1136/bjo.32.6.340. [DOI] [PMC free article] [PubMed] [Google Scholar]
- Srinivas M, Rozental R, Kojima T, Dermietzel R, Mehler M, Condorelli DF, Kessler JA, Spray DC. Functional properties of channels formed by the neuronal gap junction protein connexin36. J Neurosci. 1999;19:9848–9855. doi: 10.1523/JNEUROSCI.19-22-09848.1999. [DOI] [PMC free article] [PubMed] [Google Scholar]
- Tessier-Lavigne M, Attwell D. The effect of photoreceptor coupling and synapse nonlinearity on signal:noise ratio in early visual processing. Proc R Soc Lond B Biol Sci. 1988;234:171–197. doi: 10.1098/rspb.1988.0043. [DOI] [PubMed] [Google Scholar]
- Teubner B, Degen J, Söhl G, Güldenagel M, Bukauskas FF, Trexler EB, Verselis VK, De Zeeuw CI, Lee CG, Kozak CA, Petrasch-Parwez E, Dermietzel R, Willecke K. Functional expression of the murine connexin 36 gene coding for a neuron-specific gap junctional protein. J Membr Biol. 2000;176:249–262. doi: 10.1007/s00232001094. [DOI] [PMC free article] [PubMed] [Google Scholar]
- Tsukamoto Y, Morigiwa K, Ueda M, Sterling P. Microcircuits for night vision in mouse retina. J Neurosci. 2001;21:8616–8623. doi: 10.1523/JNEUROSCI.21-21-08616.2001. [DOI] [PMC free article] [PubMed] [Google Scholar]
- Uga S, Nakao F, Mimura M, Ikui H. Some new findings on the fine structure of the human photoreceptor cells. J Electron Microsc (Tokyo) 1970;19:71–84. [PubMed] [Google Scholar]
- van Rijen HVM, Wilders R, van Ginneken ACG, Jongsma HJ. Quantitative analysis of dual whole-cell voltage-clamp determination of gap junctional conductance. Pflugers Arch. 1998;436:141–151. doi: 10.1007/s004240050615. [DOI] [PubMed] [Google Scholar]
- Yang XL, Wu SM. Modulation of rod-cone coupling by light. Science. 1989;244:352–354. doi: 10.1126/science.2711185. [DOI] [PubMed] [Google Scholar]
- Yin L, Smith RG, Sterling P, Brainard DH. Chromatic properties of horizontal and ganglion cell responses follow a dual gradient in cone opsin expression. J Neurosci. 2006;26:12351–12361. doi: 10.1523/JNEUROSCI.1071-06.2006. [DOI] [PMC free article] [PubMed] [Google Scholar]
- Zhang J, Wu SM. Connexin35/36 gap junction proteins are expressed in photoreceptors of the tiger salamander retina. J Comp Neurol. 2004;470:1–12. doi: 10.1002/cne.10967. [DOI] [PubMed] [Google Scholar]
- Zhang J, Wu SM. Physiological properties of rod photoreceptor electrical coupling in the tiger salamander retina. J Physiol. 2005;564:849–862. doi: 10.1113/jphysiol.2005.082859. [DOI] [PMC free article] [PubMed] [Google Scholar]