Abstract
Because the retinal activity generated by a moving object cannot specify which of an infinite number of possible physical displacements underlies the stimulus, its real-world cause is necessarily uncertain. How, then, do observers respond successfully to sequences of images whose provenance is ambiguous? Here we explore the hypothesis that the visual system solves this problem by a probabilistic strategy in which perceived motion is generated entirely according to the relative frequency of occurrence of the physical sources of the stimulus. The merits of this concept were tested by comparing the directions and speeds of moving lines reported by subjects to the values determined by the probability distribution of all the possible physical displacements underlying the stimulus. The velocities reported by observers in a variety of stimulus contexts can be accounted for in this way.
Physical motion is the continuous displacement of an object within a frame of reference; as such, motion is fully described by measurements of translocation. Perceived motion, however, is not so easily defined. Because the real-world displacement of an object is conveyed to an observer only indirectly by a changing pattern of light projected onto the retinal surface, the translocation that uniquely defines motion in physical terms is always ambiguous with respect to the possible causes of the changing retinal image (1–3). This ambiguity presents a fundamental problem in vision: how, in the face of such uncertainty, does the visual system generate definite percepts and visually guided behaviors that usually (but not always) accord with the real-world causes of retinal stimuli?
In the present article, we examine the hypothesis that the visual system solves this dilemma by a strategy in which the retinal image generates the probability distributions of the possible sources of the stimulus.
Methods
The stimuli we used consisted of a line translating from left to right in the frontal parallel plane behind an aperture. The line was presented at orientations of 20–60° in 10° increments relative to the horizontal axis (except for the inverted V aperture, in which case the moving line was presented at 10–50°). All stimuli subtended ≈4 × 4° and were shown on a 19-inch monitor at a frame rate of 25, 30, or 35 frames per second; the viewing distance was 150 cm. The luminance of stimulus line and aperture boundaries was 119 cd/m2 (white), and background 0.7 cd/m2 (black). The stimuli used in the control experiments mentioned at the end of Results were the same, except that the aperture boundaries were invisible, and the background was a uniform texture of intermediate luminance (46 cd/m2).
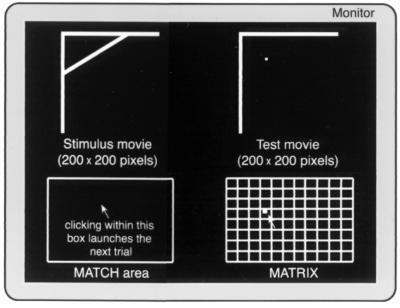
Subjects (the authors and three naïve subjects, all of whom had normal or corrected-to-normal vision) identified the direction and speed of the line by adjusting a dot that was initially moving in a random direction and speed, presented within a separate but otherwise similar aperture (Fig. 1). The observers were instructed to regard the stimuli as they would any other scene, and no feedback about performance was given. The perceived direction and speed of the moving line were indicated by clicking on a position in the matrix, the axes of which represented horizontal and vertical speed. When a judgment was made, the dot returned to the starting position, and the movie was shown again. This procedure was repeated until the subject judged that the velocities of the line and the dot were the same (usually within three to five presentations of the movie).
Figure 1.
Illustration of the stimuli used in the study (see text for explanation).
One run containing the five different line orientations for each aperture constituted a block, which took 8–10 min to complete. For each aperture type studied, the subjects performed the task for 10 blocks. To avoid adaptation, the time between blocks was at least 10 min; the interval between experiments for different stimulus parameters was at least a day. The total time for each subject to complete the full battery of tests (two apertures and the corresponding controls) was about 10–12 h, a workload distributed over several weeks. The test platform used was matlab Psychophysical toolbox (4).
A square-root-error criterion was used to compare subject performance and predicted percepts. The parameters that produced the least-square-root error were chosen as the most appropriate values for a particular experimental condition and are given in the relevant figure legends.
Results
If this concept of how we see motion is correct, then the perception of a sequence of retinal images will always be determined by the probability distribution of the set of all the possible physical sources underlying a sequence of projected retinal images: the speed and direction seen will simply reflect the shape of this distribution. Accordingly, the initial challenge in assessing this hypothesis about motion perception was to determine the probability distribution of the possible physical displacements underlying any given visual stimulus.
Theoretical Framework.
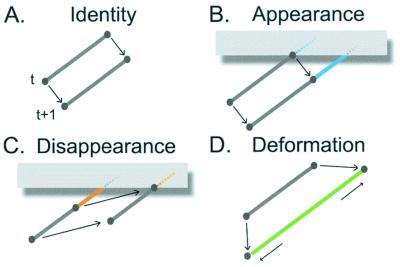
The physical motion underlying a sequence of images projected onto a plane is necessarily related to the set of all possible correspondences and differences between any two images in the series. Consider, for example, the stimulus sequences generated by the uniform translocation of a straight line (e.g., a rod at a given orientation moving steadily in the frame of reference; Fig. 2). With respect to any two lines projected onto a plane by such a source at different times, the logically complete set of correspondences and differences between any two sequential projections is given by: (i) the identity of line elements (i.e., points or line segments) in the two images; (ii) the appearance of new elements in the second image compared with the first from portions of the object previously hidden; (iii) the disappearance of elements in the second image compared with the first as a result of portions of the object that become hidden; and (iv) deformation of the projected line in the image sequence arising from movement of the object closer to or further from the image plane, rotation of the object, or its physical deformation. This definition of the correspondences and differences in any two sequential images is valid, in principle, for any type of image feature and any number of images in a sequence.
Figure 2.
The complete set of correspondences and differences between sequential images of a line moving uniformly is defined by four factors. (A) Identity. A line point or segment at time t that occupies any position on the visible line at time t + 1 defines identical elements in the two images (in this and subsequent figures, identity is indicated by a black line segment). (B) Appearance. The elements of the line indicated in blue at time t + 1 do not correspond to any of the elements visible at time t and have thus appeared in the interval between the generation of the two images. (C) Disappearance. The elements of the line indicated in red at time t do not correspond to any visible elements at time t + 1 and have thus disappeared in the interval. (D) Deformation. The projected line images can also differ as a result of movement of the source toward (or away) from the observer, by rotation, or by physical deformation (here indicated by a uniform extension of the line segment during the interval; deformation in subsequent figures is also indicated in green). Because the contributions of identity, appearance, disappearance, and deformation of the line elements are conflated in any two sequential images, the physical displacement underlying the stimulus generated by a moving line is profoundly ambiguous. Any account of the possible sources of the stimulus must therefore take into account the contributions of these four factors.
Constructing the probability distribution of the possible sources of a stimulus on this basis requires: (i) formally stating all the possible correspondences and differences in the sequence of images underlying a motion stimulus; (ii) describing quantitatively how these correspondences and differences in the image plane are generated; (iii) using this information to calculate how the contributions of identity, appearance, disappearance, and deformation are combined in a set of probability distributions that includes all of the possible real-world displacements underlying the stimulus; (iv) deriving a principle for combining the relevant probability distributions; and (v) devising a procedure to determine the expected perception on the basis of this combined probability distribution.
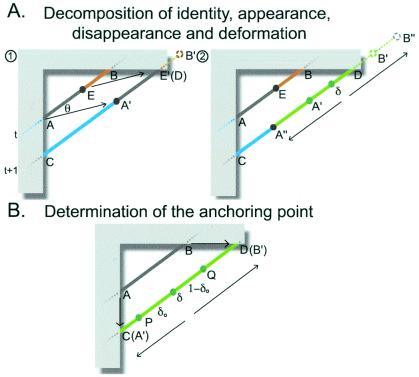
A first step in our approach was thus to provide a quantitative description of all the correspondences and differences in the image plane between two sequential projections in the image sequence. To this end, consider a linear object steadily translating in a given direction whose movement is limited to a frontal plane (Fig. 3). The example in Fig. 3A illustrates the relationship in the projected sequence of identity, appearance, disappearance, and deformation. In Fig. 3A1, the segment AE at time t is identical to segment A′E′ at time t + 1, defining identity. Appearance is defined by segment CA′ at t + 1 and disappearance by segment E′B′. Deformation is illustrated in Fig. 3A2 by extending segment A′B′ at t + 1 to segment A′′B′′. Note that when translation is in a frontal plane, all possible correspondences and differences in the projected line other than those generated by identity, appearance, or disappearance are limited to physical deformation (i.e., a stretching or contracting of the line along its axis rather than rotation or movement nearer to or further from the observer).
Figure 3.
Any projection sequence generated by the translation of a line in a frontal parallel plane can be decomposed into the contributions of identity, appearance, disappearance and deformation, as defined in Fig. 2. (A) Relationship of identity, appearance, disappearance and deformation. (1) Line AB at time t moves to A′B′ at time t + 1 at speed V and in a direction θ. In this example, AE and A′E′ are identical; segment CA′ appears in the interval, and segment EB disappears. (2) Line A′B′ is further deformed such that this segment is extended along its axis to A′′B′′. The positions of the points on A′′B′′ on CD can be calculated on the basis of the supposition of linear deformation and an anchor point δ, whose position is not changed by deformation. U1 = CA′′, and U2 = DB′′ are the two unmatched line segments resulting from line translation and deformation that are not visible at both t and t + 1. (B) Determination of the anchoring point. The mean position of the anchoring point (δ0) in the probability distribution P(δ) in Eq. 5 can be determined by the relation (1 − δ0):δ0 = DQ:CP. That is, (1 − δ0):δ0 = tan(α1):tan(α2); δ0 = 0.5, (α1 = α2 = 90°); α1 and α2 are the angles between line CD and lines connecting A and C and B and D, respectively.
A mathematical statement of the relationships between identity, appearance, disappearance, and deformation illustrated in Fig. 3 is as follows. Let V and θ represent the translation speed and direction, respectively, of the source giving rise to the projected line in the image plane in Fig. 3A1(θ being the direction relative to the line). Further, let α be the line orientation relative to the horizontal axis of the reference frame. The two unmatched parts of the lines in Fig. 3A2 (i.e., the parts of the lines not visible in the projections at both t and t + 1) can then be determined as functions of the underlying physical displacements. Thus, the unmatched segments CA′′ (denoted as U1) and DB′′ (denoted as U2) in Fig. 3A2 are given by
 |
 |
1 |
In these equations, α1 and α2 are the angles between the line at t + 1 and lines connecting A,C and B,D in Fig. 3A2, respectively. U1 > 0 if it lies to the right of the line connecting A and C; otherwise, U1 < 0. U2 > 0 if it lies to the left of the line connecting B and D; otherwise, U2 < 0.
Eq. 1 introduces two variables that describe the physical deformation of the line in Fig. 3A2: η, which signifies the extent of deformation, and δ, the coordinate of an anchoring point (defined as the position along the projected line that is not changed by deformation). The reason for introducing these variables is that the vectors at the aperture boundary cannot be taken simply as object velocities measured locally. The local configuration of the vectors of AC or BD along the aperture boundary in Fig. 3 could have been generated in an infinite number of ways; furthermore, the velocity vectors AC and BD cannot both belong to the motion field of a rigid object at the same time.
The next step was to determine the properties of the variables pertinent to deformation and anchoring. If L(t + 1) is the length of A′′B′′ at time t + 1 in Fig. 3A2, L(t) the length of AB at time t, and La the distance of the anchoring point from one of the end points of the line, then line length change caused by deformation is given by η = A′′B′′ − A′B′ = A′′B′′ − AB = L (t + 1) − L(t), and the anchoring point coordinate δ = La/L(t). To calculate the positions of A′′B′′ on CD, for example, it is necessary to determine (i) how much of the total line length change arises from deformation and (ii) the anchoring point. If the deformation is less than the total difference in the length of the projected line, then
 |
2 |
where Lv(t) and Lv(t + 1) are the lengths of line at time t and t + 1, respectively. They are modeled probabilistically because, given any two images, neither the amount of deformation nor the anchoring point is known.
The next requirement was to compute the probability distributions of the possible physical displacements underlying the stimulus. For the visible portion of the stimulus line in Fig. 3A, the probability Pr of any particular speed and direction (V, θ) is
 |
3 |
where V⊥ is the velocity measured normal to the orientation of the stimulus line, and Kr is the level of noise in the generative process and/or the relevant measurements. This equation is obtained under the assumption that for the visible portion of the stimulus line, only the velocity perpendicular to the line is measurable, and that the noise in this velocity caused by the generative process and/or the relevant measurements is additive Gaussian. This is a form of the so-called motion constraint equation (5).
Probability distributions P1 and P2 could likewise be computed for the two unmatched elements of the stimulus line, U1 and U2. For this purpose, we also used Gaussians, such that
 |
 |
4 |
In these expressions, U0 is the mean of these Gaussian distributions and depends on the geometrical relationship between the line and an explicit occluder or the occluder implied by the geometry of the line at subsequent positions. These distributions are obtained under the assumption that whether or not the line segments at the aperture boundary at t and t + 1 are related by identity depends on how much the line moves outside/inside the aperture between t to t + 1. Given additive Gaussian noise in the image formation process, Eq. 4 follows.
We also used Gaussians to specify the distributions of η and δ, such that
 |
 |
5 |
where η0, δ0 are the means of the Gaussians. The mean position (δ0) of the anchoring point (δ) was determined in the following way. Suppose that the change of the line length from t to t + 1 is entirely because of deformation, as in Fig. 3B. If the stimulus line is deformed linearly, which is the only form of deformation that can occur under the conditions considered in Fig. 3, then the coordinate of the mean position (δ0) of the anchoring point on the line is proportional to the displacement of the line AB along its terminator (i.e., AC and BD) projected onto the moving line (i.e., CP and DQ; see Fig. 2B). Thus,
 |
6 |
In this expression, δ0 = 0.5 if α1 = α2 = 90°; δ0 is measured from the line ending on the line connecting A and C. If δ0 = 0 or δ0 = 1, then one end of the line is the anchoring point itself. If 1 < δ0 < = +∞ or −∞< = δ0 < 1, then the anchoring point lies outside of the line segment. Thus, δ0 is uniquely determined by the relationship between the line and its visible ends as the orientation of the stimulus line changes. These several equations define, in probabilistic terms, the interplay of translation, deformation, and the geometrical configuration generated by the moving line and the aperture boundary, thus incorporating all of the physical degrees of freedom pertinent to motion stimuli of the sort considered in Fig. 3.
The three probability distributions directly relevant to the possible source of the stimulus (Pr, P1, and P2) must then be combined to provide the joint probability distribution needed to predict the perceived movement that the observer would be expected to see. If P(V, θ, η, δ) denotes this joint probability, then
 |
7 |
where P0 is the distribution of linear objects previously experienced by human beings, and the terms designated by w are the weights given to the relevant probability distribution Pr, Pr P1, PrP2 and PrP1P2 that could have generated any given stimulus. Note that 0 ≤ wr,w1,w2,w1,2 ≤ 1; wr + w1 + w2 + w1,2 = 1, and that the bracketed term on the right side of Eq. 7 includes competitive and cooperative combinations of probabilities.
For the stimuli used in the psychophysical tests below, there are only four conditional relationships of P1, P2, and Pr.
(i) Both U1 and U2 are determined by the same points on the line at the two subsequent positions. In this case, the product of P1, P2, and Pr is relevant to the joint probability distribution (6).
(ii) The visible endpoints at time t and t + 1 are not the same. In this case, U1 and U2 are not defined. Because there is no additional information available from the endpoints (6), the sources of the stimulus will be determined by the probability function Pr of the possible sources of the visible line.
(iii) Only the unmatched portion designated U1 is determined by the same point on the line at the two subsequent positions. In this case, only P1 multiplied by Pr is relevant to the joint probability distribution.
(iv) Only the unmatched portion designated U2 is determined by the same point on the line at the two subsequent positions. In this case, only P2 multiplied by Pr is relevant to the joint probability distribution.
These four cases exclude each other; more importantly, there is no way to be sure which of them underlies the stimulus. Thus they correspond to the four terms in the bracket in Eq. 7, each with a finite “weight” relevant to the likelihood of having caused the stimulus (i.e., the terms wr, w1, w2, w1,2). Because there is no basis for determining values of these weights from the first principles, they were assigned on the basis of psychophysical performance (see below) (see also ref. 7). Other possible principles for combining the relevant probability distributions (e.g., random combination of P1, P2, and Pr, winner-take-all competition between P1, P2, and Pr, or simple multiplication of P1, P2, and Pr) do not fully incorporate these four conditions or their exclusivity.
As a last step, a procedure is needed to draw conclusions from the joint probability distribution P(V, θ, η, δ). Here, speed (V) and direction (θ) are the primary variables, because observers sense (and report) the velocity of the stimulus line. Accordingly, we integrated out η and δ in P(V, θ, η, δ) such that
 |
8 |
Note that integrating out η and δ (8, 9) is not equivalent to dismissing the effects of η and δ.
To make specific behavioral predictions, we used the local mass mean. Thus,
 |
9 |
 |
where (V*, θ*) are the predicted speed and direction, respectively, −exp(−qv(V − V*)2 − qθ(θ − θ*)2) is a local loss function, and qv, qθ are positive constants. Because the local topography of the probability distribution is taken into account by this technique, it is more appropriate than mean, median or local maximum (10, 11).
Applying Eq. 9 (and making use of Eqs. 1–8) thus allows prediction of the direction and speed of a moving line stimulus that should be seen if motion perception were based solely on the probability distributions of the possible sources of the image sequence.
Perceptual Tests.
It has long been known that both the perceived direction and speed of a moving line are markedly affected by the context in which the source of the stimulus is viewed (3). When, for example, an obliquely oriented line moves horizontally from left to right, observers perceive the velocity of the object to be approximately that of the physical motion of the source. When, however, the same moving line source is occluded by a right angle aperture, the perceived direction of motion is downward and to the right at a slower speed (3). We therefore tested how well the probabilistic model described in the previous section accounts for these psychophysical observations.
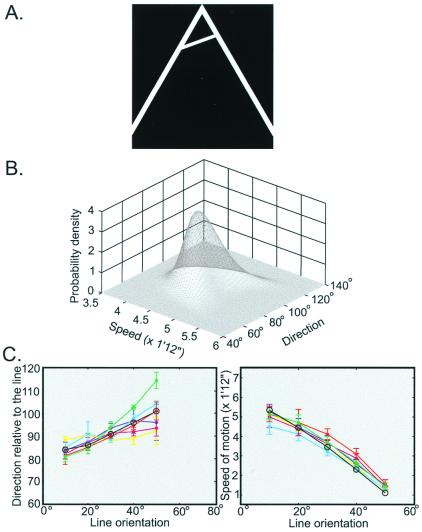
Fig. 4A illustrates an example of a stimulus of this type, and Fig. 4B the probability distribution of the possible velocities that underlie the stimulus in this context. As indicated in Fig. 4C, the directions of movement (and consequent speeds) reported by subjects are predicted remarkably well by the local mass mean of the possible sources of the stimuli. When the source line is set at an orientation of less than 45° with respect to the horizontal, the perceived direction of motion is biased away from the perpendicular toward the horizontal axis. Conversely, when the orientation of the moving line is greater than 45°, the perceived direction is biased to a lesser degree away from the perpendicular toward the vertical axis. In either case, the perceived speed of the line is systematically underestimated with respect to the speed associated with horizontal motion of the source (see also Fig. 7).
Figure 4.
Comparison of the perceived motion of a line moving across a right angle aperture and the perceptions predicted by the distribution of the possible sources of the stimulus. (A) A representative stimulus (line orientation = 40°). (B) Probability distribution of possible translations underlying the stimulus in A. (C) The directions (Left) and speeds (Right) of the motion perceived. Different colors represent data for each different subject (vertical bars are standard deviations). The black lines with circles are the predictions of the theory. In this and subsequent figures, directions are indicated in degrees relative to the moving line (90° being perpendicular to the line) and speeds as the distances in visual angle between two subsequent line positions in that direction. For all of the conditions, U0 in Eq. 4 and η0 in Eq. 5 were set to 0. K1, K2 in Eq. 4 were set to be equal. P0 in Eq. 7 was set to be a constant. wr in Eq. 7 was also set to 0. Kδ = 0.5 × 0.15−2 = 22, Kη = 0.5 [Lv(t + 1) − Lv(t)]−2, qv = 200, qθ = 1,640. In this experimental condition, w1= 0.01, w2 = 0.18, w1,2 = 0.81, Kr = 0.48; Kr = 10.20.
Figure 7.
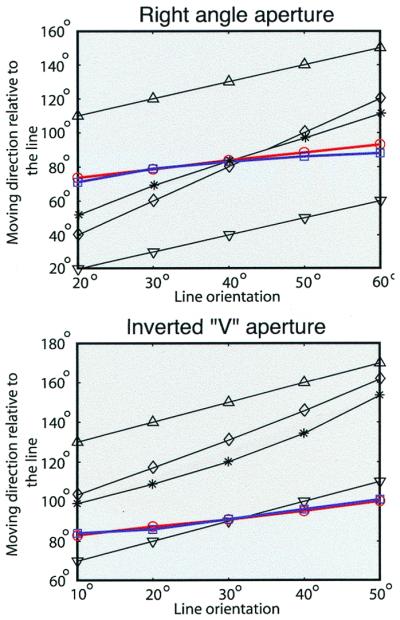
Comparison of the present predictions of the perceived directions with the predictions made by other models for a right angle aperture (Top) and an inverted V aperture (Bottom). Triangles indicate the directions of the left terminator and upside-down triangles the directions of the right terminator. Diamonds show the averages of terminator directions, and stars the average of the terminator directions and the direction perpendicular to the line. Red circles are the average response of six subjects studied here, and blue squares the predictions of the present theory. It is difficult to explain what subjects actually see without considering the complete set of possible stimulus sources.
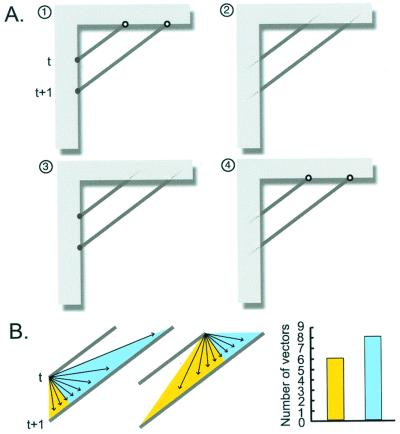
The empirical reason for these biases in the perceived velocity of the moving line is illustrated in Fig. 5. The stimulus in Fig. 4A could be generated by only four conditionally independent situations: (i) a linear object, both ends of which are fully in view (indicated by circles in Fig. 5A1; in this case, the difference in the stimulus line between t and t + 1 would arise entirely from deformation); (ii) a longer object seen through an aperture (Fig. 5A2); (iii) a longer object with only the right end actually occluded (Fig. 5A3); or (iv) a longer object with only the left end occluded (Fig. 5A4). Each of these conditions is associated with a different probability distribution of possible underlying sources; indeed, these are the four conditional relationships referred to in more general terms in the theoretical framework section (see above). For the stimulus in Fig. 4A, without other cues, the situation in Fig. 5A1 is the most probable. Furthermore, Fig. 5A4 is a little more likely than the situations shown in Fig. 5A2 and A3. The reason is indicated in Fig. 5B: for a line at this orientation translating in a frontal plane, there are more possible translational velocities (vectors in the area shaded blue) that could move the line to the right than downward (vectors in the area shaded yellow). Thus when the line orientation is less than 45° (i.e., toward the horizontal), the perceived direction will be biased away from the direction perpendicular to the line toward the horizontal axis. Conversely, when the line orientation is greater than 45°, the perceived direction will be biased toward the vertical axis.
Figure 5.
Empirical explanation of the biases in the perceived direction of motion of a line translating in the frontal parallel plane. (A) The four possible conditional relationships (1–4) pertinent to the projection lines in Fig. 4; see text for detailed explanation. (B) The two diagrams on the Left show that for a line oriented at an angle less than 45° with respect to the horizontal axis, there are more possible translational velocities whose direction of movement is to the right (vectors in the area shaded blue) than downward (vectors in the areas shaded yellow). The histogram on the Right shows this difference in terms of the number of vectors illustrated in Left. (Note that this preponderance of possible sources of translation will always bias perception toward the longer distance traveled along the side of the aperture; conversely, sources arising from deformation will bias perception toward the shorter distance traveled along side of the aperture.)
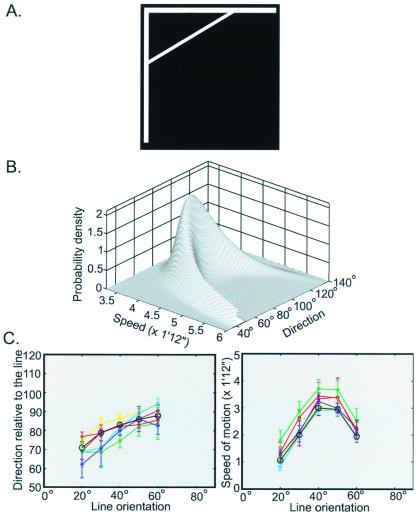
This same general argument should apply to the biases observed in any aperture. As a further challenge, therefore, we examined the perceived direction and speed elicited by a line moving across an aperture in the shape of an inverted V, with a vertex angle of 60° (Fig. 6A). Fig. 6B shows the probability distribution of the velocities that could underlie the stimulus in Fig. 6A and Fig. 6C the subjects' responses to a range of such stimuli. In this case, the perceived direction of motion lay between the perpendicular and the right side of aperture. More generally, when the line was oriented at a relatively small angle, the perceived direction was to the right of the perpendicular; when, however, the line was at a relatively large angle, the perceived direction was to the left side of the perpendicular. In both cases, the speed was systematically underestimated with respect to horizontal translation of the line. When the angle of orientation was very large, the perceived direction actually lay outside the boundaries of the aperture. As indicated in Fig. 6C, the performance of the subjects is remarkably well predicted by the probability distribution of the possible sources of the stimulus series (see also Fig. 7).
Figure 6.
Comparison of the perceived motion of a line moving across an inverted V aperture with a vertex angle of 60° and the values predicted. (A) A representative stimulus (line orientation = 20°). (B) Probability distribution of possible translations underlying the stimulus in A. (C) The directions (Left) and speeds (Right) of the motion perceived. Different colors represent data for each different subject. The black lines with circles are the predictions of the theory. In this experimental condition, w1 = 0, w2 = 0.18, w1,2 = 0.82, K1 = 2.80, Kr = 9.80.
Results similar to those illustrated in Figs. 4 and 6 were also obtained for circular and vertical apertures and in control experiments where the aperture boundaries were invisible.
Discussion
The fundamental problem in motion perception is the inevitable ambiguity of any sequence of images projected from a source onto a plane, such as the central retina: the observer must respond appropriately to the stimulus, but the sequence of retinal images does not allow a definite determination of its source. There is no analytical way to resolve this dilemma, because the requisite information is not present in the sequence of retinal images. This problem could be solved, however, if the perceived motion were determined by accumulated experience, such that the percept elicited would always be isomorphic with the probability distribution of the source of the stimulus. In this conception of motion perception (and vision more generally), the neuronal activity elicited by any particular stimulus would, over the course of both phylogeny and ontogeny, come to match ever more closely the probability distribution of the same or similar stimulus sequences (12). The aim of the experiments reported here was to test this hypothesis by establishing the probability distributions of the physical displacements underlying simple linear motion stimuli and then comparing the percepts predicted on this basis to the percepts reported by subjects.
To construct probability distributions that reasonably represent past experience with a simple source, such as a uniformly translating rod [the stimulus source studied by Wallach 65 years ago (3)], we considered the complete set of all of the correspondences and differences between any two projections in the image sequence and then used this conceptual framework to compute the probability distributions of the possible sources of the stimulus. In each of the cases we examined, the percepts reported could be accounted for in this way. In contrast, any theory of motion perception that fails to take into account: (i) the probabilistic nature of the geometrical configurations near where the moving line intersects the aperture boundary; (ii) the conceptual inconsistency between terminator velocities and rigid object movements (the fact, for instance, that terminator velocities are inconsistent with rigid motion); (iii) the interplay of all of the physical degrees of freedom underlying the stimuli; and/or (iv) the conditional probabilistic relationships between the events in space and time will have difficulty rationalizing these phenomena. For example, studies of the aperture problem (6, 13–18) have generally focused on an analysis of points along the aperture boundary, where the line terminators are taken to convey information about the underlying conditions (e.g., occlusion, transparency, or stereo disparity). The assumption in such studies is that motion perception can be determined by a visual evaluation of unique velocities at these points. However, explanations based on line terminators (6, 14, 16, 18), or even a quasiprobabilistic version of this concept (16, 18), do not accord with what subjects actually see (Figs. 4, 6, and 7).
Finally, we note that the wholly empirical strategy for responding successfully to inherently ambiguous motion stimuli is much the same as the strategy used to perceive other visual qualities. Evidently the visual system generates the perception of luminance, spectral differences, and orientation in the same general way (12).
Acknowledgments
We especially thank S. Nundy, J. Voyvodic, and B. Lotto for much advice and criticism. We are also grateful to T. J. Andrews, A. Basole, M. Changizi, D. Fitzpatrick, S. M. Williams, and L. White for useful comments. This work was supported by National Institutes of Health Grant NS29187.
References
- 1.Berkeley G. In: A New Theory of Vision and Other Writings. Ayers M R, editor. London: Everyman/J. M. Dent; 1975. [Google Scholar]
- 2.Brunswik E. The Conceptual Framework of Psychology. Chicago: Univ. of Chicago Press; 1952. pp. 16–25. [Google Scholar]
- 3.Wallach H. Perception. 1996;25:1317–1367. [Google Scholar]
- 4.Brainard D H. Spat Vis. 1997;10:443–446. [PubMed] [Google Scholar]
- 5.Horn B K P, Schunck B G. Artif Intell. 1978;17:185–203. [Google Scholar]
- 6.Shimojo S, Silverman G H, Nakayama K. Vision Res. 1989;29:619–626. doi: 10.1016/0042-6989(89)90047-3. [DOI] [PubMed] [Google Scholar]
- 7.Jordan M I, Jacobs R A. Neural Comput. 1994;6:181–214. [Google Scholar]
- 8.Freeman W T. Nature (London) 1994;368:542–545. doi: 10.1038/368542a0. [DOI] [PubMed] [Google Scholar]
- 9.Bloj M G, Kersten D, Hulbert A C. Nature (London) 1999;402:877–879. doi: 10.1038/47245. [DOI] [PubMed] [Google Scholar]
- 10.Yuille A L, Bülthoff H H. In: Perception as Bayesian Inference. Knill D C, Richards W, editors. Cambridge, U.K.: Cambridge Univ. Press; 1996. pp. 123–161. [Google Scholar]
- 11.Brainard D, Freeman W T. J Opt Soc Am A. 1997;7:1393–1411. doi: 10.1364/josaa.14.001393. [DOI] [PubMed] [Google Scholar]
- 12.Purves D, Lotto R B, Williams S M, Nundy S, Yang Z. Phil Trans R Soc London B. 2001;356:285–297. doi: 10.1098/rstb.2000.0772. [DOI] [PMC free article] [PubMed] [Google Scholar]
- 13.Nakayama K, Silverman G H. Vision Res. 1988;28:747–753. doi: 10.1016/0042-6989(88)90053-3. [DOI] [PubMed] [Google Scholar]
- 14.Lorenceau J, Shiffra M. Vision Res. 1992;32:263–273. doi: 10.1016/0042-6989(92)90137-8. [DOI] [PubMed] [Google Scholar]
- 15.Anderson B L, Sinha P. Proc Natl Acad Sci USA. 1997;94:3477–3480. doi: 10.1073/pnas.94.7.3477. [DOI] [PMC free article] [PubMed] [Google Scholar]
- 16.Liden L, Mingolla E. Vision Res. 1998;38:3883–3898. doi: 10.1016/s0042-6989(98)00083-2. [DOI] [PubMed] [Google Scholar]
- 17.Anderson B L. Vision Res. 1998;39:1273–1284. doi: 10.1016/s0042-6989(98)00240-5. [DOI] [PubMed] [Google Scholar]
- 18.Castet E, Charton V, Dufour A. Vision Res. 1999;39:915–932. doi: 10.1016/s0042-6989(98)00146-1. [DOI] [PubMed] [Google Scholar]


