

Summary
Background
Post-stroke language functions depend on the relative contributions of the dominant and non-dominant hemispheres. Thus, we aimed to identify the neural correlates of overt and covert verb generation in adult post-stroke aphasia.
Material/Methods
Sixteen aphasic LMCA stroke patients (SPs) and 32 healthy controls (HCs) underwent language testing followed by fMRI while performing an overt event-related verb generation task (ER-VGT) isolating activations related to noun-verb semantic processing or to articulation and auditory processing, and a covert block design verb generation task (BD-VGT).
Results
BD-VGT activation patterns were consistent with previous studies, while ER-VGT showed different patterns in SPs relative to HCs including less left-hemispheric involvement during semantic processing and predominantly right-sided activation related to articulation and auditory processing. ER-VGT intra-scanner performance was positively associated with activation during semantic associations in the left middle temporal gyrus for HCs (p=0.031) and left middle frontal gyrus for SPs (p=0.042). Increased activation in superior frontal/cingulate gyri was associated with better intra-scanner performance (p=0.020). Lesion size negatively impacted verbal fluency tested with Controlled Oral Word Association Test (p=0.0092) and the Semantic Fluency Test (p=0.033) and trended towards a negative association with verb generation performance on the event-related verb generation task (p=0.081).
Conclusions
Greater retention of pre-stroke language skills is associated with greater involvement of the left hemisphere with different cortical recruitment patterns observed in SPs versus HCs. Post-stroke verbal fluency may depend more upon the structural and functional integrity of the dominant left hemisphere language network rather than the shift to contralateral homologues.
Keywords: stroke, aphasia, verb generation, language lateralization, fMRI
Background
The outcome of patients with post-stroke aphasia is overall poor [1–3]. While there is ample evidence that the majority of aphasia recovery occurs early after stroke [4,5], the mechanisms of such recovery, the strategies to successfully augment recovery, and the efficacy of such strategies are less clear. These uncertainties prevents us from developing effective therapies to aid in post-stroke aphasia recovery that will afford these patients better reintegration into the society and assuming their pre-stroke roles. Therefore, it is incumbent upon us to understand the mechanisms of post-stroke language function and recovery in order to develop appropriate rehabilitative strategies.
The mechanisms of recovery after prenatal or early postnatal injury may be different from those after the damage acquired later in life [6]. For example, in children after hemispherectomy performed for the treatment of intractable epilepsy, language abilities are relatively independent of the side of resection (whether left or right) indicating that the early injury to the left hemisphere is met by the brain with extensive reorganization that leads to the preservation of language as the hierarchically most important function [6,7]. After a prenatal or early postnatal left-hemispheric stroke, language recovery may be dependent on shifting language function to contralateral homologues [8–13] though this notion has been recently disputed [14]. Nevertheless, greater recruitment of the right hemispheric homologues does not always result from left hemisphere damage [15] and is not always associated with improved language function [16]. Studies of adult stroke provide increasing evidence that functional preservation and recovery of ipsilateral (peristroke) language regions may provide greater advantage towards improved language function [17–22] than the right-hemispheric shift or dependence upon the functionality of intact right hemispheric regions.
Tasks utilized in previous neuroimaging studies of aphasia have employed both mental (i.e., covert) processing and intra-scanner performance monitoring (e.g., recording of push-button or overt verbal responses) to study language function. Recording intra-scanner responses while subjects are performing language tasks during functional magnetic resonance imaging (fMRI) is of particular importance for establishing the correlations between linguistic abilities and cortical stroke-related damage. Lack of this direct performance measure may limit the inferences that can be made regarding relationships between task performance and observed patterns of language-related activation during verb generation. In chronically aphasic stroke patients with static brain lesions, determining which areas are important for verbal fluency can improve our understanding of language function in post-stroke aphasia. Furthermore, while detailed analyses of individual neuroimaging and behavioral data are frequently performed to assess specific deficits and their unique cortical correlates, group analyses of stroke patients (e.g., in [12,19,22]) may provide an advantage by detecting group trends related to injury and subsequent recovery and function that may be beneficial for later development of interventions such as repetitive transcranial magnetic stimulation [22] or transcranial direct-current stimulation [23,24].
The leading hypothesis for this study was that the left middle cerebral artery (LMCA) stroke patients with aphasia will overall exhibit compensatory peristroke and right-hemispheric fMRI activation while performing an event-related verb generation task (ER-VGT) but that better verb generation performance will be associated with functional preservation and increased involvement of the dominant left-hemispheric language areas (i.e., cortical areas ipsilateral to the stroke). Therefore, the aim of this study was to identify the neural correlates of overt verb generation performance in LMCA stroke patients and to assess the relationship between intra-scanner performance and cortical recruitment. We utilized the ER-VGT with sparse fMRI data acquisition [25] that allowed for intra-scanner recording and assessment of overt responses when subjects were asked to generate verbs related to a given noun or to repeat the noun [26,27]. Subjects also performed a covert block-design verb generation task (BD-VGT) in order to confirm expected language distribution in the enrolled patients [12,28] as the ER-VGT has not been used previously in post-stroke aphasia subjects.
Material and Methods
Subjects
Sixteen LMCA adult stroke subjects (7 female), at least 6 months post-stroke (mean ±SD of 3.7±3.5 years) were recruited (Table 1). Stroke subjects had a Modified Rankin Scale score of 3 or better and were moderately to severely aphasic at time of study enrollment as assessed using the Token Test [29]. Using a ratio of two healthy control subjects (HC) for one stroke subject, a subset of 32 HC (14 female) were also included and matched as close as possible to stroke subjects for age, gender and pre-stroke handedness. All subjects were right-handed as determined by an Edinburgh Handedness Inventory (EHI) score ≥ 50 [30]. HC subjects had no history of neurological or psychiatric conditions. All subjects provided written informed consent before participating in the study and had no contraindications to undergoing a 3T MRI. This investigation was part of a larger ongoing study (NIH R01-NS04828), which was approved by the Institutional Review Board.
Table 1.
Demographic, clinical and performance variables for study subjects.
| Healthy (14F, 18M) | Stroke (7F, 9M) | |
|---|---|---|
| Age, years | 51.1 (9.0) | 54.4 (9.5) |
| Edinburgh Handedness Inventory score | 94.9 (8.0) | 90.3 (18.2) |
| Token Test score* | 43.7 (0.6) | 25.5 (11.3) |
| Clinical history | ||
| Hypertension | 6 (18.75) | 5 (31.25) |
| Diabetes Mellitus | 2 (6.25) | 2 (12.50) |
| High Cholesterol | 6 (18.75) | 9 (56.25) |
| Coronary Artery Disease | 0 (0.00) | 2 (12.50) |
| Myocardial Infarction | 0 (0.00) | 1 (6.25) |
| Atrial Fibrillation | 1 (3.13) | 2 (12.50) |
| Language assessments* | ||
| Peabody Picture Vocabulary Test score | 216.2 (7.2) | 197.2 (19.8) |
| Boston Naming Test score | 57.0 (3.7) | 40.4 (17.5) |
| Controlled Oral Word Association Test score | 41.6 (11.4) | 10.3 (6.8) |
| Semantic Fluency Test score | 56.3 (12.9) | 23.7 (14.0) |
| Complex Ideation score | 11.4 (0.9) | 8.4 (3.5) |
| BD-VGT noun recognition,% accuracy* | 94.6 (4.9) | 85.9 (10.9) |
| ER-VGT overt verb generation (15 trials)* | ||
| Number of correct trials | 13.2 (2.2) | 3.0 (3.7) |
| Number of correctly generated verbs | 28.2 (8.8) | 3.8 (5.9) |
| ER-VGT overt noun repetition (15 trials)* | ||
| Number of correct trials | 14.6 (0.8) | 11.6 (4.6) |
| Number of correctly repeated nouns | 65.0 (24.5) | 18.7 (11.6) |
Data are reported as mean (SD) except for clinical history variables which are reported as frequency (percentages).
Significant difference in performance between groups on the Token Test, language assessments, the BD-VGT and the ER-VGT (all p<0.05).
Language assessments
Pre-MRI language assessment was performed for all subjects. Subjects were tested for receptive vocabulary (Peabody Picture Vocabulary Test, Fourth edition [31]) and for word-finding and semantic retrieval skills (Boston Naming Test, Second edition [32]) which produced a standardized score for each test based on the subject’s correct responses. They were given two tests of verbal fluency which were scored based on the number of words they can say in one minute for a given letter (Controlled Oral Word Association Test [33]) or a given category (Semantic Fluency Test [33,34]). Subjects were also tested on their ability to comprehend and recall information for 12 items, from simple to more difficult material, that were orally presented by the examiner (Complex Ideation subtest of the Boston Diagnostic Aphasia Examination [35]). Independent samples t-tests (two-tailed) were performed using SAS, version 9.1 (Statistical Analysis System, SAS Institute, Cary, NC) to characterize differences in language function between LMCA stroke and HC subjects.
Verb generation tasks
The verb generation tasks used in this study were programmed and presented during fMRI using DirectRT (Version 2008; Empirisoft, www.empirisoft.com). The experimental fMRI task was a recently developed event-related verb generation task (ER-VGT) [26,27]. While performing this task, the subject is initially presented with a “Ready” screen for 4 seconds, followed by 45 12-second trials. MRI silence occurs during the first 6 seconds of each trial, followed by 6 seconds of fMRI data acquisition. Audio is recorded during MRI silence, and the subject is presented with an auditory stimulus, i.e., a concrete noun, and given visual instructions to respond either by thinking of verbs associated with the noun (covert generation), saying the associated verbs (overt generation), or repeating the noun (overt repetition). During the fMRI data acquisition that follows, the peak of the hemodynamic response to the prior event trial (i.e., noun presentation followed by covert generation, overt generation, or overt repetition) is sampled. Covert generation, overt generation and overt repetition each alternate 15 times during the task.
During the same imaging session, subjects also performed a block-design verb-generation task (BD-VGT) introduced initially by Petersen et al. (1988), later modified by Wise et al. (1991) and commonly used in fMRI studies [12,28,36–42]. Although the BD-VGT employs covert responses, this task was also used because it is a simple and well-established fMRI task that is easy to perform, with patterns of activation that have been demonstrated in stroke [12,28]. A detailed description of the BD-VGT is provided in our recent publications and is only briefly presented here [12,28,40]. In this task, subjects were aurally presented with a noun and were instructed to mentally (covertly) generate related verbs (5 30-second test blocks), or they had to bilaterally tap their fingers in response to a modulated tone (6 30-second control blocks).
Magnetic resonance imaging
Neuroimaging was performed using an 8-channel phased array head coil on a Phillips 3 Tesla Clinical MRI system. Subjects were fitted with MRI-compatible goggles and headphones (Avotec, Inc.) that were used to present the fMRI tasks and record verbal responses during the ER-VGT. Pre-scanning procedures including RF coil calibration and shimming were performed followed by a high-resolution T1-weighted anatomical MRI (repetition time/echo time = 8.1/3.7 msec, field of view = 25.0×21.1×18.0 cm, matrix =252×211, flip angle 8°, 1 mm slices; Figure 1). A multi-echo reference scan (MERS) was acquired to correct for geometric distortions and Nyquist ghost artifacts [43]. T2*-weighted fMRI scans were acquired using a gradient echo EPI (echo planar image) sequence (repetition time/echo time =2000/38 msec, field of view =24.0×24.0 cm, matrix =64×64, 32 axial slices, slice thickness =4 mm) while subjects performed two runs of the BD-VGT (165 scans/run, scan time/run of 5 min 30 sec) and one run of the ER-VGT (137 scans/run, scan time/run of 9 min 4 sec).
Figure 1.
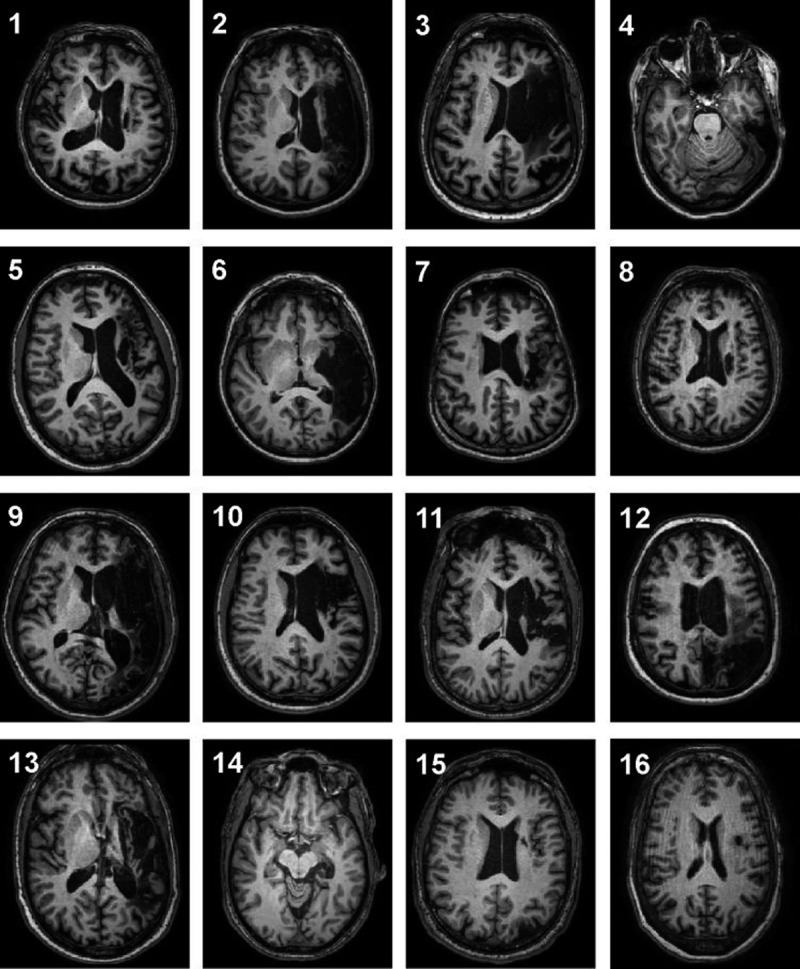
T1-weighted structural images of left middle cerebral artery lesions in 16 patients with ischemic stroke. Slice location selected to show the extent of the aphasia-producing stroke. Each axial slice is presented in radiological convention.
Behavioral data analysis
Following the scanning session, subjects performed a forced-choice recognition test for nouns presented during the BD-VGT; the percentage of correctly remembered nouns was an indirect measure of task performance [41,44]. Verbal responses were recorded during the ER-VGT, and the number of correct trials for each overt condition was defined as any trial in which at least one correct response was given. ER-VGT verb generation performance was assessed by counting the total number of correct verbs (i.e., excluding nouns, adjectives, other grammatical categories, repetitions of the same verb, semantically unrelated verbs and incomprehensible verbalizations) produced during the 15 trials of overt verb generation. For overt noun repetition, we also counted the total number of correct repetitions given over the 15 trials. Independent samples t-tests (two-tailed) were performed using SAS, version 9.1 (Statistical Analysis System, SAS Institute, Cary, NC) to test for group differences in each measure of behavioral performance.
MRI data analysis
CCHIPS (Cincinnati Children’s Hospital Image Processing Software; https://irc.cchmc.org/software/cchips.php), developed in the Interactive Data Language environment (www.ittvis.com), was used to visualize images and to perform image reconstruction, pre-processing, and statistical analyses. For the ER-VGT, we removed the first 2 scans (i.e., “Ready” screen presentation) since these were not relevant to the event-related analysis. For the BD-VGT, we removed the first control block of each run to allow for T1 equilibrium, followed by concatenation of the two runs into a single dataset. Standard image pre-processing steps were performed for each fMRI dataset including correcting for head motion between frames using a pyramid iterative algorithm [45] and spatial normalization into stereotactic space [46].
For both fMRI verb generation tasks, a general linear model (GLM) approach was performed to calculate relative differences in the magnitude of the hemodynamic response between task conditions [47]. The GLM accounted for subject head motion and low frequency (quadratic) signal drift by using these parameters as regressors in single subject analysis. For each subject, GLM contrasts were used to determine brain activation that is (1) greater for test blocks relative to control blocks during the BD-VGT (covert generation > finger-tapping) to isolate activation related to covert verb generation, (2) greater for overt verb generation relative to overt noun repetition during ER-VGT (overt generation > repetition) to capture brain activation related to processing noun-verb semantic associations, while controlling for articulation and auditory processing, and (3) greater for overt relative to covert verb generation during ER-VGT (overt > covert generation) to capture brain activation related to articulation and auditory processing, while controlling for semantic processing [26,27].
Group-level analysis was performed by constructing a composite dataset of each GLM contrast for each group of subjects. A one-sample t-test was performed for each composite dataset to create z-score maps illustrating the overall group effects for covert verb generation during BD-VGT (covert generation > finger-tapping), for processing noun-verb semantic associations during ER-VGT (overt generation > repetition), and for articulation and auditory processing during ER-VGT (overt > covert generation). As a final step, spatial smoothing using a 6 mm Gaussian filter was applied to each composite dataset. The resultant z-score maps consisted of activation clusters of at least 30 contiguous voxels (1920 μL) that were statistically significant at a corrected threshold of p<0.05, determined using a cluster simulation algorithm to account for multiple voxel comparisons and reduce false positive results [48]. A less stringent uncorrected threshold of p<0.001 was also used during group analysis.
To quantify the differences in lateralization of language-related activation between healthy and stroke subjects, anatomical regions of interest (ROIs) were selected based on previously defined frontal and posterior language areas [12]. The frontal ROI was comprised of anterior language areas in both hemispheres: inferior frontal gyrus (IFG), middle frontal gyrus (MFG) and anterior insula including BAs 13, 44, 45, 46, and 47. The posterior ROI applied to the BD-VGT (covert generation > finger-tapping) and ER-VGT (overt generation > repetition) contrasts was comprised of regions in and around Wernicke’s area and its contralateral homologue: superior temporal gyrus (STG), middle temporal gyrus (MTG), supramarginal gyrus and angular gyrus including portions of BAs 20, 21, 37, 38, 39, and 42. Due to the nature of the ER-VGT (overt > covert generation) contrast isolating activation related to articulation and auditory processing, the posterior ROI was restricted to the STG. We used the automatic anatomical labeling atlas [49] in AFNI [50] to create masks of the frontal and posterior ROIs that were used for subsequent lateralization index (LI) analysis in CCHIPS. For each subject and for each GLM contrast, the mean z-score was calculated separately within the frontal and posterior ROIs and used to calculate LI [51], which was then used to determine lateralization of each ROI: LI ≥0.1 is left lateralized; LI ≤−0.1 is right lateralized; −0.1< LI <0.1 is symmetric [38,41]. We used SAS, version 9.1 (Statistical Analysis System, SAS Institute, Cary, NC) to examine group differences in mean LI scores (two-sample t-tests) and in the distribution patterns of language lateralization (Fisher’s exact tests).
Associations between intra-scanner performance and fMRI activation
We also examined the relationship between intra-scanner performance and cortical involvement in verb generation by focusing on the ER-VGT contrast designed to isolate the processing of noun-verb semantic associations (overt generation > repetition). This ER-VGT contrast in the stroke group resulted in three clusters of significant activation (Figure 2A, bottom panel). One cluster was located in the left MTG, another in the superior frontal gyrus extending into the cingulate gyrus (SFG/CG), and a third cluster in the left MFG. Each cluster was defined as a functional ROI. Since a number of studies have demonstrated associations between improved performance and shifts in language-related activation to the non-dominant hemisphere [12,52–54], we also tested if verb generation performance depended on the observed rightward shifts in the stroke subjects’ lateral frontal and temporal ER-VGT activation related to articulation and auditory processing (overt > covert generation). Therefore, we also defined two functional ROIs, the right insula/IFG and the right STG, from this ER-VGT contrast. For each subject and functional ROI, values representing the degree of fMRI activation related to processing noun-verb semantic associations (i.e., the signal change from the group’s normalized mean of the activated voxels) were extracted. We assessed the relationship between ER-VGT verb generation performance and fMRI activation using Pearson’s correlation coefficient.
Figure 2.
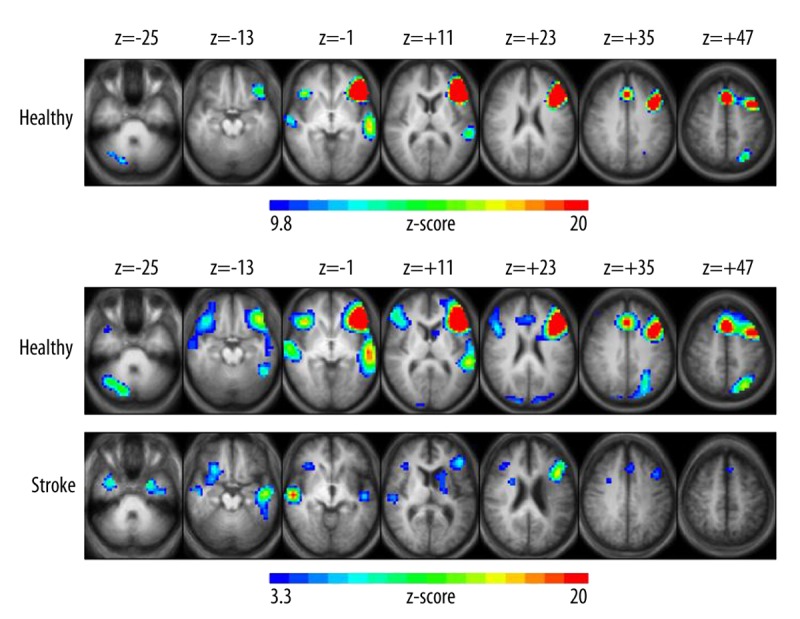
Group z-score maps for the block-design version of the verb generation task (BD-VGT). (A) Brain regions show increased activation related to covert verb generation in healthy subjects, with clusters of activation significant at p<0.05, corrected for multiple voxel comparisons and z-scores of activated voxels ranging from 9.8 (blue) to 20 (red) and a cluster threshold of at least 30 contiguous voxels. LMCA stroke group did not show activated clusters at this threshold. (B) At a lower threshold of p<0.001 uncorrected, both healthy (top panel) and LMCA stroke (bottom panel) subjects exhibit increased activation related to covert verb generation. Z-scores of activated voxels range from 3.3 (blue) to 20 (red). Each z-score map is presented in radiological convention, with left on the picture corresponding to the right hemisphere, and are superimposed on an average T1-weighted image generated from all subjects of each group. The 7 axial slices selected for each display panel range in Talairach coordinates from z=−25 mm (left) to z=+47 mm (right).
Determination of lesion size and its associations with performance
Our data is comprised of a sample of left ischemic stroke patients with aphasia. A representative image of each subject’s stroke lesion is illustrated in Figure 1. For each LMCA stroke subject, brain lesions were manually traced on his or her T1-weighted anatomical MRI by a trained neuro-anatomist, and the residual volume (mm3) of the stroke was calculated using the number of voxels within the lesion. Aphasia type for each patient was determined by a linguistics expert using results from the battery of language assessments. Table 2 gives a summary of the lesions and aphasia type for each LMCA stroke subject. We examined the relationship between lesion size and intra- and extra-scanner language performance using Pearson’s correlation coefficient.
Table 2.
Description of lesions for the 16 LMCA stroke patients.
| Patient | Sex | Age | Years post-stroke | Type of aphasia | Left hemishere lesion location | Lesion volume (mm3) |
|---|---|---|---|---|---|---|
| 1 | F | 78 | 4.1 | Anomic, mild dysarthria | Insular cortex with extension to subcortical white matter and corona radiata | 5,438 |
| 2 | F | 41 | 5.8 | Anomic | Entire temporal lobe with extension to posterior frontal and anterior parietal regions (includes entire insula) | 113,019 |
| 3 | M | 61 | 11.4 | Anomic, mild dysarthria | Inferior frontal and temporal area with posterior frontal and anterior parietal extension (includes entire insula) | 110,990 |
| 4 | F | 63 | 0.5 | Mild dysfluency, mild anomia | Temporo-occipital junction | 4,692 |
| 5 | M | 54 | 1.6 | Nonfluent | Anterior temporal with extension to lateral temporal and fronto-temporal regions (including anterior frontal convexity) | 105,391 |
| 6 | F | 55 | 10.3 | Nonfluent (Broca-type) | Lateral temporal with extension to fronto-temporal junction and posteror frontal convexity | 83,543 |
| 7 | M | 38 | 1.9 | Nonfluent, dysarthria, frequent paraphasias | Insular/sub-insular | 19,612 |
| 8 | F | 64 | 0.5 | Anomic | Striatum/corona radiata | 3,022 |
| 9 | M | 56 | 3.4 | Nonfluent (Broca-type) | Entire middle cerebral artery territory | 248,860 |
| 10 | M | 53 | 5.0 | Anomic | Inferior and middle frontal gyri | 54,391 |
| 11 | M | 55 | 1.2 | Anomic, conduction | Inferior frontal and insular with extension into posterior frontal regions | 54,538 |
| 12 | F | 51 | 6.5 | Nonfluent (Broca-type) | Temporo-parieto-occipital with extension to superior convexity of fronto-parietal region | 193,692 |
| 13 | M | 48 | 6.1 | Mild dysfluency, poor comprehension | Posterior temporal and extensive corona radiata/posterior frontal lesion | 63,351 |
| 14 | M | 46 | 0.5 | Mild anomia | Medial temporal lobe and thalamus | 2,802 |
| 15 | M | 52 | 0.5 | Mild dysfluency, mild anomia | Temporo-occipital junction and corona radiata extending to gyrus parietalis inferior | 16,588 |
| 16 | F | 56 | 0.5 | Nonfluent, poor comprehension | Upper left insula and underlying white matter with extension into corona radiata | 5,721 |
Results
Language assessment and behavioral performance
Prior to MRI scanning, all subjects received a battery of language assessments. Performance variables are summarized in Table 1. As expected, HC subjects performed significantly better than LMCA stroke subjects on all language assessments, on BD-VGT post-scan noun recognition, and on all ER-VGT intra-scanner behavioral measures (all p<0.05).
Functional MRI activation and language lateralization
GLM analysis was performed for each task to determine task-related activation [47]. The following describes specific fMRI activation and language-related lateralization patterns within each group for each GLM contrast in greater detail. Brain regions showing significant activation in the z-score maps are listed in Table 3. Lateralization index (LI) scores, calculated using anatomical ROIs of frontal and posterior language areas used previously [12], and lateralization categories are summarized in Table 4.
Table 3.
Activation foci (centroid Talairach coordinates) and Brodmann’s Areas (BAs) for the activated brain regions for the group z-score maps shown in Figures 2 and 3.
| Group | Regions | BAs | X, Y, Z | |
|---|---|---|---|---|
| BD-VGT Covert Verb Generation | Healthy (Fig. 2a) | R. Cerebellum | 21, −68, −27 | |
| L. Middle/Superior Temporal Gyrus | 21, 22, 38, 42 | −56, −24, 3 | ||
| R. Superior Temporal Gyrus | 38, 42 | 57, −15, 0 | ||
| L. Middle/Inferior Frontal Gyrus, Insula | 9–11, 13, 44–47 | −39, 23, 17 | ||
| R. Inferior Frontal Gyrus, Insula | 13, 44–47 | 39, 25, −1 | ||
| L./R. Superior Frontal/Cingulate Gyrus | 32, 6, 8, 9 | −3/3, 19, 49 | ||
| L. Inferior Parietal Lobule | 40 | −26, −64, 44 | ||
| Stroke (Fig. 2b) | L. Caudate | −17, 4, 14 | ||
| L. Parahippocampal/Middle/Superior Temporal Gyrus | 28, 21, 22, 38 | −42, −15, −13 | ||
| R. Middle/Superior Temporal Gyrus | 21, 22, 38, 42 | 46, −8, −9 | ||
| L./R. Superior Frontal Gyrus | 6 | −3/3, 23, 38 | ||
| L. Middle/Inferior Frontal Gyrus | 9, 44, 45, 46 | −41, 22, 21 | ||
| R. Inferior Frontal Gyrus | 47 | 32, 24, −2 | ||
| ER-VGT Processing Semantic Associations | Healthy (Fig. 3a) | L. Cerebellum | −20, −59, −19 | |
| R. Cerebellum | 17, −60, −24 | |||
| L./R. Lingual Gyrus, Cuneus, Precuneus | 17–19, 31 | −8/8, −68, 5 | ||
| L./R. Cingulate Gyrus (posterior) | 23, 29, 30 | −6/6, −48, 11 | ||
| R. Inferior Frontal Gyrus, Insula | 45, 46, 47, 13 | 34, 23, 0 | ||
| L. Middle/Inferior Frontal Gyrus, Insula | 6, 8–10, 44–47 | −39, 25, 22 | ||
| L. Middle/Superior Frontal Gyrus | 8, 9, 10 | −17, 52, 27 | ||
| L./R. Superior Frontal/Cingulate Gyrus | 6, 8, 9, 24, 32 | −6/6, 21, 40 | ||
| L. Middle/Inferior Temporal Gyrus | 21, 37 | −48, −39, −2 | ||
| L. Angular/Supramarginal Gyrus, Inferior Parietal Lobule | 39, 40 | −34, −51, 39 | ||
| L. Precuneus | 7 | −9, −62, 50 | ||
| L./R. Caudate | −11/11, 9, 9 | |||
| L./R. Thalamus | −7/7, −18, 9 | |||
| L. Occipital Gyrus | 18, 19 | −37, −71, −7 | ||
| R. Occipital Gyrus | 18, 19 | 32, −75, −9 | ||
| Stroke (Fig. 3a) | L. Middle Temporal Gyrus | 21 | −46, −35, 1 | |
| L./R. Superior Frontal/Cingulate Gyrus | 6, 24, 32 | −5/5, −12/4, 48 | ||
| L. Middle Frontal Gyrus | 9 | −28, −3, 50 | ||
| ER-VGT Articulation and Auditory Processing | Healthy (Fig. 3b) | L. Cerebellum | −16, −57, −16 | |
| R. Cerebellum | 12, −61, −20 | |||
| L./R. Cuneus, Lingual Gyrus | 30, 17–19 | −11/6, −61, 7 | ||
| L. Insula, Inferior Frontal Gyrus | 13, 45, 47 | −36, 19, 3 | ||
| R. Insula, Inferior Frontal Gyrus | 13, 45, 47 | 43, 14, 2 | ||
| L./R. Superior Frontal/Cingulate Gyrus | 6, 24, 32 | −6/6, 12, 46 | ||
| L. Superior Temporal Gyrus, Inferior Parietal Lobule | 22, 42, 40 | −43, −23, 9 | ||
| R. Superior Temporal Gyrus | 22, 42 | 46, −17, 7 | ||
| L./R. Precentral Gyrus, Insula | 6, 13 | −49/49, −3, 28 | ||
| L. Caudate | −13, −4, 15 | |||
| R. Caudate | 13, −3, 14 | |||
| L. Thalamus | −12, −13, 9 | |||
| R. Thalamus | 11, −10, 6 | |||
| Stroke (Fig. 3b) | L. Cerebellum | −10, −48, −11 | ||
| R. Cerebellum | 10, −43, −14 | |||
| L. Lingual Gyrus, Cingulate Gyrus (posterior) | 18, 23, 29–31 | −5, −57, 8 | ||
| R. Insula, Inferior Frontal Gyrus | 13, 45, 47 | 43, 12, 2 | ||
| L./R. Superior Frontal/Cingulate Gyrus | 6, 24, 32 | −3/4, 8, 41 | ||
| R. Superior Temporal Gyrus | 22, 42, 40 | 49, −19, 12 | ||
| R. Thalamus | 10, −13, 5 | |||
| L. Precentral Gyrus | 6 | −44, −8, 28 | ||
| R. Precentral Gyrus, Insula | 6, 13 | 42, −10, 42 | ||
| R. Paracentral Lobule | 5, 7 | 15, −25, 55 |
Table 4.
Lateralization index scores and lateralization for the frontal and posterior anatomically-defined regions of interest for the 32 healthy and 16 LMCA stroke subjects performing the verb generation tasks.
| BD-VGT Covert Verb Generation | ER-VGT Processing Semantic Associations | ER-VGT Articulation and Auditory Processing | |||||
|---|---|---|---|---|---|---|---|
| Healthy | Stroke | Healthy | Stroke | Healthy | Stroke | ||
| Frontal ROI | LI scores | 0.41 (0.30) | 0.24 (0.38) | 0.30 (0.24)* | 0.04 (0.19)* | 0.03 (0.19) | −0.05 (0.18) |
| Lateralization** | |||||||
| Left | 26 (81.25) | 10 (62.5) | 25 (78.13) | 3 (18.75) | 9 (28.12) | 4 (25.0) | |
| Right | 0 (0) | 3 (18.75) | 2 (6.25) | 3 (18.75) | 8 (25.0) | 7 (43.75) | |
| Symmetric | 6 (18.75) | 3 (18.75) | 5 (15.62) | 10 (62.5) | 15 (46.88) | 5 (31.25) | |
| Posterior ROI | LI scores | 0.28 (0.34)* | −0.08 (0.40)* | 0.14 (0.27) | 0.06 (0.19) | 0.01 (0.16) | −0.04 (0.16) |
| Lateralization*** | |||||||
| Left | 25 (78.13) | 6 (37.5) | 16 (50.0) | 7 (43.75) | 11 (34.38) | 3 (18.75) | |
| Right | 1 (3.12) | 6 (37.5) | 5 (15.62) | 4 (25.0) | 7 (21.87) | 6 (37.5) | |
| Symmetric | 6 (18.75) | 4 (25.0) | 11 (34.38) | 5 (31.25) | 14 (43.75) | 7 (43.75) | |
Data are reported as mean (SD) for lateralization index (LI) scores and as frequency (percentages) for lateralization. Lateralization was determined separately for the frontal and posterior regions of interest (ROIs) with LI >0.1 as left-lateralized, LI <−0.1 as right-lateralized and −0.1≤ LI ≤0.1 as symmetric.
Significant difference between healthy and stroke subject LI scores (p<0.05);
Pattern of lateralization for frontal ROI is significantly different between healthy and stroke subjects for ER-VGT processing of noun-verb semantic associations (p=0.00015);
Pattern of lateralization for posterior ROI is significantly different between healthy and stroke subjects for BD-VGT covert verb generation (p=0.0028).
Group z-score maps for the BD-VGT contrast isolating activation related to covert verb generation (Figure 2A) revealed that HC followed a typical pattern of left>right frontal-temporal and left parietal activation, as well as activation in the SFG/CG. This is similar to the pattern shown in previous studies utilizing this task [28,38,40–42]. HC activation maps for the BD-VGT contrast are displayed for both a corrected p<0.05 (Figure 2A) and an uncorrected p<0.001 (Figure 2B, upper panel); a less stringent threshold was also used due to the possibility of reduced signal to noise in data obtained from elderly or diseased individuals [55]. LMCA stroke subjects showed activation only at the lower threshold (Figure 2B, lower panel) where they exhibited BD-VGT activation in the right IFG and more superior regions of the left IFG/MFG, the SFG, and bilateral (right>left) temporal activation. The average LI scores for HC were significantly greater than for stroke subjects for the posterior anatomical ROI (p=0.0053), but not for the frontal ROI (p=0.13). These lateralization patterns were significantly different between groups for the posterior ROI (p=0.0028) but not for the frontal ROI (p=0.055). Both the average LI scores and pattern of lateralization correspond well with the group activation patterns observed for the BD-VGT.
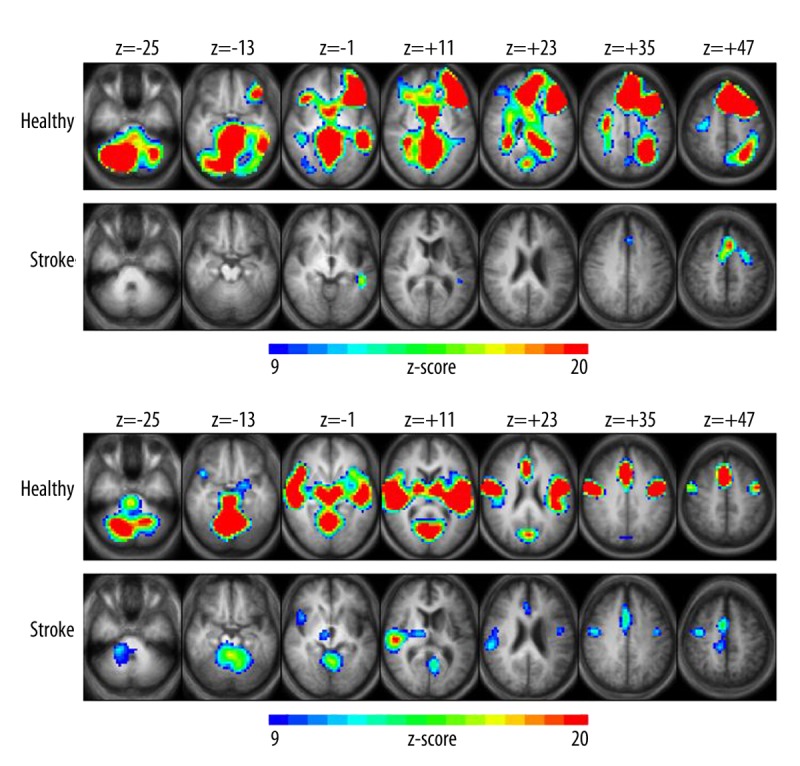
ER-VGT activation related to processing noun-verb semantic associations in HC occurred in bilateral (left>right) IFG and MFG, bilateral (left>right) MTG extending into STG, medially-located SFG/CG, posterior CG and in cerebellar, visual, and left temporo-parietal regions (Figure 3A, upper panel). In contrast, stroke subjects exhibited only three clusters of significant activation located in the left MTG, medially in the SFG/CG, and a more superior region of the left MFG (Figure 3A, lower panel). For the frontal ROI, the average LI was significantly greater in HC than stroke subjects (p=0.0002), and the pattern of lateralization was significantly different between groups (p=0.00015) with the stroke subjects exhibiting a shift towards more symmetric language-related activation. These differences were not evident for the posterior ROI in either LI (p=0.25) or lateralization pattern (p=0.78).
Figure 3.
Group z-score maps for the event-related version of the verb generation task (ER-VGT). Brain regions show increased activation related to (A) processing noun-verb semantic associations and (B) articulation and auditory processing in healthy (top panel) and LMCA stroke (bottom panel) subjects. Clusters of activation are significant at p<0.05, corrected for multiple voxel comparisons, with z-scores of activated voxels ranging from 9 (blue) to 20 (red) and a cluster threshold of at least 30 contiguous voxels. Each z-score map is presented in radiological convention, with left on the picture corresponding to the right hemisphere, and are superimposed on an average T1-weighted image generated from all subjects of each group. The 7 axial slices selected for each display panel range in Talairach coordinates from z=−25 mm (left) to z=+47 mm (right).
ER-VGT activation related to articulation and auditory processing were predominantly symmetrical for HC, particularly in insular and motor cortices and in temporal, visual, cerebellar, and subcortical regions (Figure 3B; upper panel). ER-VGT activation in stroke subjects occurred largely in the unaffected hemisphere including the right insular cortex, right>left motor cortex, right STG, and right thalamus (Figure 3B; lower panel). We also observed bilateral activation in the cerebellum and visual cortex for stroke subjects. The average LI scores were similar between HC and stroke subjects for the frontal ROI (p=0.15), and there was no group difference in the lateralization pattern for either the frontal or posterior ROI (p=0.43 and p=0.11, respectively). However, there was a trend towards a significant group difference for the posterior ROI (p=0.052), with the more negative mean LI for stroke subjects reflecting the right STG activation in their group activation map compared to the bilateral STG activation observed in healthy subjects.
Relationships between functional ROI activation and intra-scanner performance
We found significant positive associations between verb generation performance and fMRI activation during ER-VGT semantic processing for stroke subjects in the left MFG (r=0.51, p=0.042) and in the more medially located SFG/CG (r=0.57, p=0.020), but not in the left MTG (r=0.26, p=0.32). Conversely, the HCs exhibited a significant relationship between verb generation performance and fMRI activation related to semantic processing in the left MTG (r=0.38, p=0.031), but not in the left MFG (r=0.17, p=0.35) or the SFG/CG (r=0.038, p=0.84). There were no significant associations in either group between verb generation performance and ER-VGT activation related to articulation and auditory processing in the right insula/IFG or right STG (all p>0.1).
Associations between lesion size and performance
Lesion volume had significant negative associations with performance on the Controlled Oral Word Association Test (r=−0.63, p=0.0092) and the Semantic Fluency Test (r=−0.53, p=0.033), and showed a trend towards a negative association with ER-VGT verb generation performance (r=−0.45, p=0.081). However, lesion volume was not significantly associated with performance on the post-fMRI noun recognition test (r=−0.39, p=0.13), the Complex Ideation subtest of the Boston Diagnostic Aphasia Examination, the Peabody Picture Vocabulary Test (r=0.12, p=0.66) and the Boston Naming Test (r=−0.31, p=0.24).
Discussion
The main goals of this study were to identify the neural correlates of overt verb generation in LMCA stroke patients with persistent post-stroke aphasia and to assess the relationship between intra-scanner performance and task-related cortical involvement. To do so, we used the ER-VGT, an fMRI task that allowed for the recording of the subject’s intra-scanner overt responses and subsequent evaluation of the responses. Since verbal fluency is impaired in patients with post-stroke aphasia, it is difficult to determine the underlying neural correlates of verb generation without having a direct measure of performance.
Assessment of intra-scanner recordings during ER-VGT overt verb generation revealed that stroke patients, on average, correctly generated only 3.8 verbs over the 15 overt verb generation trials. Stroke subjects had performed well above chance on the BD-VGT post-fMRI test of noun recognition (85.9% accuracy), illustrating that post-scan recognition memory is not an accurate measure of actual verb generation ability. The ER-VGT was also designed to isolate different language components involved in verb generation that could not be studied with covert verb generation tasks including processing related to noun-verb semantic associations, response articulation and auditory processing. While we acknowledge that verb generation is a complex language domain comprised of numerous linguistic processes (see [42] for a detailed model of verb generation), the focus for this particular study is the differentiation of these two general components of verb generation. Together with the ability to directly assess performance during the task, we were able to examine the relationship between verb generation performance and fMRI task activation related to processing noun-verb semantic associations versus activation related to articulation and auditory processing.
Patterns of fMRI activation and language lateralization
Several studies of post-stroke aphasia have examined cortical correlates of language recovery, with the observed patterns of hemispheric involvement related, at least in part, to the task (or task design). There appears to be a division in the literature with some studies favoring right-hemispheric homologues as the main vehicle for language recovery [12,52–54], while an increasing number of studies point to the intact or recovered left hemispheric areas as the prerequisite to successful aphasia recovery [17–21,56–62]. In this study, the BD-VGT analysis revealed a shift of the language activation to the right temporal regions indicating leftward lateralization with a corresponding decrease in average LI scores in the anatomically-defined posterior ROI when compared to HC subjects (Figure 2B; Table 4). But, the stroke subjects maintained predominantly left-hemispheric IFG/MFG activation, which is reflected by the left-lateralized LI scores and a similar pattern of lateralization as HC in the frontal ROI. These findings are consistent with our previous reports of post-stroke recovery in both children [11,12] and adults [28] utilizing this fMRI task and illustrate the efficiency and consistency of this task in delineating language areas in healthy children and adults and in stroke subjects with aphasia. However, while the results of language evaluation with the BD-VGT in HC and stroke patients confirmed that our subjects have activation patterns typical for this task, based on these results we were unable to infer whether the observed patterns are related to language performance or recovery, or whether there are other factors affecting the observed pattern (e.g., the covert nature of this task).
Therefore, the ability of the ER-VGT to isolate different components involved in verb generation provided the needed clarification regarding the activation patterns observed in the BD-VGT. The ER-VGT analysis isolating articulation and auditory processing in stroke subjects showed predominantly right hemispheric activation, e.g., in the right STG, insula and thalamus, and in the right>left motor cortex (Figure 3B, lower panel) which is similar to the BD-VGT activation pattern (Figure 2B, lower panel). This finding of increased activation in the right hemisphere is not surprising as the anterior insular cortex has been shown to be involved in articulation and the motor planning of speech [42,63–65]; studies of post-stroke motor function recovery have shown similar pattern of rightward shifts [66]. Consistent with the significant group difference in the mean posterior LI on the BD-VGT (Table 4), we also observed a trend towards a significant decrease in mean LI for the posterior ROI in stroke subjects compared to HCs for the ER-VGT articulation/auditory processing contrast (p=0.052), with the more negative mean LI suggesting atypical right-lateralized activation in stroke subjects. Additionally, the proportion of right-lateralized subjects was higher for stroke than HC for both the BD-VGT contrast (37.5% vs. 3.12%, respectively) and the ER-VGT articulation/auditory processing contrast (43.75% vs. 15.63%, respectively). These results suggest that the increased right-lateralized activation of the STG in stroke for the BD-VGT reflects, at least in part, atypical processing of task stimuli.
Relationships between activation and intra-scanner performance
We hypothesized that in post-stroke aphasia correct verb generation performance is associated with preserved left-hemispheric language functions. The results of our ROI analyses support this hypothesis in that the intra-scanner performance on the ER-VGT exhibited a positive correlation with fMRI activation in the left MFG (Figure 3A) despite the fact that an increased number of stroke subjects was more symmetric in their frontal ROI activation when compared with HC (Table 4). This supports the findings from previous studies that while left hemispheric language and their right hemispheric homologues are activated with fMRI tasks in patients with post-stroke aphasia, the left hemispheric language areas are crucial for better language performance in these patients [16,17,20,21,62]. However, this positive association between performance and left MFG activation was not observed in HC despite clear similarities in activation patterns between groups (Figure 3A). Instead, HC showed positive association between performance and left MTG activation (also overlapping between groups) suggesting reorganization in the recruitment of left hemisphere language regions for improved performance in post-stroke patients. Further, we also observed a strong positive association in stroke subjects that did not exist in HC between verb generation performance and activation in the medially located SFG/CG. This indicates that better semantic processing in stroke patients may also depend on increased involvement of the attentional network as a part of the “task mode” for cognitive neuroimaging tasks [67].
Our ROI analyses showed no significant associations between ER-VGT verb generation performance and activation related to articulation and auditory processing in the right insula/IFG and right STG (Figure 3B) in either group, which is consistent with a previous study showing that better language function is not always associated with increased activation in the non-dominant right hemisphere [16]. However, the ER-VGT analysis isolating noun-verb semantic associations showed a significant decrease in average LI scores for stroke compared to HC in the frontal anatomical ROI and a significant group difference in the pattern of lateralization in which stroke patients were more than twice as likely as HC to have either symmetric or right hemispheric distribution of the task-related activation (Table 4). This leaves open the possibility that some rightward shifts in activation in aphasia may also be partly due to compensatory mechanisms related to semantic processing, but that better performance is still dependent on preservation of the left hemispheric participation in language processing as documented by the positive correlation between left MFG activation and verb generation performance in patients with aphasia. To our knowledge, this is the first study to illustrate separate aspects of reorganization in verbal fluency with stroke patients by dissociating activation related to speech articulation and auditory processing from activation related to the semantic processing of noun-verb associations.
Associations between lesion size and performance
The significant negative associations between LMCA stroke lesion volumes and verbal fluency performance (e.g., on the Semantic Fluency Test and Controlled Oral Word Association Test) suggest that lesion size may be a limiting factor in the ability for the affected dominant language regions to recover post-stroke language functions and are in agreement with at least one previous study [18]. While the extra-scanner linguistic measures showed clear stroke volume/performance correlation, such relationship between the intra-scanner performance and lesion size was not observed. This possibly reflects the relatively small sample size in our study. Overall, these findings suggest that post-stroke cortical language plasticity may be related in part to several and potentially age-dependent mechanisms [6]. In contrast to the recovery after perinatal and early postnatal LMCA stroke and unmasking of the pre-existing pathways in the non-dominant homologues [11,12], improvements in adult-acquired aphasia may be dependent on the preservation or recovery of the left cortical language-producing regions [17–20,68,69] although, as we have illustrated in this study, the left hemisphere brain regions actually engaged to achieve better task performance in stroke patients are different from those utilized in HC.
Study limitations
A limitation of the current study is the moderate sample size of stroke subjects, which may have affected our ability to detect significant group differences. For example, the non-significant trends that were observed in some of our results may likely be resolved in a larger study. However, this limitation is moderated somewhat in that we showed significant task-related activation in stroke subjects for the ER-VGT as well as significant correlations between activation related to semantic processing and verb generation performance. It is believed that the small to moderate sample sizes used in neuroimaging studies contribute to false positive findings [70], so these results should be interpreted with caution until they are replicated in a larger sample and before firm conclusions can be made.
Conclusions
We demonstrated the ability of the ER-VGT to isolate different components of verb generation and its ability to track intra-scanner performance in stroke subjects with aphasia. The ability to track intra-scanner performance allowed us to show that the increases in right hemisphere activation during language-related processing are not necessarily related to better language function. Instead, better verb generation performance is dependent upon the viability of the left hemispheric peristroke language areas when processing noun-verb semantic associations. We also demonstrated that preservation of the language-dominant left hemisphic brain regions, specifically the left MFG, is important for communicative abilities in post-stroke aphasia. However, the left hemispheric brain regions associated with better verb generation performance in stroke patients were not the same as in HC, suggesting an inter-hemispheric reorganization of language function. Since lesion size was negatively correlated with verbal fluency, a right-hemispheric shift is likely related to post-stroke plasticity to compensate for the damaged brain regions expressed mainly in the changes of localization for the motor speech functions. Therefore, we posit that verbal fluency in post-stroke aphasia depends upon the structural and functional preservation of the dominant left-hemispheric language regions more so than on the increased utilization of the unaffected right hemisphere.
Acknowledgements
The authors thank Christi Banks, CCRC, Jennifer Vannest, PhD, and Miriam Siegel for their assistance.
Footnotes
This study was presented in part at the 2011 American Academy of Neurology meeting in Honolulu, Hawaii, U.S.A.
Source of support: Support for this study was provided by the National Institutes of Neurological Disorders and Stroke (NINDS; NIH R01 NS04828) to JPS
References
- 1.Wade DT, Hewer RL, David RM, Enderby PM. Aphasia after stroke: natural history and associated deficits. J Neurol Neurosurg Psychiatry. 1986;49(1):11–16. doi: 10.1136/jnnp.49.1.11. [DOI] [PMC free article] [PubMed] [Google Scholar]
- 2.Tatemichi TK, Desmond DW, Paik M, et al. Clinical determinants of dementia related to stroke. Ann Neurol. 1993;33(6):568–75. doi: 10.1002/ana.410330603. [DOI] [PubMed] [Google Scholar]
- 3.Laska AC, Hellblom A, Murray V, et al. Aphasia in acute stroke and relation to outcome. J Intern Med. 2001;249(5):413–22. doi: 10.1046/j.1365-2796.2001.00812.x. [DOI] [PubMed] [Google Scholar]
- 4.Lazar RM, Minzer B, Antoniello D, et al. Improvement in aphasia scores after stroke is well predicted by initial severity. Stroke. 2010;41(7):1485–88. doi: 10.1161/STROKEAHA.109.577338. [DOI] [PMC free article] [PubMed] [Google Scholar]
- 5.Lazar RM, Speizer AE, Festa JR, et al. Variability in language recovery after first-time stroke. J Neurol Neurosurg Psychiatry. 2008;79(5):530–34. doi: 10.1136/jnnp.2007.122457. [DOI] [PubMed] [Google Scholar]
- 6.Mariotti P, Iuvone L, Torrioli MG, Silveri MC. Linguistic and non-linguistic abilities in a patient with early left hemispherectomy. Neuropsychologia. 1998;36(12):1303–12. doi: 10.1016/s0028-3932(98)00031-1. [DOI] [PubMed] [Google Scholar]
- 7.Liegeois F, Connelly A, Baldeweg T, et al. Speaking with a single cerebral hemisphere: fMRI language organization after hemispherectomy in childhood. Brain Lang. 2008;106(3):195–203. doi: 10.1016/j.bandl.2008.01.010. [DOI] [PubMed] [Google Scholar]
- 8.Muller RA, Rothermel RD, Behen ME, et al. Brain organization of language after early unilateral lesion: a PET study. Brain Lang. 1998;62(3):422–51. doi: 10.1006/brln.1997.1931. [DOI] [PubMed] [Google Scholar]
- 9.Muller RA, Behen ME, Rothermel RD, et al. Brain organization for language in children, adolescents, and adults with left hemisphere lesion: a PET study. Prog Neuropsychopharmacol Biol Psychiatry. 1999;23(4):657–68. doi: 10.1016/s0278-5846(99)00024-x. [DOI] [PubMed] [Google Scholar]
- 10.Staudt M, Lidzba K, Grodd W, et al. Right-hemispheric organization of language following early left-sided brain lesions: functional MRI topography. Neuroimage. 2002;16(4):954–67. doi: 10.1006/nimg.2002.1108. [DOI] [PubMed] [Google Scholar]
- 11.Jacola LM, Schapiro MB, Schmithorst VJ, et al. Functional magnetic resonance imaging reveals atypical language organization in children following perinatal left middle cerebral artery stroke. Neuropediatrics. 2006;37(1):46–52. doi: 10.1055/s-2006-923934. [DOI] [PMC free article] [PubMed] [Google Scholar]
- 12.Tillema JM, Byars AW, Jacola LM, et al. Cortical reorganization of language functioning following perinatal left MCA stroke. Brain Lang. 2008;105(2):99–111. doi: 10.1016/j.bandl.2007.07.127. [DOI] [PMC free article] [PubMed] [Google Scholar]
- 13.Lidzba K, Staudt M. Development and (re)organization of language after early brain lesions: capacities and limitation of early brain plasticity. Brain Lang. 2008;106(3):165–66. doi: 10.1016/j.bandl.2008.05.003. [DOI] [PubMed] [Google Scholar]
- 14.Anderson V, Spencer-Smith M, Wood A. Do children really recover better? Neurobehavioural plasticity after early brain insult. Brain. 2011;134(Pt 8):2197–221. doi: 10.1093/brain/awr103. [DOI] [PubMed] [Google Scholar]
- 15.Liegeois F, Connelly A, Cross JH, et al. Language reorganization in children with early-onset lesions of the left hemisphere: an fMRI study. Brain. 2004;127(Pt 6):1229–36. doi: 10.1093/brain/awh159. [DOI] [PubMed] [Google Scholar]
- 16.Raja Beharelle A, Dick AS, Josse G, et al. Left hemisphere regions are critical for language in the face of early left focal brain injury. Brain. 2010;133(Pt 6):1707–16. doi: 10.1093/brain/awq104. [DOI] [PMC free article] [PubMed] [Google Scholar]
- 17.Saur D, Lange R, Baumgaertner A, et al. Dynamics of language reorganization after stroke. Brain. 2006;129(Pt 6):1371–84. doi: 10.1093/brain/awl090. [DOI] [PubMed] [Google Scholar]
- 18.van Oers CA, Vink M, van Zandvoort MJ, et al. Contribution of the left and right inferior frontal gyrus in recovery from aphasia. A functional MRI study in stroke patients with preserved hemodynamic responsiveness. Neuroimage. 2010;49(1):885–93. doi: 10.1016/j.neuroimage.2009.08.057. [DOI] [PubMed] [Google Scholar]
- 19.Tyler LK, Wright P, Randall B, et al. Reorganization of syntactic processing following left-hemisphere brain damage: does right-hemisphere activity preserve function? Brain. 2010;133(11):3396–408. doi: 10.1093/brain/awq262. [DOI] [PMC free article] [PubMed] [Google Scholar]
- 20.Fridriksson J, Bonilha L, Baker JM, et al. Activity in preserved left hemisphere regions predicts anomia severity in aphasia. Cereb Cortex. 2010;20(5):1013–19. doi: 10.1093/cercor/bhp160. [DOI] [PMC free article] [PubMed] [Google Scholar]
- 21.Meinzer M, Flaisch T, Breitenstein C, et al. Functional re-recruitment of dysfunctional brain areas predicts language recovery in chronic aphasia. Neuroimage. 2008;39(4):2038–46. doi: 10.1016/j.neuroimage.2007.10.008. [DOI] [PubMed] [Google Scholar]
- 22.Szaflarski JP, Vannest J, Wu SW, et al. Excitatory repetitive transcranial magnetic stimulation induces improvements in chronic post-stroke aphasia. Med Sci Monit. 2011;17(3):CR132–39. doi: 10.12659/MSM.881446. [DOI] [PMC free article] [PubMed] [Google Scholar]
- 23.Baker JM, Rorden C, Fridriksson J. Using transcranial direct-current stimulation to treat stroke patients with aphasia. Stroke. 2010;41(6):1229–36. doi: 10.1161/STROKEAHA.109.576785. [DOI] [PMC free article] [PubMed] [Google Scholar]
- 24.Lindenberg R, Renga V, Zhu LL, et al. Bihemispheric brain stimulation facilitates motor recovery in chronic stroke patients. Neurology. 2010;75(24):2176–84. doi: 10.1212/WNL.0b013e318202013a. [DOI] [PMC free article] [PubMed] [Google Scholar]
- 25.Schmithorst VJ, Holland SK. Event-related fMRI technique for auditory processing with hemodynamics unrelated to acoustic gradient noise. Magn Reson Med. 2004;51(2):399–402. doi: 10.1002/mrm.10706. [DOI] [PubMed] [Google Scholar]
- 26.Vannest J, Rasmussen J, Eaton KP, et al. FMRI activation in language areas correlates with verb generation performance in children. Neuropediatrics. 2010;41(5):235–39. doi: 10.1055/s-0030-1267982. [DOI] [PubMed] [Google Scholar]
- 27.Allendorfer JB, Lindsell CJ, Siegel M, et al. Females and males are highly similar in language performance and cortical activation patterns during verb generation. Cortex. 2011 doi: 10.1016/j.cortex.2011.05.014. In Press. [DOI] [PMC free article] [PubMed] [Google Scholar]
- 28.Eaton KP, Szaflarski JP, Altaye M, et al. Reliability of fMRI for studies of language in post-stroke aphasia subjects. Neuroimage. 2008;41(2):311–22. doi: 10.1016/j.neuroimage.2008.02.033. [DOI] [PMC free article] [PubMed] [Google Scholar]
- 29.De Renzi E, Vignolo LA. The token test: A sensitive test to detect receptive disturbances in aphasics. Brain. 1962:85665–78. doi: 10.1093/brain/85.4.665. [DOI] [PubMed] [Google Scholar]
- 30.Oldfield RC. The assessment and analysis of handedness: the Edinburgh inventory. Neuropsychologia. 1971;9(1):97–113. doi: 10.1016/0028-3932(71)90067-4. [DOI] [PubMed] [Google Scholar]
- 31.Dunn LM, Dunn DM. Peabody Picture Vocabulary Test. Fourth ed. Minneapolis, MN: NCS Pearson Inc; 2007. [Google Scholar]
- 32.Kaplan E, Goodglass H, Weintraub S. Boston Naming Test. 2nd ed. Baltimore, MD: Lippincott Williams & Wilkins; 2001. [Google Scholar]
- 33.Lezak M. Neuropsychological assessment. New York, NY: Oxford University Press; 1995. [Google Scholar]
- 34.Kozora E, Cullum CM. Generative naming in normal aging: Total output and qualitative changes using phonemic and semantic constraints. Clin Neuropsychol. 1995;9(4):313–20. [Google Scholar]
- 35.Goodglass H, Kaplan E. The assessment of aphasia and related disorders. Philadelphia, PA: Lea & Febiger; 1972. [Google Scholar]
- 36.Petersen SE, Fox PT, Posner MI, et al. Positron emission tomographic studies of the cortical anatomy of single-word processing. Nature. 1988;331(6157):585–89. doi: 10.1038/331585a0. [DOI] [PubMed] [Google Scholar]
- 37.Wise R, Chollet F, Hadar U, et al. Distribution of cortical neural networks involved in word comprehension and word retrieval. Brain. 1991;114(Pt 4):1803–17. doi: 10.1093/brain/114.4.1803. [DOI] [PubMed] [Google Scholar]
- 38.Holland SK, Plante E, Weber Byars A, et al. Normal fMRI brain activation patterns in children performing a verb generation task. Neuroimage. 2001;14(4):837–43. doi: 10.1006/nimg.2001.0875. [DOI] [PubMed] [Google Scholar]
- 39.Szaflarski JP, Schmithorst VJ, Altaye M, et al. A longitudinal functional magnetic resonance imaging study of language development in children 5 to 11 years old. Ann Neurol. 2006;59(5):796–807. doi: 10.1002/ana.20817. [DOI] [PMC free article] [PubMed] [Google Scholar]
- 40.Szaflarski JP, Holland SK, Schmithorst VJ, Byars AW. fMRI study of language lateralization in children and adults. Hum Brain Mapp. 2006;27(3):202–12. doi: 10.1002/hbm.20177. [DOI] [PMC free article] [PubMed] [Google Scholar]
- 41.Szaflarski JP, Holland SK, Jacola LM, et al. Comprehensive presurgical functional MRI language evaluation in adult patients with epilepsy. Epilepsy Behav. 2008;12(1):74–83. doi: 10.1016/j.yebeh.2007.07.015. [DOI] [PMC free article] [PubMed] [Google Scholar]
- 42.Karunanayaka P, Schmithorst VJ, Vannest J, et al. A group independent component analysis of covert verb generation in children: a functional magnetic resonance imaging study. Neuroimage. 2010;51(1):472–87. doi: 10.1016/j.neuroimage.2009.12.108. [DOI] [PMC free article] [PubMed] [Google Scholar]
- 43.Schmithorst VJ, Dardzinski BJ, Holland SK. Simultaneous correction of ghost and geometric distortion artifacts in EPI using a multiecho reference scan. IEEE Trans Med Imaging. 2001;20(6):535–39. doi: 10.1109/42.929619. [DOI] [PMC free article] [PubMed] [Google Scholar]
- 44.Chiu CY, Schmithorst VJ, Brown RD, et al. Making memories: a cross-sectional investigation of episodic memory encoding in childhood using FMRI. Dev Neuropsychol. 2006;29(2):321–40. doi: 10.1207/s15326942dn2902_3. [DOI] [PubMed] [Google Scholar]
- 45.Thevenaz P, Ruttimann UE, Unser M. A pyramid approach to subpixel registration based on intensity. IEEE Trans Image Process. 1998;7(1):27–41. doi: 10.1109/83.650848. [DOI] [PubMed] [Google Scholar]
- 46.Talairach J, Tournoux P. Co-planar Stereotaxic Atlas of the Human Brain: 3-Dimensional Proportional System: An Approach to Cerebral Imaging. Stuttgart, Germany: Thieme Medical Publishers; 1988. [Google Scholar]
- 47.Worsley KJ, Friston KJ. Analysis of fMRI time-series revisited – again. Neuroimage. 1995;2(3):173–81. doi: 10.1006/nimg.1995.1023. [DOI] [PubMed] [Google Scholar]
- 48.Forman SD, Cohen JD, Fitzgerald M, et al. Improved assessment of significant activation in functional magnetic resonance imaging (fMRI): use of a cluster-size threshold. Magn Reson Med. 1995;33(5):636–47. doi: 10.1002/mrm.1910330508. [DOI] [PubMed] [Google Scholar]
- 49.Tzourio-Mazoyer N, Landeau B, Papathanassiou D, et al. Automated anatomical labeling of activations in SPM using a macroscopic anatomical parcellation of the MNI MRI single-subject brain. Neuroimage. 2002;15(1):273–89. doi: 10.1006/nimg.2001.0978. [DOI] [PubMed] [Google Scholar]
- 50.Cox RW. AFNI: software for analysis and visualization of functional magnetic resonance neuroimages. Comput Biomed Res. 1996;29(3):162–73. doi: 10.1006/cbmr.1996.0014. [DOI] [PubMed] [Google Scholar]
- 51.Wilke M, Schmithorst VJ. A combined bootstrap/histogram analysis approach for computing a lateralization index from neuroimaging data. Neuroimage. 2006;33(2):522–30. doi: 10.1016/j.neuroimage.2006.07.010. [DOI] [PubMed] [Google Scholar]
- 52.Musso M, Weiller C, Kiebel S, et al. Training-induced brain plasticity in aphasia. Brain. 1999;122( Pt 9):1781–90. doi: 10.1093/brain/122.9.1781. [DOI] [PubMed] [Google Scholar]
- 53.Crinion J, Price CJ. Right anterior superior temporal activation predicts auditory sentence comprehension following aphasic stroke. Brain. 2005;128(Pt 12):2858–71. doi: 10.1093/brain/awh659. [DOI] [PubMed] [Google Scholar]
- 54.Crosson B, Moore AB, McGregor KM, et al. Regional changes in word-production laterality after a naming treatment designed to produce a rightward shift in frontal activity. Brain Lang. 2009;111(2):73–85. doi: 10.1016/j.bandl.2009.08.001. [DOI] [PMC free article] [PubMed] [Google Scholar]
- 55.D’Esposito M, Deouell LY, Gazzaley A. Alterations in the BOLD fMRI signal with ageing and disease: a challenge for neuroimaging. Nat Rev Neurosci. 2003;4(11):863–72. doi: 10.1038/nrn1246. [DOI] [PubMed] [Google Scholar]
- 56.Cao Y, Vikingstad EM, George KP, et al. Cortical language activation in stroke patients recovering from aphasia with functional MRI. Stroke. 1999;30(11):2331–40. doi: 10.1161/01.str.30.11.2331. [DOI] [PubMed] [Google Scholar]
- 57.Heiss WD, Kessler J, Thiel A, et al. Differential capacity of left and right hemispheric areas for compensation of poststroke aphasia. Ann Neurol. 1999;45(4):430–38. doi: 10.1002/1531-8249(199904)45:4<430::aid-ana3>3.0.co;2-p. [DOI] [PubMed] [Google Scholar]
- 58.Price CJ, Crinion J. The latest on functional imaging studies of aphasic stroke. Curr Opin Neurol. 2005;18(4):429–34. doi: 10.1097/01.wco.0000168081.76859.c1. [DOI] [PubMed] [Google Scholar]
- 59.Heiss WD, Thiel A. A proposed regional hierarchy in recovery of post-stroke aphasia. Brain Lang. 2006;98(1):118–23. doi: 10.1016/j.bandl.2006.02.002. [DOI] [PubMed] [Google Scholar]
- 60.Crosson B, McGregor K, Gopinath KS, et al. Functional MRI of language in aphasia: a review of the literature and the methodological challenges. Neuropsychol Rev. 2007;17(2):157–77. doi: 10.1007/s11065-007-9024-z. [DOI] [PMC free article] [PubMed] [Google Scholar]
- 61.Saur D, Ronneberger O, Kummerer D, et al. Early functional magnetic resonance imaging activations predict language outcome after stroke. Brain. 2010;133(Pt 4):1252–64. doi: 10.1093/brain/awq021. [DOI] [PubMed] [Google Scholar]
- 62.Fridriksson J. Preservation and modulation of specific left hemisphere regions is vital for treated recovery from anomia in stroke. J Neurosci. 2010;30(35):11558–64. doi: 10.1523/JNEUROSCI.2227-10.2010. [DOI] [PMC free article] [PubMed] [Google Scholar]
- 63.Dronkers NF. A new brain region for coordinating speech articulation. Nature. 1996;384(6605):159–61. doi: 10.1038/384159a0. [DOI] [PubMed] [Google Scholar]
- 64.Price CJ. The anatomy of language: a review of 100 fMRI studies published in 2009. Ann NY Acad Sci. 2010;1191(1):62–88. doi: 10.1111/j.1749-6632.2010.05444.x. [DOI] [PubMed] [Google Scholar]
- 65.Hiraga A, Tanaka S, Kamitsukasa I. Pure dysarthria due to an insular infarction. J Clin Neurosci. 2010;17(6):812–13. doi: 10.1016/j.jocn.2009.10.026. [DOI] [PubMed] [Google Scholar]
- 66.Page SJ, Szaflarski JP, Eliassen JC, et al. Cortical plasticity following motor skill learning during mental practice in stroke. Neurorehabil Neural Repair. 2009;23(4):382–88. doi: 10.1177/1545968308326427. [DOI] [PMC free article] [PubMed] [Google Scholar]
- 67.Dosenbach NU, Visscher KM, Palmer ED, et al. A core system for the implementation of task sets. Neuron. 2006;50(5):799–812. doi: 10.1016/j.neuron.2006.04.031. [DOI] [PMC free article] [PubMed] [Google Scholar]
- 68.Hillis AE, Gold L, Kannan V, et al. Site of the ischemic penumbra as a predictor of potential for recovery of functions. Neurology. 2008;71(3):184–89. doi: 10.1212/01.wnl.0000317091.17339.98. [DOI] [PubMed] [Google Scholar]
- 69.Szaflarski JP, Eaton K, Ball AL, et al. Poststroke Aphasia Recovery Assessed With Functional Magnetic Resonance Imaging and a Picture Identification Task. J Stroke Cerebrovasc Dis. 2011;20(4):336–45. doi: 10.1016/j.jstrokecerebrovasdis.2010.02.003. [DOI] [PMC free article] [PubMed] [Google Scholar]
- 70.Harrington GS, Farias ST. Sex differences in language processing: functional MRI methodological considerations. J Magn Reson Imaging. 2008;27(6):1221–28. doi: 10.1002/jmri.21374. [DOI] [PubMed] [Google Scholar]