Figure 1.
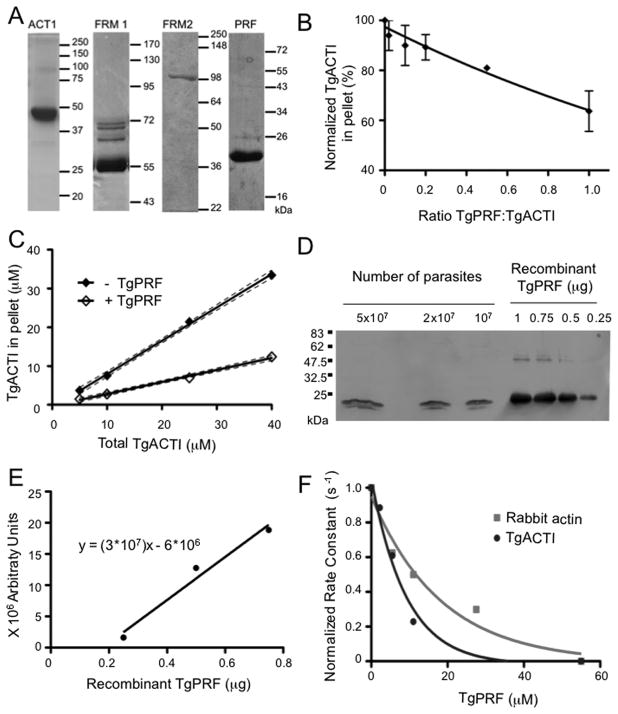
TgPRF acts to sequester TgACTI and prevent polymerization. (A) Purified recombinant T. gondii proteins were assessed by SDS-PAGE, Coomassie blue stained gels. The fainter bands in FRM1 lane reflect contaminants from E. coli that bind to nickel resin. Samples include actin (ACTI), TgFRM1-FH1-FH2 (FRM1), TgFRM2-FH1-FH2 (FRM2) and profilin (PRF). The expected mass of FRM2 is 82 kDa, although it migrates at 100 kDa. Mass ladders in kilodaltons (kDa). (B) Sedimentation analysis of TgACTI polymerized with varying concentrations of TgPRF. TgACTI (25 μM) was incubated with TgPRF (0.1 – 1 molar ratio) for 1.5 h. Reactions were centrifuged at 350,000g for 1 h at room temperature, separated by SDS-PAGE, stained with SYPRO Ruby and visualized using a phosphorimager. Values were normalized to the amount of pelleted TgACTI in the absence of TgPRF. Means ± S.D. from three or more separate experiments are shown. Curve was fitted using a second order polynomial. (C) Steady state sedimentation analysis of varying concentrations of TgACTI ± equimolar TgPRF. Reactions were incubated for ~20 h and then centrifuged at 350,000g for 1 h at room temperature, separated by SDS-PAGE stained with SYPRO Ruby and visualized using a phosphorimager. 95% confidence interval of the linear best-fit line from two independent experiments is shown. (D) Western blot to compare amount of TgPRF in parasite lysates to known concentrations of recombinant TgPRF. Parasite lysates and recombinant protein were resolved on a 12% SDS-PAGE gel, transferred to nitrocellulose and probed with rabbit αTgPRF. (E) Bands from Western in (D) were quantified with a phosphorimager and used to calculate a standard curve from known concentrations of TgPRF (using points for 0.25, 0.5 and 0.75 μM, 1μM was excluded due to saturation of signal) based on a linear regression fit (r2=0.9718). (F) The effect of TgPRF on nucleotide exchange by ATP-rabbit actin (gray squares) or ATP-TgACTI (black circles). Nucleotide exchange was monitored by the loss of fluorescence from ε-ATP labeled actin (1 μM) over time following addition of 1.25 mM unlabeled ATP in the absence or presence of different concentrations of TgPRF (2 μM – 55 μM). The initial rates of fluorescence loss were used to calculate rate constants and are normalized and plotted verses TgPRF concentration to obtain a curve of one phase decay. Representative experiments are shown. Recombinant His-tagged TgPRF was used for experiments shown.

