Abstract
The objective of this work was to evaluate the solution stability of the EC1 domain of E-cadherin under various conditions. The EC1 domain was incubated at various temperatures (4, 37, and 70 °C) and pH values (3.0, 7.0, and 9.0). At pH 9.0 and 37 or 70 °C, a significant loss of EC1 was observed due to precipitation and a hydrolysis reaction. The degradation was suppressed upon addition of DTT, suggesting that the formation of EC1 dimer facilitated the EC1 degradation. At 4 °C and various pH values, the EC1 secondary and tertiary showed changes upon incubation up to 28 days, and DTT prevented any structural changes upon 28 days of incubation. Molecular dynamics simulations indicated that the dimer of EC1 has higher mobility than does the monomer; this higher mobility of the EC1 dimer may contribute to instability of the EC1 domain.
INTRODUCTION
E-cadherin is a member of the cadherin family found in the adherens junctions of the epithelial and endothelial cells of the intestinal mucosa and the blood-brain barrier, respectively. The extracellular-1 (EC1) domain of cadherins is one of the most important domains for the homophilic selectivity of cadherins.1–5 E-cadherins form homophilic interactions on the lateral surface of the same cell as well as the opposing cells. The X-ray structure of the entire extracellular domain of C-cadherin3 and electron tomography of demosomes in the adherens junctions6 indicate that the EC1 domain forms cis-dimer with the EC2 domain of another molecule from the same cell surface. The EC1 domain of C-cadherin from one cell surface also interacts with the EC1 domain of another molecule from the opposing cell to produce a trans-dimer.3,6 It was also proposed that the formation of the cis-dimer of E-cadherin is necessary for the formation of the trans-dimer in cell-cell adhesion process.5,7 E-cadherin-mediated homophilic cell-cell adhesion can be inhibited by EC1-derived peptides,8,9 and these peptides temporarily open the intercellular junctions of MDCK monolayers to enhance the transport of 14C-mannitol.10,11 The EC1 domain has also been shown to play an important role in the heterophilic binding of E-cadherin to αEβ7 integrin expressed predominantly on the surface of intraepithelial T lymphocytes at the intestine.12 The site of heterophilic interaction of EC1 with αEβ7 is different than that for the homophilic interaction with E-cadherin.12 Although the EC1 domain has been shown to modulate E-cadherin-mediated Caco-2 cell-cell adhesion,9 the expressed EC1 protein cannot be stored for a long period of time in solution because it is unstable. Therefore, it was necessary to study the stability properties of the EC1 domain before we could find a method(s) to stabilize this molecule for future biological studies.
To study the stability of EC1 in solution, we expressed the EC1 domain (105 residues; MW = 11,628 Da) without the calcium-binding sequence found at the interface between EC1 and EC2 domains. Because EC1 was expressed with His-tag, the expressed EC1 domain has four additional amino acids (GSHM) at the N-terminus. Addition of these four amino acids does not change the secondary structure of EC1 as determined by CD. In this case, the Cys9 residue on the native EC1 is at Cys13 on the EC1 domain studied here (Figure 1).13 The monomeric form of the EC1 domain can readily produce a covalent dimer via an intermolecular disulfide bond of Cys13 residues followed by the generation of physical oligomers and precipitates.14 This creates problems in studying the biological activity of the EC1. Our hypothesis is that blocking the formation of the covalent dimer may inhibit the oligomerization and precipitation of the EC1 domain. Therefore, the goal of this study was to investigate the effect of covalent dimerization on the oligomerization and precipitation as well as the chemical stability of EC1. Stabilization of the monomer will help our effort in (a) elucidating the mechanism of interaction between the EC1 domain and other expressed domains (EC2, EC3, EC4, and EC5) of E-cadherin, (b) evaluating the activity of the EC1 domain in blocking homotypic and heterotypic cell-cell adhesion, and (c) determining the binding site(s) of E-cadherin peptides on the EC1 domain by NMR spectroscopy. Furthermore, EC1 is a good model for studying methods of inhibiting the oligomerization and precipitation processes of proteins in formulation.
Figure 1.
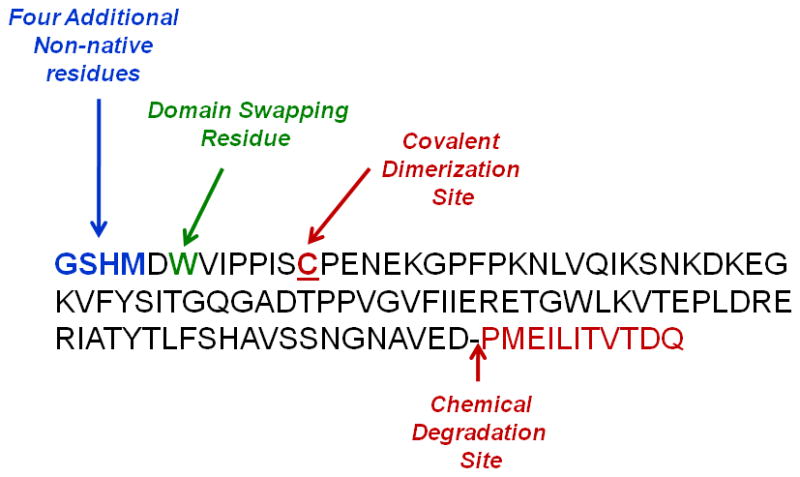
Primary sequence of the EC1 protein obtained at the end of the purification process. The first four residues, GSHM, are the non-native residues as a result of the type of vector used for transfection into E. coli cells. The single Cys13 residue is equivalent to the Cys9 residue in the native EC1. The potential hydrolysis site is also indicated. The Trp6 residue is the potential domain-swapping residue.
In this work, we studied the accelerated physical and chemical stability of the EC1 domain at different temperatures and pH values in the absence and presence of dithiothreitol (DTT). The chemical degradation process was evaluated by HPLC and mass spectrometry (MS). The effect of pH and incubation time on the secondary structure was evaluated by CD spectroscopy. The intrinsic fluorescence emission of EC1 was monitored to follow the changes in the tertiary structure of EC1 upon incubation under different conditions. Molecular dynamics simulations were used to investigate the dynamic properties of the EC1 monomer and dimer. The results indicated that the formation of the EC1 dimer is critical to the physical and chemical stability of EC1.
EXPERIMENTAL METHODS
Expression of EC1
Competent E. coli cells were transformed with pET-15b vector ligated to cDNA of EC1 and grown in LB medium at 37 °C and 250 rpm shaking. When the UV absorbance of the E. coli reached 0.5 units at 600 nm, the cells were induced with isopropyl-β-D-thiogalactopyranoside (IPTG). The growth of the cells was monitored until their UV absorbance at 600 nm reached a plateau (usually about 1.5 units after 3 h). The E. coli cells were then harvested by centrifugation at 8,000 rpm for 6 min. The pellets obtained were resuspended in a buffer containing 100 mM Tris, 100 mM NaCl, and 2.0 mM β-mercaptoethanol (BME) at pH 8.0. The suspension of cells was passed through a French cell press at a pressure of greater than 1000 psi to lyse the cells and release the expressed EC1 into the buffer.15 The lysed cell suspension was then centrifuged for 45 min at 20,000 rpm and 4 °C to separate the insoluble cell debris from dissolved EC1. The supernatant obtained in this manner was further cleared of any particulate matter by passing it through a 0.45 micron filter. The EC1 obtained in this manner has a His-tag on its N-terminus.
Purification of EC1 Protein
The lysed cell suspension containing EC1 with His-tag (EC1-Histag) was loaded onto a Hi trap nickel affinity column (GE Healthcare).15 This was followed by elution with washing buffer containing 100 mM Tris and 100 mM NaCl at pH 8.0 with increasing concentration of imidazole (from 10 mM to 50 mM) to wash off other non-specifically bound proteins. The EC1-Histag protein bound to the nickel affinity column was then eluted by increasing the concentration of imidazole to 150 mM. The fraction of eluted EC1-Histag was dialyzed against buffer containing 20 mM Tris, 100 mM NaCl, and 10 mM EDTA at pH 8.0 to remove any residual nickel and imidazole. Next, the EC1-Histag solution was dialyzed against buffer containing 20 mM Tris and 100 mM NaCl at pH 8.0 to remove the EDTA. The pure EC1-Histag was concentrated to 1.0 mL followed by dilution with 8.0 mL of deionized water. To 8.0 mL of diluted protein, thrombin (0.5 units/mg of EC1-Histag) was added in cleavage buffer (200 mM Tris, 1.5 M NaCl, 25 mM CaCl2, 2 mM BME) and the mixture was incubated with gentle shaking for 2 h at room temperature to cleave the Histag from the EC1 domain without cleaving any other sequence within EC1. At the end of 2 h incubation, the mixture was run through a benzamidine column to trap the thrombin; a mixture of EC1 and cleaved Histag was eluted from the column using buffer (20 mM Tris, 100 mM NaCl, 2 mM BME) at pH 8.0. The eluted mixture was then passed through the nickel affinity column to separate the pure EC1 from the Histag. The pure EC1 was obtained and dialyzed in a buffer containing 20 mM Tris, 100 mM NaCl, 2 mM BME, and 10 mM EDTA at pH 8.0 to remove any residual nickel. Finally, the EC1 solution was dialyzed against a buffer containing 20 mM Tris, 100 mM NaCl, and 2 mM BME at pH 8.0 to remove any remaining EDTA. SDS-PAGE of the protein was run to confirm its purity, and the identity of EC1 was evaluated by ESI positive mode time-of-flight (TOF) MS with a molecular weight of 11,628 Da.
Chemical Stability Studies
Chemical stability studies of 86 μM EC1 (1.0 mg/mL) were carried out at pH 3.0, 7.0, and 9.0 and temperatures of 4, 37, and 70 °C. The buffers used were 100 mM phosphate for pH 3.0, 50 mM phosphate for pH 7.0, and 100 mM borate with 0.08 M NaCl for pH 9.0. EC1 was dialyzed into each buffer using Amicon centrifugal filter devices containing a membrane with a molecular weight cut-off of 10,000 Da. Samples containing the EC1 protein at different pH values were incubated at 4, 37, or 70 °C in the absence and presence of 0.1 M DTT. The molar ratio of DTT: EC1 in these studies is approximately 10,000:1, which is sufficient to maintain EC1 in its reduced monomeric form. Three samples were drawn out at each time interval and immediately frozen at −70 °C prior to analysis. Each of the frozen samples was thawed and centrifuged at 12,000 × g for 10 min at 4 °C to remove any particles before HPLC analysis as described below.
The degradation profiles of the EC1 protein were evaluated using SDS PAGE gel and an HPLC system (Dynamax SD-200). The sample (25 μL) was injected onto an analytical HPLC column (C18, Varian Microsorb, pore-size 300Å, dimensions 250 × 4.6 mm) using gradient elution with a rate of 1.0 mL/min. Solvent A (94.9% double distilled water, 5% acetonitrile (ACN), and 0.1% TFA) and solvent B (100% ACN) were used in various proportions for the separation and resolution of eluting peaks. The sequence of the gradient elution was as follows: 0% B to 45% B for 2.0 min, 45% B to 51% B for 10.0 min, 51% B to 51% B for 5.0 min, 51% B to 100% B for 2.0 min, and 100% B to 100% B over 2.0 min, and 100% B to 0% B over 1.0 min. The eluted protein and its degradation products were detected using a Varian Prostar UV detector at a wavelength of 220 nm. The degradation products were identified by LCMS utilizing a C4 micro-column with ESI positive mode and TOF detection methods.
Physical Stability Studies
Long-term physical stability studies of EC1 were performed at a concentration of 86 μM (1.0 mg/mL) and pH 3.0, 7.0, and 9.0 under the same conditions as used in the chemical stability studies (see above). The sealed EC1 samples (300 μL in each vial) were stored at 4 °C for 14 or 28 days in the absence and presence of 2.0 mM DTT. The CD spectra of the samples prior to incubation (day 0) and after incubation were collected in the far-UV spectrum (200–250 nm) at 1 nm bandwidth and 0.1 cm pathlength using a Jasco spectropolarimeter (J-720) equipped with a Peltier temperature controller. The thermal unfolding profile of the protein samples was monitored in two ways: 1) by collecting CD spectra every 5 °C while increasing the temperature from 10 to 65 °C at the rate of 15 °C per hour after equilibrating the sample for 300 s at each temperature, and 2) by monitoring the CD signal at 218 nm (for change in β-sheet structure) after every 0.5 °C rise in temperature.16 Each sample was run in triplicate, and a blank sample spectrum containing the buffer alone was subtracted from each sample spectrum. The ellipticity value at 218 nm was plotted for each temperature point to examine the thermal unfolding profile of the sample. This plot was fitted to a sigmoidal function using Origin 7.0 software, and the midpoint of each plot was taken as the thermal unfolding (denaturation) temperature.
For fluorescence spectroscopy studies, 1.0 mL 86 μM EC1 (1 mg/mL) was incubated at pH values of 3.0, 7.0 and 9.0 each for a period of 28 days at 4 °C. At days 0, 14, and 28, EC1 (0.3 mL) was withdrawn from the incubated samples and diluted to 0.1 mg/mL with buffer of the corresponding pH. This solution (0.9 mL) was loaded into a quartz fluorescence cuvette of 1 cm pathlength and intrinsic fluorescence spectra were collected on a PTI QuantaMaster spectrofluorometer at 2.5 °C intervals from 10 to 87.5 °C. The analyte was equilibrated for 5 min at every temperature prior to the spectrum collection. An emission spectrum was obtained from 305 nm to 405 nm after excitation of the analyte at 295 nm (>95% Trp emission).17 The excitation and emission slits were adjusted so that the emission at its maximum was between 500,000 and 1,000,000 counts/s. Each experiment was performed in triplicate, and the appropriate buffer was also run as a control.
The entire analysis described above was repeated in the presence of 2.0 mM DTT. To analyze the data, the signals from the blanks were subtracted from emission spectra of the samples. Each fluorescence emission spectrum obtained was fitted to an extreme asymmetric peak function using the non-linear curve-fitting wizard of Origin 7.0 software to obtain the wavelength of maximum emission. The wavelength of maximum emission at each temperature was plotted against temperature to calculate the transition temperature.
Computer Simulations and Molecular Modeling
Molecular dynamics simulations of the EC1 monomer of E-cadherin (PDB code: 1EDH)18,19 and the EC1 dimer containing a disulfide bond were performed for 10 ns using Nanoscale Molecular Dynamics 2.6 (NAMD 2.6).20 Both systems were solvated by cubic boxes of TIP3P water with a margin of ~15 Å between the protein and the boundaries of the periodic box. Na+ and Cl− counterions were added to neutralize the system. Protein, water, and ions were modeled with the CHARMM 22 force field.20 The particle mesh Ewald method was used to treat long-range electrostatic interactions. Periodic boundary conditions, 10 Å cutoff, and a switching cutoff distance of 8 Å for nonbonded van der Waals interactions were applied. All bonds involving hydrogen atoms were constrained using the SHAKE algorithm and a time-step of 2 fs was employed to integrate the equations of motion. The equilibration stage includes energy minimization of protein for 5,000 steps followed by minimization of the complete system for 10,000 steps to remove close contacts. Finally, the entire system was subjected to a gradual temperature increase from 0 to 300 K in intervals over 30 ps by increasing the temperature of Langevin damping and Langevin piston by 30 K in each step. The complete system was then equilibrated for 300 ps. Pressure and temperature were maintained at 1 atm and 300 K using a Langevin barostat and Langevin thermostat.
RESULTS
Chemical Stability of EC1
The EC1 protein was incubated in the presence and absence of 0.1 M DTT at pH 3.0, 7.0, and 9.0 at 4, 37, and 70 °C. Samples were drawn out at 0.5, 1, 2, and 4 h time-points and the supernatant after centrifugation of each sample at 12,000 × g was injected into the HPLC system. The decrease in the area under the EC1 peak as well as the increase in the area under any new peaks, if present, were monitored. Degradation products, represented by new peaks, were identified using LCMS (ESI-TOF).
The EC1 protein was stable when incubated at 4 °C for 4 h at pH values of 3.0, 7.0, and 9.0 (data not shown). There was no observable difference in the stability of EC1 in the absence and presence of DTT, suggesting that the protein was stable at low temperature.
The EC1 protein was stable at pH 3.0 for 4 h at 37 °C, and it was difficult to distinguish the effect of DTT on the stability of EC1 (Figure 2A). At pH 7.0, the amount of EC1 decreased to about 75.1 ± 14.9% after 4 h in the absence of DTT (Figure 2B). In contrast, the decrease of EC1 after 4 h in the presence of DTT at pH 7.0 was to about 94.4 ± 5.9% (Figure 2B). There was no observable chemical degradation product at pH 7.0 as monitored by HPLC; thus, the disappearance of the starting protein was due to physical degradation (i.e., protein aggregation and precipitation) (Figure 2B), implying that prevention of covalent dimer formation inhibits the precipitation of EC1.
Figure 2.
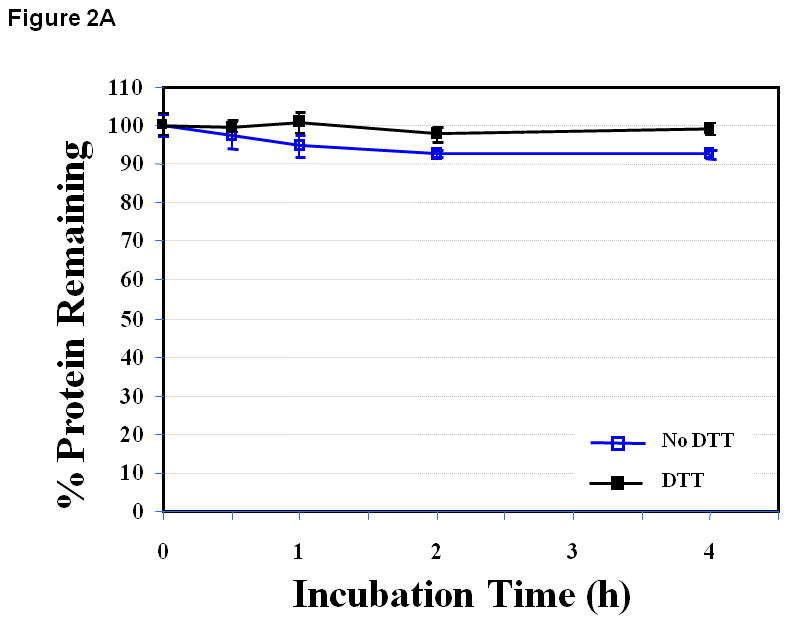
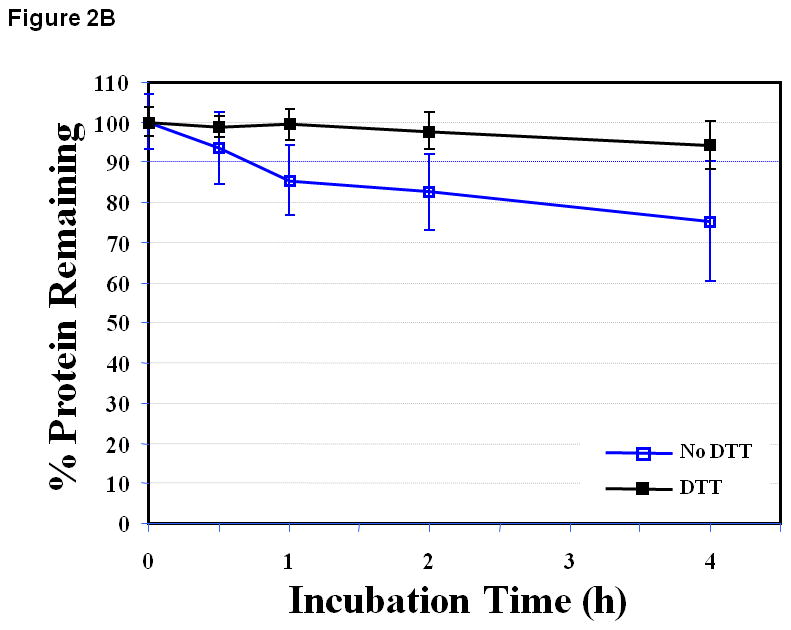
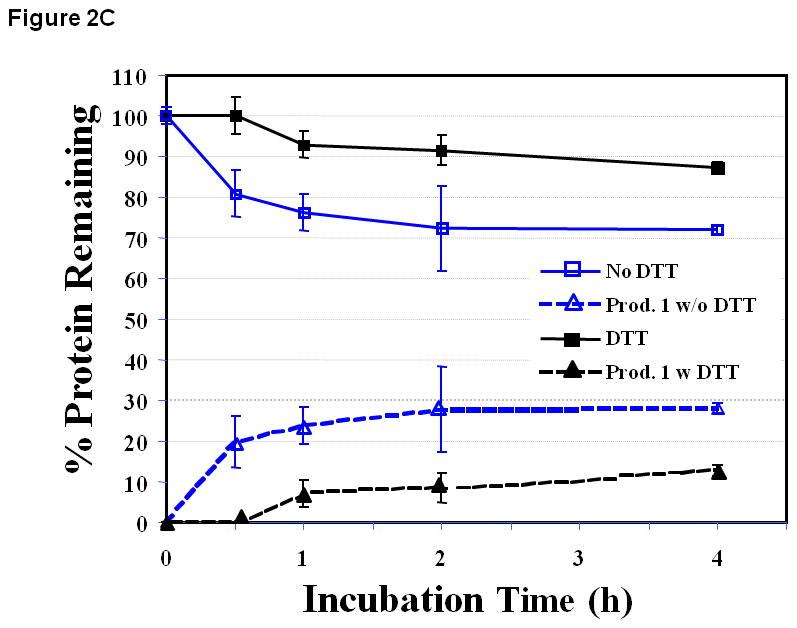
The stability profile of the EC1 domain incubated at 37 °C for 4 h in the absence and presence of 0.1 M DTT in buffer solutions at pH (A) 3.0, (B) 7.0 and (C) 9.0. (A) There is a small difference in the amount of EC1 remaining in the absence and presence of DTT at pH 3.0. (B) At pH 7.0 in the absence of DTT, 25% EC1 was lost after 4 h due to precipitation. In the presence of 0.1 M DTT, the amount of EC1 decreased only about 6% after 4 h. (C) At pH 9.0 and 37 °C in the absence of 0.1 M DTT, about 27% of EC1 degraded to form a new product. However, in the presence of 0.1 M DTT only 13% of EC1 degraded to form the new product.
At pH 9.0, however, a chemical degradation product appeared over time (Figure 2C) with a molecular weight of 10,386 Da as determined by ESI positive TOF-MS (data not shown). The degradation product corresponds to a protein fragment resulting from the cleavage of the peptide bond between the Asp93 and Pro94 residues (Figure 1). In the absence and presence of DTT, the amounts of the degradation product were around 28.0 ± 1.3% and 12 ± 1.3%, respectively, indicating that DTT suppressed the degradation of EC1. There was no precipitation observed at pH 9.0 with a good mass balance between the remaining EC1 and the degradation product in solution.
The degradation of EC1 at pH 3.0 and 70 °C was rapid compared to that at 4 and 37 °C with about 25.1 ± 9.4% and 5.5 ± 1.5% of EC1 remaining in solution after 2 h and 4 h incubation, respectively (Figure 3A). After 30 min, the degradation product of Asp93-Pro94 hydrolysis with a molecular weight of 10,386 Da was observed as was previously found at pH 9.0 and 37 °C. The size exclusion chromatography (SEC) could not separate the EC1 domain and the degradation product due to the small molecular weight difference between the two molecules. Because EC1 and the degradation product could be readily separated by C18 reversed-phase HPLC, the amounts of remaining EC1 and the degradation product(s) were determined by reversed-phase HPLC. An increase in the degradation product, from 19.6 ± 3.7% to 38.5 ± 15.1%, was seen during 0.5 to 2.0 h incubation followed by a drop in product amount to 12.2 ± 11.6% at the 4 h incubation time. The decrease in the amount of the degradation product in solution upon incubation longer than 2 h could be due to the precipitation of the product along with the EC1 covalent dimer. Here, it was found that DTT decreased the precipitation and completely suppressed the peptide bond hydrolysis degradation (Figure 3A).
Figure 3.
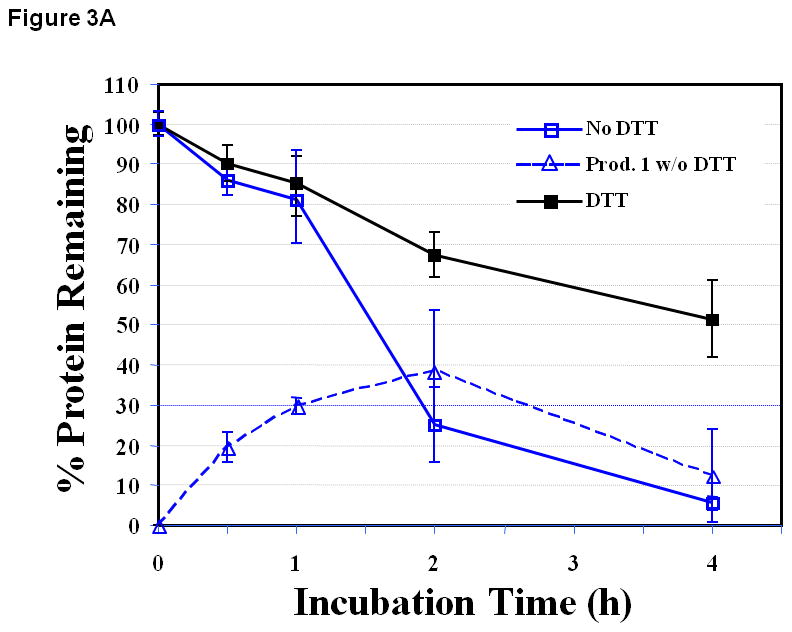
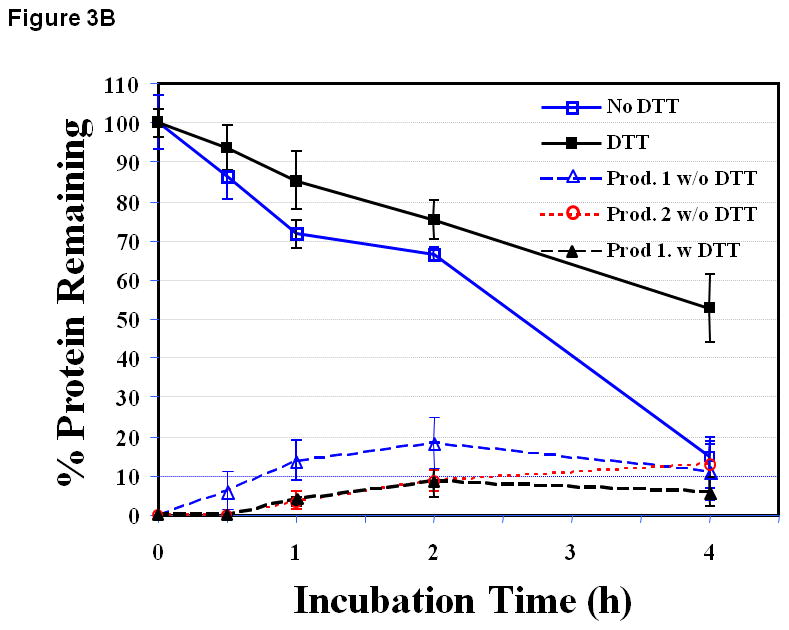
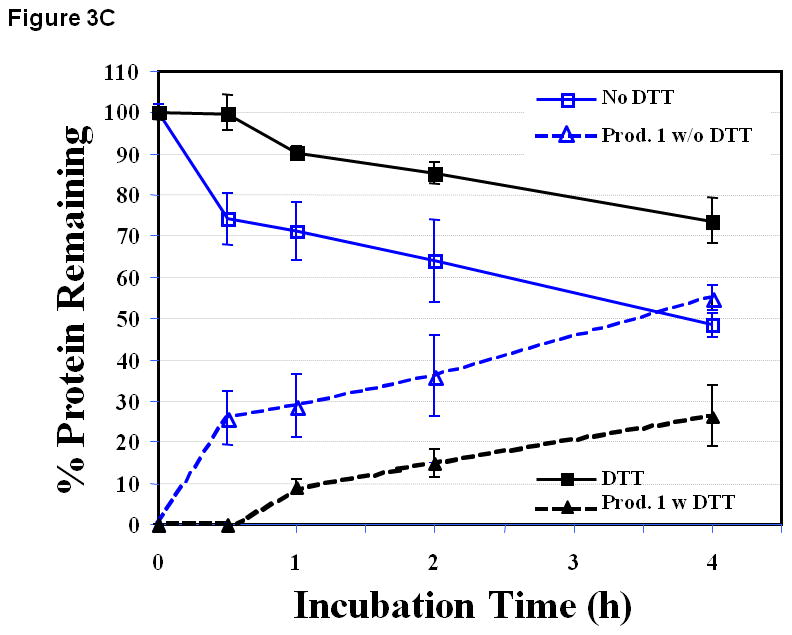
The stability profiles of the EC1 domain incubated at 70 °C for 4 h in the absence and presence of 0.1 M DTT in buffer solutions at pH (A) 3.0, (B) 7.0, and (C) 9.0. At all pH values, EC1 undergoes peptide bond hydrolysis and precipitation, and DTT suppresses the hydrolysis reaction and decreases EC1 precipitation.
At pH 7.0 in the absence of DTT, the remaining of EC1 after incubation for 2 h and 4 h was found to be 66.5 ± 1.7% and 14.7 ± 5.0%, respectively (Figure 3B), with two observed degradation products (1 and 2). The degradation product 1 was due to hydrolysis of at the Asp93 and Pro94 residue of EC1 and further degradation of product 1 generated product 2. Similar to pH 3.0, the disappearance of EC1 and the formation of the degradation products in solution did not produce a mass balance, suggesting that the degradation of EC1 involved the precipitation of the EC1 dimer and the degradation product. The addition of DTT inhibited the rate of peptide bond hydrolysis as well as the precipitation of EC1.
EC1 had the greatest amount of chemical degradation product at pH 9.0 with 54.8 ± 3.0% of the degradation after 4 h incubation (Figure 3C) compared to that at pH 3.0 and 7.0. Again, the production of the peptide bond hydrolysis product was suppressed by the presence of DTT. In addition, the amount of starting material remaining in solution was higher at pH 9.0 than at pH 3.0 or 7.0 at the 4 h time point, which suggests less precipitation of EC1 at pH 9.0 than at pH 3.0 and pH 7.0.
Physical Stability of EC1
Secondary structure evaluation using CD
At pH 3.0, the CD spectrum of EC1 has a negative peak around 216 nm before incubation (Figure 4A, day 0), suggesting that it has a predominantly β-sheet structure. This is consistent with the known structures of EC domains. Addition of DTT caused some change in the secondary structure of EC1. Upon storage of EC1 for 14 days at 4 °C without DTT, its CD spectrum was dramatically changed compared to the original spectrum and showed increasing β-sheet character. This could be due to oligomerization via β-sheet intermolecular interactions. Addition of DTT suppressed the change in the CD spectra of EC1 between day 0 and day 14 (Figure 4A), demonstrating that DTT inhibits the aggregation of the EC1 protein. At pH 7.0 (Figure 4B) and pH 9.0 (Figure 4C), the CD spectral changes were less dramatic than that at pH 3.0 (Figure 4A). The major changes in the CD spectra of EC1 at pH 7.0 after incubation for 14 and 28 days without DTT were in the minimum at 216 and the maximum at 205 nm (Figure 4B). Addition of 2.0 mM DTT to the buffer suppressed the spectral change upon incubation for 28 days. There were no observable changes in the CD spectra of EC1 at pH 9.0 after 28 days in the presence and absence of DTT (Figure 4C).
Figure 4.
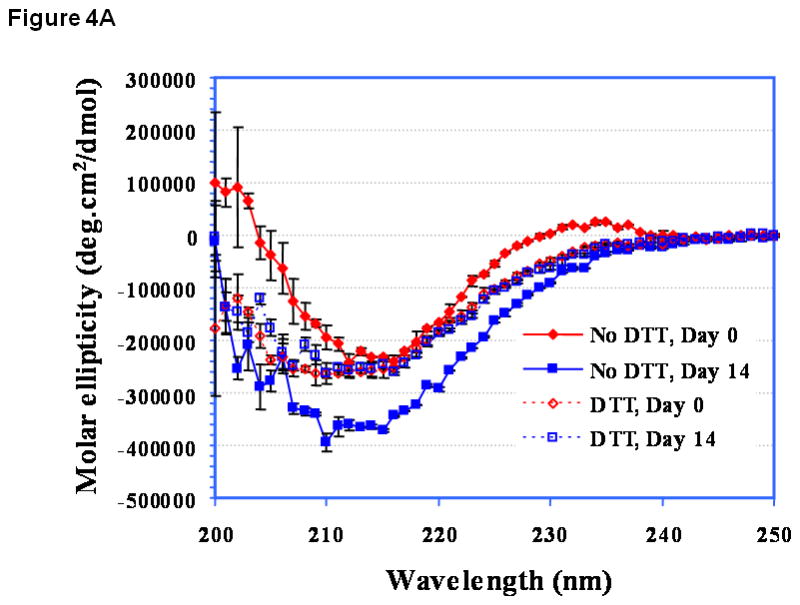
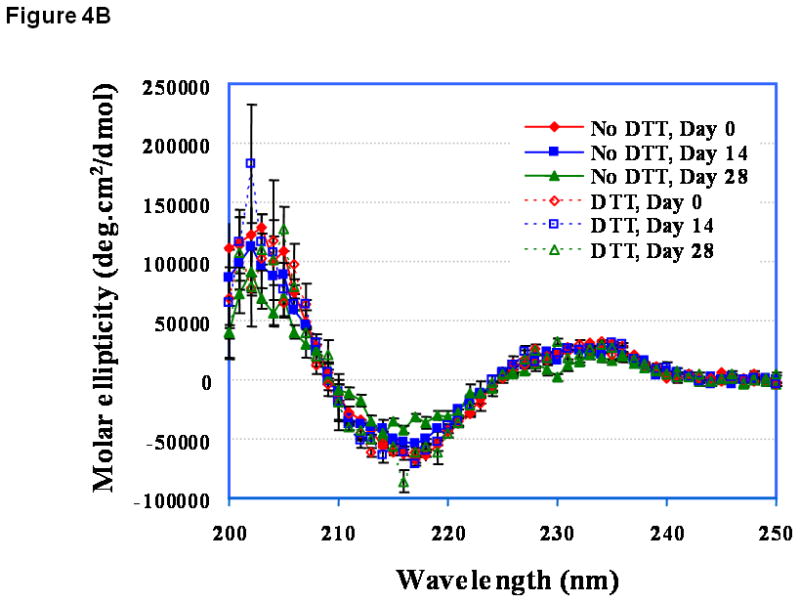
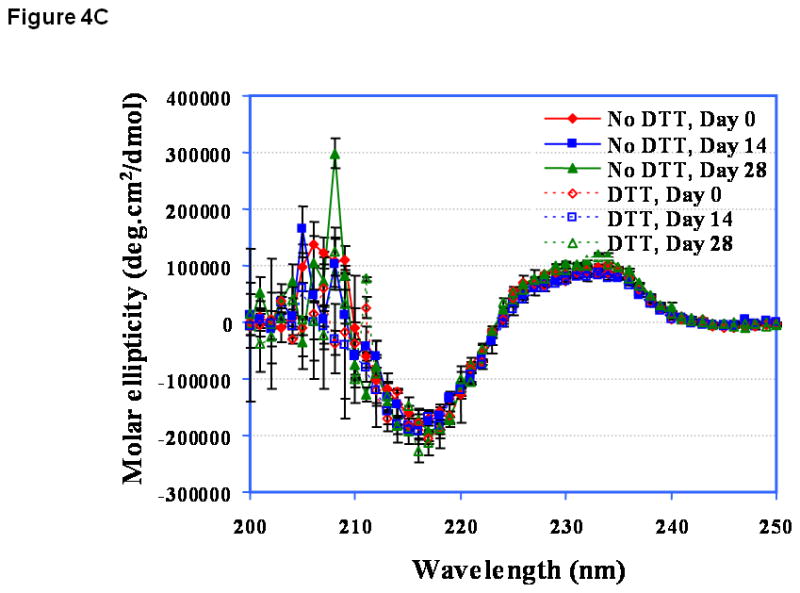
CD spectra of EC1 in the absence and presence of DTT after incubation at 4 °C for 0, 14, or 28 days at pH (A) 3.0, (B) 7.0, and (C) 9.0. (A) In the absence of DTT at pH 3.0, EC1 undergoes secondary structural change presumably due to dimerization and oligomerization. In the presence of DTT, there is no secondary structural change in EC1. (B) At pH 7.0 on day 28, there is some loss of the β-sheet structure of EC1 in the absence of DTT as seen from the decrease in the minimum at 216 nm; addition of DTT suppresses the secondary structural change of EC1. (C) At pH 9.0 on day 28, the CD spectra remain unchanged in the presence and absence of DTT.
The melting curves of EC1 were monitored at 218 nm and compared in the absence and presence of DTT (Figure 5). At pH 3.0 without DTT, the melting curves of EC1 were dramatically different between day 0 and day 14, with a more negative ellipticity minimum at day 14 than that at day 0 (Figure 5A). The melting temperatures (Tm) were 28.8 °C on day 0 and 33.1 °C on day 14, indicating that the protein could form oligomers with a higher Tm. In contrast, the thermal unfolding curves of EC1 on days 0 and 14 were very similar in the presence DTT (Figure 5A). At the final melting temperature, the protein solution with DTT had a lower absorbance minimum than that of protein without DTT, indicating that the β structure of the protein at high temperature in the absence of DTT was increased compared to that in the presence of DTT.
Figure 5.
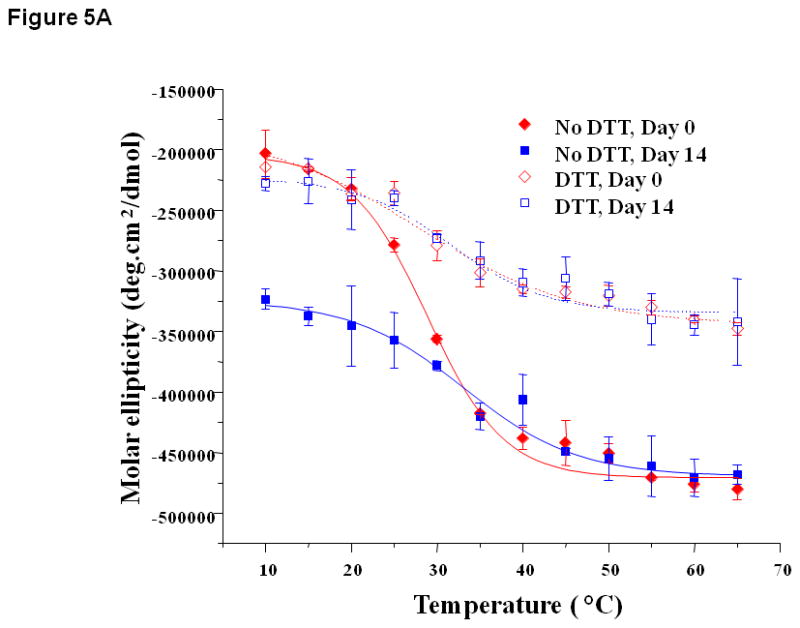
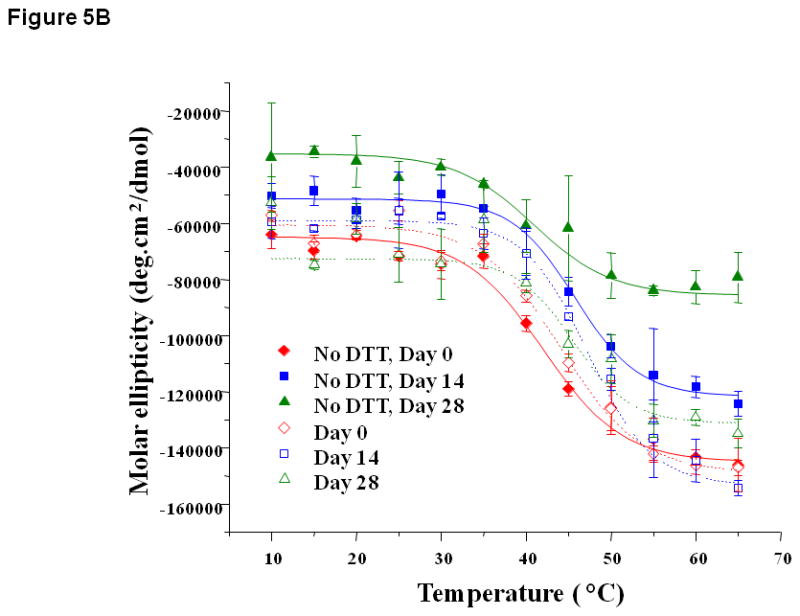
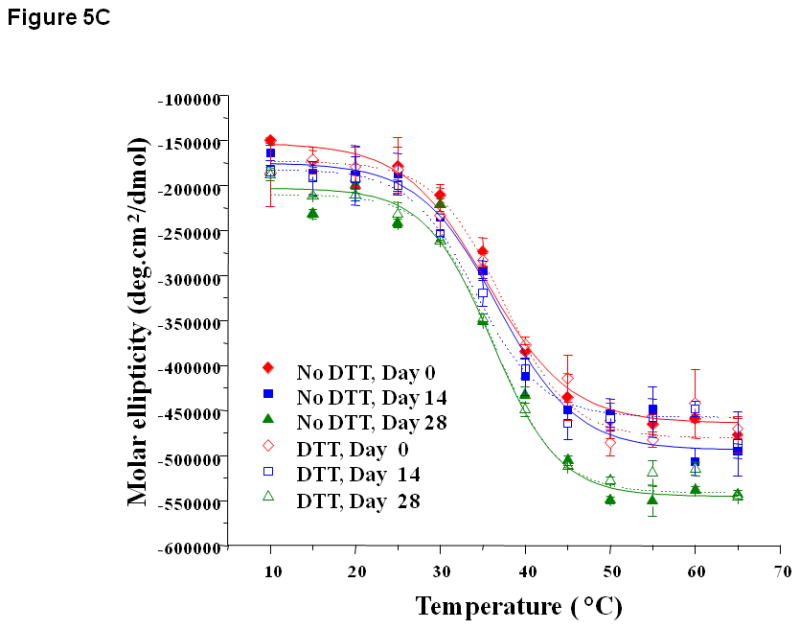
Thermal unfolding profiles of EC1 in the absence and presence of DTT measured by CD at 218 nm after incubation for 14 to 28 days at 4 °C at (A) pH 3.0, (B) 7.0, and (C) 9.0. (A) At pH 3.0, the thermal unfolding profiles in the absence of DTT are different on day 14 than on day 0. In the presence of DTT, the profiles look the same on days 0 and 14. (B) At pH 7.0, the thermal unfolding profiles in the absence of DTT are different at different time points; however, the profiles are relatively the same in the presence of DTT. (C) At pH 9.0, the thermal unfolding profiles are comparable after incubation for 14 and 28 days in the presence or absence of DTT.
At pH 7.0, thermal unfolding of EC1 at days 0, 14, and 28 in the presence of DTT did not show a difference in melting temperature (Tm = 44.6 °C, Figure 5B). Without DTT, thermal unfolding curves at pH 7.0 gradually shifted from day 0 to day 28 with an increase in initial and final ellipticities; this result is different than the one observed at pH 3.0, suggesting that the structures of the intermediates at pH 7.0 are different than those at pH 3.0. The presence of DTT prevented the change in thermal unfolding curves over time, again suggesting that DTT prevented the physical degradation of EC1. Thermal denaturation of EC1 at pH 9.0 produced a Tm at 37.8 °C (Figure 5C) with a slightly higher Tm after incubation up to day 28. At pH 9.0, DTT did not have a dramatic effect on the melting curve profiles of the EC1 domain at different time points.
Evaluation of tertiary structural change by fluorescence spectroscopy
The intrinsic fluorescence emission spectrum of EC1 at pH 3.0 on day 0 without DTT showed a maximum emission at 339.93 ± 0.04 nm. There was no observable change upon incubation for 14 days (data not shown). After 28 days, a slight blue shift to 337.09 ± 0.04 nm in the maximum emission was observed, implying that the Trp residue environment became more apolar. In the presence of DTT on day 0, EC1 showed an emission profile (339.85 ± 0.04 nm) similar to that in the absence of DTT. A blue shift to 337.35 ± 0.04 nm was also observed after incubation for 28 days. At pH 7.0 without DTT, the emission maximum was 339.27 ± 0.03 nm; after incubation for 28 days, there was a considerable red shift in the emission maximum to 345.81 ± 0.13 nm, presumably due to the solvent exposure of the Trp residues (Figure 6A). The presence of DTT inhibited the red shift in the emission maximum from 339.26 ± 0.03 nm on day 0 to 340.66 ± 0.04 nm on day 28. Without DDT at pH 9.0, the intrinsic fluorescence spectra showed a slight blue shift from 341.32 ± 0.03 nm on day 0 to 340.32 ± 0.03 nm and 340.08 ± 0.03 nm on days 14 and 28, respectively (data not shown). In the presence of DTT, the shift in maximum emission was from 341.06 ± 0.03 nm on day 0 to 341.19 ± 0.02 nm and 341.42 ± 0.03 nm on days 14 and 28, respectively.
Figure 6.
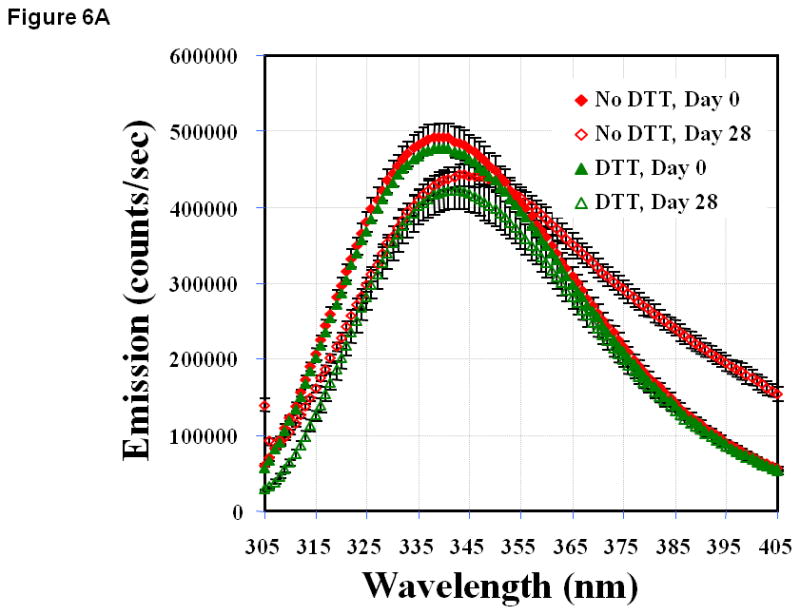
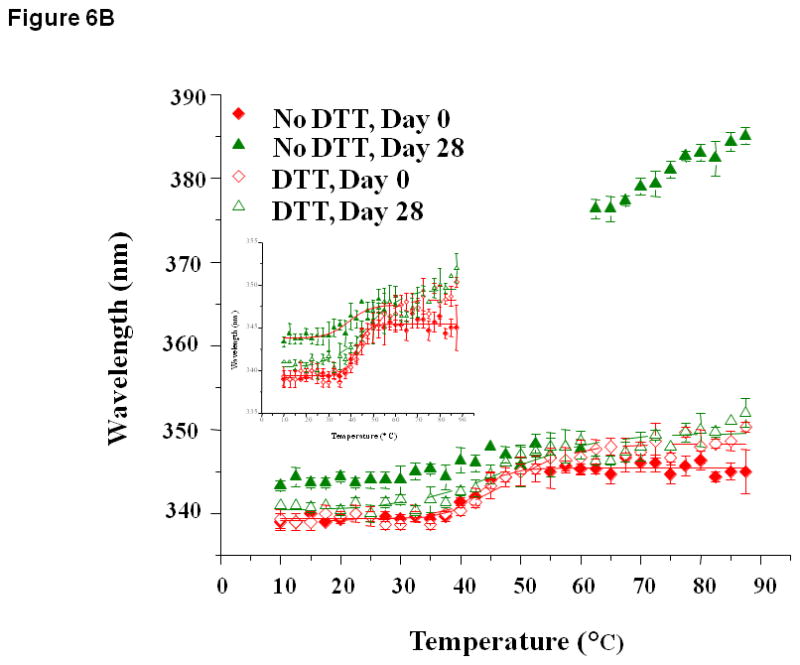
(A) Fluorescence spectra of EC1 in the absence and presence of DTT after incubation at 4 °C for 0 or 28 days at pH 7.0. A shift in maximum emission to a higher wavelength is observed in the absence of DTT; however, this shift is inhibited by addition of DTT. (B) Thermal unfolding of EC1 in the absence and presence of DTT evaluated by change in the wavelength of maximum intrinsic fluorescence emission (after excitation at 295 nm) from 0 to 87.5 °C after incubation for 0, 14, or 28 days at 4 °C and pH 7.0. The inset is the scaled up unfolding profile to show the inflections in different incubation conditions.
The thermal transitions of EC1 at pH 3.0, 7.0, and 9.0 were also monitored by fluorescence spectroscopy at the emission wavelength of 340 nm upon heating from 10 to 87.5 °C. At pH 3.0, there was no clear and observable transition seen in the absence or presence of DTT at all time points (data not shown). Distinct thermal transitions, however, were observed at pH 7.0 in both the absence and presence of DTT (Figure 6B). In the absence of DTT, the transition temperature decreased from 42.63 ± 0.56 °C at day 0 to 39.10 ± 2.31 °C at day 28. On the other hand, relatively constant transition temperatures were observed in the presence of DTT between day 0 (45.36 ± 0.79 °C) and day 28 (45.14 ± 0.65 °C). At pH 9.0, transitions were observed on day 0 in the absence and presence of DTT; these transitions did not change significantly after incubation for 28 days with and without DTT (data not shown).
Molecular dynamics simulations of EC1 monomer and dimer
To explain the difference between the stabilities of EC1 monomer and dimer, 10 ns equilibrium simulations were conducted on both in solution. To explore their dynamic stability, root-mean-square displacement (RMSD) values for the protein Cα atoms were calculated and plotted during the production phase relative to the starting structures for EC1 monomer (Figure 7A) and EC1 dimer (Figure 7B). The RMSD plots indicated that the structures of the EC1 monomer (Figure 7A) achieved equilibrium much faster than those of the dimer (Figure 7B); the dimer achieves equilibrium around 3 ns of simulations. The RMSD values of the monomer are within 1.5 Å of those of the initial structure while the RMSDs of the dimer are in the range of 3.5–4.0 Å. RMSDs were also plotted against the residue number for the monomer (Figure 7C) and chains A and B of the dimer (Figure 7D). The average RMSD value per residue of the dimer is larger than that of the monomer, demonstrating that the dimer has larger overall flexibility than the monomer. Structural snapshots of the monomer and dimer after 2, 5, 7, and 10 ns simulations are shown in Figures 8A and 8B, respectively. All four structures of the EC1 monomer are very stable, without noticeable differences. In contrast, there are significant differences among the snapshot structures of the dimer, with some of the regions showing increased dynamic properties (Figure 8B). The increased dynamic properties of the disulfide-mediated EC1 dimer may explain the decreased chemical and physical stability of the dimer.
Figure 7.
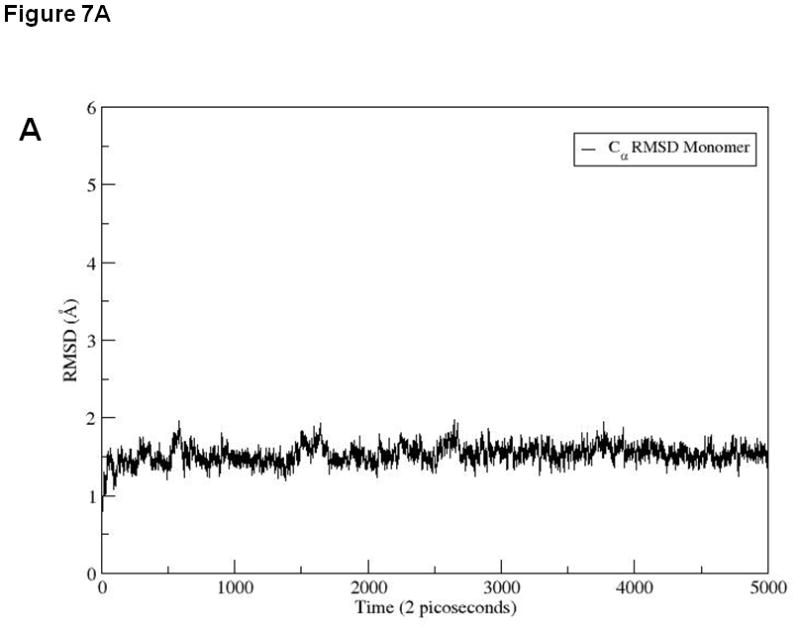
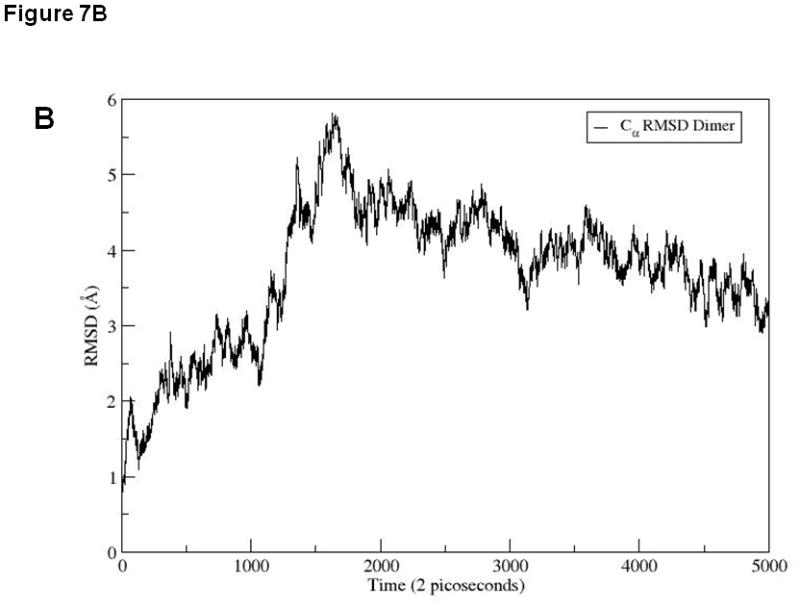
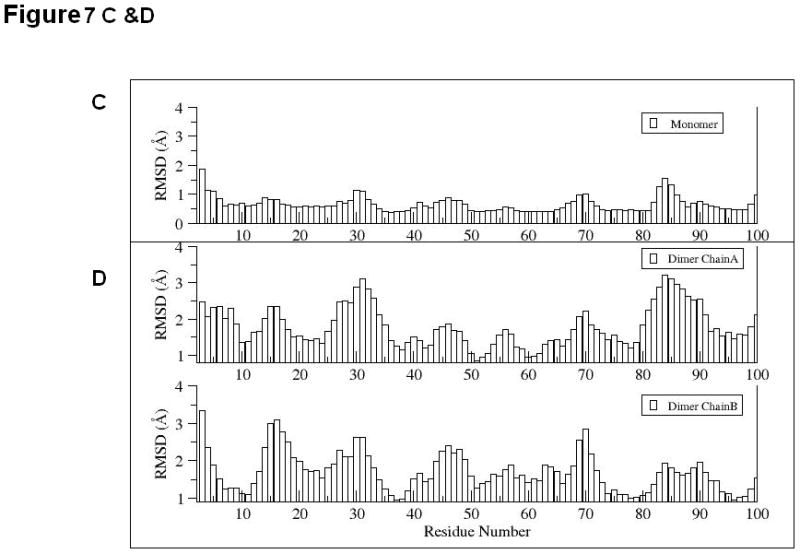
RMSD values for 10 ns simulations of (A) EC1 monomer and (B) EC1 dimer. RMSD values for each residue in (C) EC1 monomer and (D) both A and B chains of EC1 dimer at the end of 10 ns equilibrium simulations.
Figure 8.
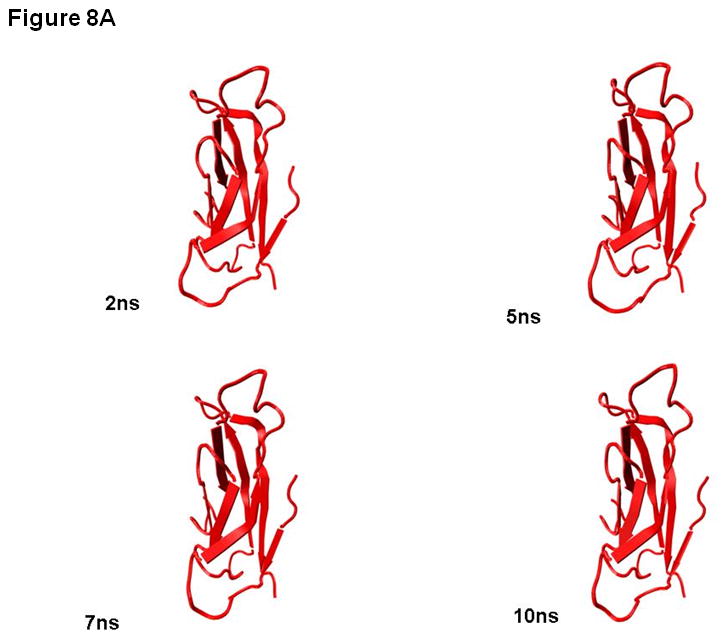
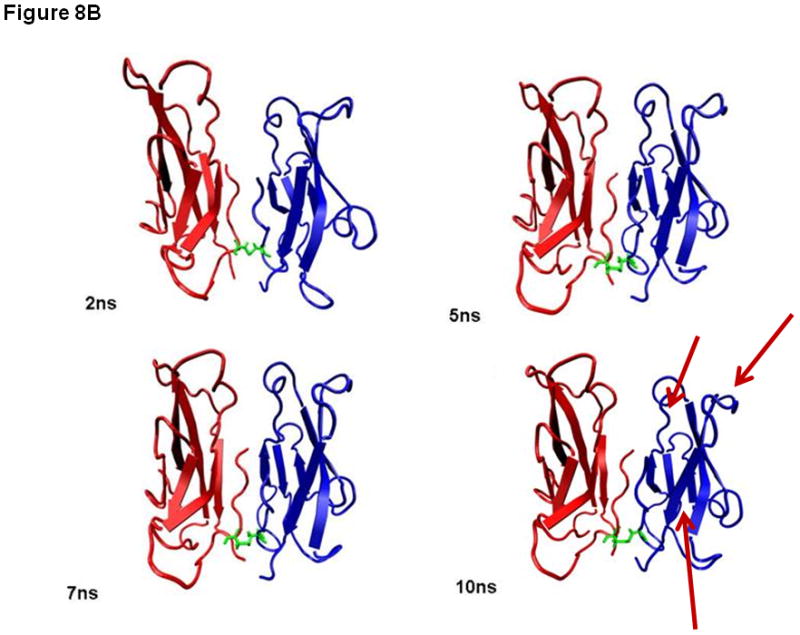
Snapshots of (A) EC1 monomer and (B) EC1 dimer after 2, 5, 7 and 10 ns of molecular dynamics simulations. The arrows indicate the flexible regions of the EC1 dimer during molecular dynamics simulations.
DISCUSSION
Previously, EC1 was found as a mixture of monomer, dimer, and oligomers; three peaks were observed in SEC.14 Upon isolation of each peak, the longest eluted peak (peak 3) was identified as the monomer of EC1 and followed a middle peak (peak 2), which was determined as a covalent dimer of EC1 (EC-ss-EC1) by SDS-PAGE, SEC, and HPLC/dynamic light scattering. The earliest peak (peak 1) was identified as a non-covalent hexameric form of the covalent dimers (EC1-ss-EC1) identified by HPLC/dynamic light scattering, electron microscopy, and crosslinking methods.14 SDS-PAGE of peak 1 showed a protein with a dimer molecular weight, suggesting that peak 1 was derived from physical interactions of EC1-ss-EC1. The electron microscopy study also showed other forms of oligomers of EC1-ss-EC1 with two and more than six units of EC1-ss-EC1. Addition of DTT to peak 1 converted the hexameric form to a monomer as identified by SEC and dynamic light scattering. These results indicated that the formation of oligomers was mediated by physical interactions EC1-ss-EC1. Upon mutation of the Cys residue with an Ala residue, the dimeric and oligomeric forms of EC1 were not observed.14 The fact that EC1 monomers do not oligomerize before forming covalent dimers leads us to hypothesize that the structures of the EC1 monomer and covalent dimer are different. In this work, we evaluated the chemical stability of EC1 and the changes in its structure in the absence and presence of a reducing agent, DTT.
In general, the accelerated thermal degradation mechanism of EC1 in solution involves chemical degradation and aggregation that leads to protein precipitation, which can be observed visually. The mass balance between the degradation products and the remaining starting material in solution did not add up to 100%; this difference in mass balance can be attributed to protein precipitation. Most of the degradation profiles in different pH values and temperatures (Figures 2 and 3) show the appearance of two different slopes, which possibly due to two different reactions as the rate determining steps. There are at least four different possible reactions occur in solution: (1) the formation of dimer via a disulfide bond, (2) the hydrolysis of the Asp-Pro peptide bond, (3) the physical oligomerization of EC1, and (4) the formation of precipitates of the higher order oligomers; however, it is difficult to determine which reactions that are involved as the rate determining steps.
The EC1 domain also showed hydrolysis products at all pH values at 70 °C; at 37 °C, this hydrolysis was observed only at pH 9.0. The degradation products were the result of a peptide bond hydrolysis between Asp93 and Pro94 residues as identified by ESI MS. Base-catalyzed hydrolysis of the Asp-Pro peptide bond has been reported previously in peptides and proteins, including peptide bond cleavage of Asp133–Pro134 in recombinant human interleukin 1121 and Asp169-Pro170 in recombinant human macrophage colony-stimulating factor.22 It has been previously reported that the peptide and protein degradation mechanisms at Asp residues were different at different pH values (acidic, neutral, and basic).23,24 At pH <5.0, the major degradation products are derived from peptide bond hydrolysis at the N- and C-termini of the target Asp residue via the anchimeric assistance of the carboxylic acid side chain of the Asp residue. At neutral and basic conditions (pH >6.0), the degradation mechanism is through a cyclic-imide intermediate formation that can produce iso-Asp as well as related hydrolysis products.23,24 Due to the absence of the amide hydrogen in the Asp-Pro peptide bond of EC1, the degradation of EC1 in neutral and basic conditions cannot proceed through the cyclic-imide intermediate; therefore, it was expected that iso-Asp product would not be observed as a degradation product of EC1. An important finding here is that the addition of DTT suppresses or completely eliminates the Asp93-Pro94 peptide bond hydrolysis. Because in the presence of DTT only the monomeric form exists in solution, the results suggest that the hydrolysis of the EC1 monomer may be catalyzed by dimeric and/or oligomeric forms of EC1. In other words, the monomeric form is chemically more stable than the dimer and oligomer forms; thus, the EC1 domain can be stabilized against peptide bond hydrolysis by trapping it in its monomeric form.
The effect of 4 °C storage on the secondary structure and physical stability of EC1 in the absence and presence of DTT was evaluated by far UV CD. EC1 showed a negative CD peak at 216 nm at all pH values, which is characteristic of β-sheet proteins. The X-ray18 and NMR7 structures of EC1 showed that it has seven β-strands and two small α-helices. After storage at 4 °C for 14 days at pH 3.0 in the absence of DTT, the CD spectrum changed dramatically, with the peak at 216 nm becoming more negative. This could imply the generation of aggregates via the formation of intermolecular β-sheet interactions. In contrast, there was no change in the CD spectrum after 14 days incubation in the presence of DTT, indicating that there was no secondary structural change. It should be noted that addition of DTT at pH 3.0 changes the spectrum of EC1 on day 0, suggesting that DTT induces a secondary structural change in EC1 that prevents the physical degradation of EC1 at pH 3.0 upon 4 °C storage (Figures 4A and 5A). At pH 7.0 and 9.0, there were no observable changes in the CD spectra of EC1 with DTT on day 0 and day 28. Upon incubation of EC1 in the absence of DTT, there were observable changes in the CD spectrum on day 28 compared to that on day 0.
To further differentiate the effect of DTT on the thermal stability and possible oligomerization of EC1, thermal unfolding profiles of EC1 after incubation at 4 °C at 0, 14, and 28 days were determined by monitoring the CD spectra at 218 nm. At pH 3.0, thermal unfolding profiles at days 0 and 14 were very similar in the presence of DTT but were very different in its absence. This suggests that protein structural changes (i.e., oligomerization) occur upon incubation in the absence of DTT. In the absence of DTT at pH 7.0, CD spectra of EC1 changed after storage for 14 and 28 days; in contrast, there was no observable change in the presence of DTT. At pH 9.0, thermal unfolding properties of EC1 did not change significantly upon storage at 4 °C in the absence and presence of DTT. These results suggest that the secondary structures of the monomer and covalent dimer are very similar at pH 9.0; however, they are different at lower pH values.
Changes in the tertiary structure of EC1 upon incubation under different conditions were also monitored by observing the emission spectra of Trp6 and Trp63 in EC1 using fluorescence spectroscopy. The Trp6 residue is located close to Cys13. We hypothesized that the formation of intermolecular disulfide between two Cys13 residues can cause a change in the conformation of EC1 that alters the environment of one or both Trp residues. There was considerable change in the environment of at least one of the Trp residues over a period of 28 days incubation at 4 °C and pH 3.0 and 7.0. In the case of pH 7.0, there was a red shift indicating a more polar environment for one of both Trp residue(s); in contrast, a blue shift was observed at pH 3.0, indicating a more apolar environment of the Trp residue. Thus, the resulting tertiary structures or association states of EC1 were different at these two pH values (i.e., 3.0 and 9.0). The addition of DTT prevented the fluorescence change at pH 7.0, but not at pH 3.0. This is in contrast to the CD data in which addition of DTT prevented a change in the secondary structure of EC1 at both pH 3.0 and 7.0. The Trp6 residue has been shown previously to be involved in domain swapping to form EC1 physical dimers, suggesting that the fluorescence changes seen could be due to the contribution of Trp6 domain swapping upon covalent dimer formation. At pH 3.0, the rate formation of the intermolecular disulfide may be slowed down, resulting in a predominance of domain swapped physical dimers, which subsequently oligomerize. In such structures, the Trp6 would be expected to be buried; hence, the blue shift is observed at pH 3.0.
Our findings show that the formation of a covalent dimer induces chemical and physical instability; in an attempt to explain this observation, the dynamic properties of the EC1 monomer and dimer were examined using computer simulations. Previously, molecular dynamics simulations were done to determine the dynamic properties of the EC1–2 portion of E-cadherin in the presence and absence of calcium ions. These simulations confirmed that apo-cadherin shows much higher conformational flexibility on a nanosecond timescale than does the calcium-bound form.25 The results from the current molecular dynamics simulations showed that the EC1 dimer had a greater mobility than did the EC1 monomer. Larger fluctuations were observed around residues 15, 30, 70, and 85 of the dimer compared to those on the EC1 monomer (Figures 7C and 7D). In the EC1 dimer, some hydrophobic residues that would be expected to be folded into the core of the protein were found to be solvent-exposed at the end of the molecular simulations. Intermolecular interactions of these exposed hydrophobic residues on several EC1 dimers could be the driving force for the formation of oligomers in solution. These dramatic conformational changes were not observed in the simulation of the EC1 monomer; thus, keeping the EC1 domain in the monomeric form with DTT prevents its oligomerization. The formation of a covalent dimer could make the Asp93 and Pro94 residues more flexible and exposed to the solvent (Figure 8B), leaving the Asp93–Pro94 peptide bond susceptible to hydrolysis. These molecular simulations data support the hypothesis that the formation of oligomers may be via the covalent EC1 dimer, which induces a change in conformation that results in the Asp-Pro peptide bond becoming solvent-exposed and susceptible to hydrolysis.
In conclusion, this study showed that EC1 degradation is mediated by the formation of an EC1 covalent dimer via its Cys13 residue. Although the Asp-Pro hydrolysis and disulfide bond formation have an important role in the degradation of EC1, other degradation mechanisms may also occur in this protein. This covalent dimer induces a conformational change in EC1 that is prone to produce oligomers, which lead to precipitation and facilitate chemical hydrolysis. Thus, prevention of covalent dimer formation by alkylating the thiol group could be an alternative method to stabilize the EC1 domain in solution without addition of a reducing agent. The alkylation of the thiol group of Cys13 will provide an EC1 monomer that can potentially be used to block E-cadherin-mediated homotypic and heterotypic cell-cell adhesion for use in pharmaceutical applications.
Supplementary Material
Acknowledgments
This work was supported by a grant from NIH (R01-EB-00226). TJS would like to acknowledge Self Faculty Scholar funds from The University of Kansas and Pfizer Faculty Scholar funds for financial support. We also thank Nancy Harmony for proofreading this manuscript.
References
- 1.Pokutta S, Drees F, Yamada S, Nelson WJ, Weis WI. Biochemical and structural analysis of alpha-catenin in cell-cell contacts. Biochem Soc Trans. 2008;36:141–147. doi: 10.1042/BST0360141. [DOI] [PMC free article] [PubMed] [Google Scholar]
- 2.Zheng K, Trivedi M, Siahaan TJ. Structure and function of the intercellular junctions: barrier of paracellular drug delivery. Curr Pharm Design. 2006;12:2813–2824. doi: 10.2174/138161206777947722. [DOI] [PubMed] [Google Scholar]
- 3.Boggon TJ, Murray J, Chappuis-Flament S, Wong E, Gumbiner BM, Shapiro L. C-cadherin ectodomain structure and implications for cell adhesion mechanisms. Science. 2002;296:1308–1313. doi: 10.1126/science.1071559. [DOI] [PubMed] [Google Scholar]
- 4.Nose A, Tsuji K, Takeichi M. Localization of specificity determining sites in cadherin cell adhesion molecules. Cell. 1990;61:147–155. doi: 10.1016/0092-8674(90)90222-z. [DOI] [PubMed] [Google Scholar]
- 5.Shapiro L, Fannon AM, Kwong PD, Thompson A, Lehmann MS, Grubel G, Legrand J-F, Als-Nielsen J, Colman DR, Hendrickson WA. Structural basis of cell-cell adhesion by cadherins. Nature. 1995;374:327–337. doi: 10.1038/374327a0. [DOI] [PubMed] [Google Scholar]
- 6.He W, Cowin P, Stokes DL. Untangling desmosomal knots with electron tomography. Science. 2003;302:109–113. doi: 10.1126/science.1086957. [DOI] [PubMed] [Google Scholar]
- 7.Overduin M, Harvey T, Bagby S, Tong K, Yau P, Takeichi M, Ikura M. Solution structure of the epithelial cadherin domain responsible for selective cell-adhesion. Science. 1995;267:386–389. doi: 10.1126/science.7824937. [DOI] [PubMed] [Google Scholar]
- 8.Lutz KL, Siahaan TJ. Modulation of the cellular junctions protein E-cadherin in bovine brain microvessel endothelial cells by cadherin peptides. Drug Del. 1997;10:187–193. [Google Scholar]
- 9.Kobayashi N, Ikesue A, Majumdar S, Siahaan TJ. Inhibition of E-cadherin-mediated homotypic adhesion of Caco-2 cells: a novel evaluation assay for peptide activities in modulating cell-cell adhesion. J Pharmacol Exp Ther. 2006;317:309–316. doi: 10.1124/jpet.105.097535. [DOI] [PubMed] [Google Scholar]
- 10.Sinaga E, Jois SD, Avery M, Makagiansar IT, Tambunan US, Audus KL, Siahaan TJ. Increasing paracellular porosity by E-cadherin peptides: Discovery of bulge and groove regions in the EC1-domain of E-cadherin. Pharm Res. 2002;19:1170–1179. doi: 10.1023/a:1019850226631. [DOI] [PubMed] [Google Scholar]
- 11.Makagiansar I, Avery M, Hu Y, Audus KL, Siahaan TJ. Improving the selectivity of HAV-peptides in modulating E-cadherin-E-cadherin interactions in the intercellular junction of MDCK cell monolayers. Pharm Res. 2001;18:446–553. doi: 10.1023/a:1011094025008. [DOI] [PubMed] [Google Scholar]
- 12.Karecla PI, Green SJ, Bowden SJ, Coadwell J, Kilshaw PJ. Identification of a binding site for integrin alphaEbeta7 in the N-terminal domain of E-cadherin. J Biol Chem. 1996;271:30909–30915. doi: 10.1074/jbc.271.48.30909. [DOI] [PubMed] [Google Scholar]
- 13.Makagiansar IT, Ikesue A, Duc Nguyen P, Urbauer JL, Bieber Urbauer RJ, Siahaan TJ. Localized production of human E-cadherin-derived first repeat in Escherichia coli. Prot Express Purif. 2002;26:449–454. doi: 10.1016/s1046-5928(02)00553-3. [DOI] [PubMed] [Google Scholar]
- 14.Makagiansar IT, Nguyen PD, Ikesue A, Kuczera K, Dentler W, Urbauer JL, Galeva N, Alterman M, Siahaan TJ. Disulfide bond formation promotes the cis- and trans-dimerization of the E-cadherin-derived first repeat. J Biol Chem. 2002;277:16002–16010. doi: 10.1074/jbc.M200916200. [DOI] [PubMed] [Google Scholar]
- 15.Zabell KM, Laurence JS, Kinch MS, Knapp DW, Stauffacher CV. Expression and purification of the intact cytoplasmic domain of the human ephrin receptor A2 tyrosine kinase in Escherichia coli. Prot Express Purif. 2006;47:210–216. doi: 10.1016/j.pep.2005.10.031. [DOI] [PubMed] [Google Scholar]
- 16.Derrick TS, Kashi RS, Durrani M, Jhingan A, Middaugh CR. Effect of metal cations on the conformation and inactivation of recombinant human factor VIII. J Pharm Sci. 2004;93:2549–2557. doi: 10.1002/jps.20167. [DOI] [PubMed] [Google Scholar]
- 17.Rexroad J, Wiethoff CM, Green AP, Kierstead TD, Scott MO, Middaugh CR. Structural stability of adenovirus type 5. J Pharm Sci. 2003;92:665–678. doi: 10.1002/jps.10340. [DOI] [PubMed] [Google Scholar]
- 18.Nagar B, Overduin M, Ikura M, Rini JM. Structural basis of calcium-induced E-cadherin rigidification and dimerization. Nature. 1996;380:360–364. doi: 10.1038/380360a0. [DOI] [PubMed] [Google Scholar]
- 19.Pertz O, Bozic D, Koch AW, Fauser C, Brancaccio A, Engel J. A new crystal structure, Ca2+ dependence and mutational analysis reveal molecular details of E-cadherin homoassociation. Embo J. 1999;18:1738–1747. doi: 10.1093/emboj/18.7.1738. [DOI] [PMC free article] [PubMed] [Google Scholar]
- 20.Phillips JC, Braun R, Wang W, Gumbart J, Tajkhorshid E, Villa E, Chipot C, Skeel RD, Kale L, Schulten K. Scalable molecular dynamics with NAMD. J Comput Chem. 2005;26:1781–1802. doi: 10.1002/jcc.20289. [DOI] [PMC free article] [PubMed] [Google Scholar]
- 21.Kenley RA, Warne NW. Acid-Catalyzed Peptide Bond Hydrolysis of Recombinant Human Interleukin 11. Pharm Res. 1994;11:72–76. doi: 10.1023/a:1018945727640. [DOI] [PubMed] [Google Scholar]
- 22.Schrier JA, Kenley RA, Williams R, Corcoran RJ, Kim Y, Jr, RPN, D’Augusta D, Huberty M. Degradation pathways for recombinant human macrophage colony-stimulating factor in aqueous solution. Pharm Res. 1993;10:933–944. doi: 10.1023/a:1018990001310. [DOI] [PubMed] [Google Scholar]
- 23.Oliyai C, Borchardt RT. Chemical pathways of peptide degradation. IV. Pathways, kinetics, and mechanism of degradation of an aspartyl residue in a model hexapeptide. Pharm Res. 1993;10:95–102. doi: 10.1023/a:1018981231468. [DOI] [PubMed] [Google Scholar]
- 24.Bogdanowich-Knipp SJ, Chakrabarti S, Williams TD, Dillman RK, Siahaan TJ. Solution stability of linear vs. cyclic RGD peptides. J Pept Res. 1999;53:530–541. doi: 10.1034/j.1399-3011.1999.00052.x. [DOI] [PubMed] [Google Scholar]
- 25.Cailliez F, Lavery R. Cadherin Mechanics and Complexation: The Importance of Calcium Binding. Biophys J. 2005;89:3895–3903. doi: 10.1529/biophysj.105.067322. [DOI] [PMC free article] [PubMed] [Google Scholar]
Associated Data
This section collects any data citations, data availability statements, or supplementary materials included in this article.


