Abstract
Background
An imbalance in circulating angiogenic factors plays a central role in the pathogenesis of preeclampsia.
Methods and Results
We prospectively studied 616 women who were evaluated for suspected preeclampsia. We measured plasma levels of antiangiogenic soluble fms-like tyrosine kinase 1 (sFlt1) and proangiogenic placental growth factor (PlGF) at presentation, and examined for an association between sFlt1/PlGF ratio and subsequent adverse maternal and perinatal outcomes within 2 weeks.
The median [25th–75th centile] sFlt1/PlGF ratio at presentation was elevated in participants who experienced any adverse outcome compared to those who did not (47.0 [15.5–112.2] versus 10.8 [4.1–28.6], p<0.0001). Among those presenting <34 weeks (N=167), the results were more striking (226.6 [50.4–547.3] versus 4.5 [2.0–13.5], p<0.0001), and the risk was markedly elevated when the highest sFlt1/PlGF ratio tertile was compared to the lowest (OR 47.8, 95% CI 14.6–156.6). Among participants presenting at <34 weeks, the addition of sFlt1/PlGF ratio to hypertension and proteinuria significantly improved the prediction for subsequent adverse outcomes (AUC=0.93 for hypertension, proteinuria, and sFlt1/PlGF versus AUC=0.84 for hypertension and proteinuria alone; P=0.001). Delivery occurred within two weeks of presentation in 86.0% of women with sFlt1/PlGF ratio ≥ 85 compared with 15.8% of women with sFlt1/PlGF ratio <85 (HR 15.2, 95% CI 8.0–28.7).
Conclusions
In women with suspected preeclampsia presenting at <34 weeks, circulating sFlt1/PlGF ratio predicts adverse outcomes occurring within two weeks. The accuracy of this test is substantially better than current approaches and may be useful in risk stratification and management. Additional studies are warranted to validate these findings.
Keywords: Preeclampsia, adverse maternal and perinatal outcomes, angiogenic factors, triage, hypertension, proteinuria
Introduction
Pregnancy associated hypertension is common, with an incidence rate of approximately 5% of all deliveries.1 Of the hypertensive complications associated with pregnancy, preeclampsia is the most likely to result in serious adverse events including maternal acute renal failure, liver dysfunction, seizures and cerebral accidents, fetal growth restriction, and death of the mother or fetus. Preeclampsia is the leading indication for premature delivery of a fetus and is therefore associated with substantial neonatal morbidity and mortality, as well as considerable health care expenditure.2
Preeclampsia is characterized by the presence of elevated blood pressures and proteinuria after 20 weeks gestation.3 However, clinical criteria alone may be inadequate to predict adverse outcomes, as a significant proportion of women may develop complications including eclampsia and HELLP syndrome (Hemolysis, Elevated Liver enzymes and Low Platelets), without elevated blood pressures or without proteinuria.4 Conversely, some women with preeclampsia are able to carry a pregnancy to near full term without complications. Because of the unpredictable nature of adverse outcomes in this population, women with suspected preeclampsia are often hospitalized for close observation and monitoring including frequent laboratory testing and evaluation of fetal wellbeing.3 The decision for preterm delivery of the fetus in the setting of preterm preeclampsia (at less than 34 weeks gestation) is based on the estimated risk of an adverse outcome balanced with the considerable benefit to the fetus if pregnancy is prolonged. Expectant management is usually attempted in women thought to be at high risk for complications until 34 weeks gestation, after which the neonatal outcomes are excellent and the benefit for the fetus is usually outweighed by the estimated risk to the mother.3
Despite consensus guidelines outlining the indication for delivery in patients with pregnancy-associated hypertension, risk assessment remains challenging, as there is no sign, symptom, or laboratory test that has been shown to predict adverse outcomes with high accuracy.5, 6
The placentally released proteins soluble fms like tyrosine kinase-1 (sFlt1) and placental growth factor (PlGF) are altered in the circulation of pregnant women with preeclampsia.7 sFlt1 antagonizes the action of proangiogenic proteins such as VEGF and PlGF, which are necessary for normal vascular endothelial homeostasis.8 Animal studies suggest that elevated circulating antiangiogenic proteins such as sFlt1 can cause almost all complications that characterize human preeclampsia including hypertension, proteinuria, cerebral edema, hematologic abnormalities and fetal growth restriction.7, 9–11 In humans, angiogenic factor levels are altered in women with preeclampsia at diagnosis, as well as weeks prior to clinical onset.7, 9, 12–14 In prospective cohort studies, the ratio of circulating antiangiogenic and proangiogenic protein levels identifies women with early onset preeclampsia with very high sensitivity and specificity.15, 16
We hypothesized that elevated sFlt1/PlGF ratios at initial presentation would predict adverse outcomes in pregnant women with suspected preeclampsia, especially in a pre-specified group of patients presenting at less than 34 weeks gestation.
Methods
Study design
From July 2009 through October 2010, we studied women with singleton pregnancies who presented to the obstetric triage unit at the Beth Israel Deaconess Medical Center (BIDMC) in Boston, MA and were evaluated for possible preeclampsia. All participants evaluated were eligible to participate. The cohort represents a population of women from varied ethnic and socioeconomic backgrounds. These patients were either referred by their obstetric provider because of signs of preeclampsia or self-presented with symptoms of preeclampsia. Patients were included if the triage care provider deemed an evaluation of preeclampsia necessary. Indications for evaluation include: elevated blood pressure, proteinuria or any symptoms associated with preeclampsia, such as headache, visual symptoms, right upper quadrant pain or edema. Samples were collected within one hour of arrival to triage and stored at −80°C for analysis. The study was approved by the Beth Israel Deaconess Medical Center ethics committee, and all patients provided informed consent.
sFlt1 and PlGF assays
Automated assays for sFlt1 and PlGF were performed at clinical laboratory of Charite Hospital (Berlin, Germany) using the commercially available assays on Elecsys platform (Roche Diagnostics, Penzberg, Germany) as previously described.15, 17 These automated assays take approximately 20 minutes for the measurement of both the analytes. The inter-assay coefficient of variance for sFlt1 and PlGF immunoassays ranged from 2.6–3.0% and 2.0–2.4% respectively. The assay operators were blinded to the clinical information of the participants. The treating physicians were unaware of the test results of sFlt1, PlGF values.
Diagnosis and outcomes
Ascertainment of clinical diagnoses and adverse outcomes was based on information collected from the time of presentation through the subsequent two weeks. Women could be reenrolled in the study if they re-presented greater than 2 weeks after initial presentation. The diagnoses of preeclampsia, gestational hypertension, and chronic hypertension were based on modified ACOG criteria.3 Preeclampsia was defined as a blood pressure ≥140/90 mmHg on two occasions 2 hours to 2 weeks apart after 20 weeks of gestation and proteinuria of ≥ 300 mg/24 hour or urine P/C ratio of ≥ 0.3 after 20 weeks of gestation. Gestational Hypertension was defined as the presence of hypertension as defined above without proteinuria (urine levels of proteinuria below the accepted threshold for preeclampsia) and chronic hypertension was defined as the presence of hypertension prior to 20 weeks of gestation. Proteinuria on presentation was defined as urine dipstick with greater than or equal to 2+ protein, protein to creatinine ratio greater than or equal to 0.3, or 24 hour urine protein ≥ 300 mg/day (if available at the time of presentation). Adverse maternal outcomes were defined as the presence of hypertension (BP ≥140/90 mmHg on two occasions 2 hours to 2 weeks apart) plus one of the following: elevated aspartate aminotransferase (AST) or alanine aminotransferase (ALT) (≥ 80 U/L), Platelet count ≤100 ×109/L /uL, disseminated intravascular coagulation (DIC), abruption (clinical and/or pathological), pulmonary edema, cerebral hemorrhage, seizure (in a woman without underlying seizure disorder), acute renal failure (creatinine > 114.4 µmol/L), or maternal death.18 The adverse fetal/neonatal outcomes included iatrogenic delivery indicated for hypertensive complications of pregnancy as reported by the primary obstetrician, small for gestational age birth weight (≤10th percentile for gestational age), abnormal umbilical artery Doppler (absent or reverse flow), fetal death, and neonatal death.18 Diagnoses and adverse outcomes were adjudicated by two study staff prior to the availability of assay results.
Statistical analysis
Baseline characteristics of patients with and without adverse outcomes were compared using Wilcoxon rank sum test and chi-squared test where appropriate. The sFlt1/PlGF ratio (value of sFlt1 measured in pg/ml, divided by the value of PlGF measured in pg/ml) was used as a measure of circulating angiogenic imbalance, based on prior studies showing that this marker was most accurate in discriminating women with and without preeclampsia.15,16 As the distribution of sFlt1/PlGF ratios was skewed, we used the Wilcoxon rank sum test to compare the median sFlt1/PlGF ratios in participants who did and did not experience adverse outcomes. One way analysis of variance (ANOVA) with post-hoc Holm-Sidak testing was used to compare sFlt1/PlGF ratio (after natural log transformation) by diagnosis and type of adverse outcome. After dividing participants into tertiles based on sFlt1/PlGF ratio at presentation, we used single variable logistic regression to compare the risk of developing an adverse outcome in each tertile stratified by subgroup (normotensive and non-proteinuric). We repeated each of these analyses in women presenting less than 34 weeks. A post-hoc multivariable logistic regression model that included gestational age at presentation, sFlt1/PIGF tertile, and all possible interaction terms found a significant interaction between gestational age of presentation and sFlt1/PIGF tertile (p<0.001). Therefore, the decision to examine models separately by gestational age at presentation was not only clinically but statistically justified.
To determine the value of combinations of factors for the prediction of adverse outcomes, we created single variable and multivariable logistic regression models using predictors of adverse outcomes. These predictors included blood pressure, laboratory parameters, and demographic information, all available during evaluation in triage. We used receiver operating characteristic (ROC) analysis to determine the predictive value of combining factors that were independent predictors of adverse outcomes in the logistic regression models. To determine the clinical utility of the sFlt1/PlGF ratio in prediction of adverse outcomes, we used ROC analysis to determine a cutpoint of sFlt1/PlGF that would correctly classify the maximum number of participants. The sensitivity, specificity, positive, and negative predictive values for this cutpoint were calculated. Logistic regression models with ROC analysis were used to determine the predictive value of combining factors such as systolic blood pressure, proteinuria, ALT, uric acid, and sFlt1/PlGF ratio in predicting adverse outcomes. The models were adjusted for maternal age, parity, body mass index and smoking. Comparisons of areas under the curve (AUCs) were performed by using a contrast matrix to take differences of the areas under the empirical ROC curves.19
The Pearson product-moment correlation was used to assess the relationship between sFlt1/PlGF ratio and time elapsed between presentation and delivery (both natural log transformed). Single variable and multivariable Cox proportional hazards model were used to compare time to delivery in participants with sFlt1/PlGF ratio less than or greater than the cutpoint derived from ROC analysis and Kaplan-Meier curves were used to visualize these differences.
All P values were two-sided, and values <0.05 were considered statistically significant. All statistical analyses were performed with use of SAS (version 9.2).
Results
Subject characteristics
During the study period, there were 815 preeclampsia evaluations in the BIDMC obstetric triage unit. Overall, 616 evaluations were studied (75% of all evaluations, Supplementary Figure 1). Of these evaluations, 81 were repeat evaluations of women previously enrolled. One hundred seventy-six evaluations (28.6%) occurred at less than 34 weeks gestation. Subject characteristics at presentation to obstetric triage, diagnoses, and adverse outcomes are shown in Table 1. Adverse outcomes occurred in 43.5% of all patients (N=268) and 33.5% of participants presenting at less than 34 weeks (N=59). Baseline characteristics of women who did and did not experience subsequent adverse outcomes are shown in Table 2. The subject characteristics of patients who refused or excluded did not differ from patients included in the study with the exception of slightly lower BMI among patients not included in the study.
Table 1.
Characteristics of women presenting to obstetrical triage with suspected preeclampsia
| Variable | All Median (25th–75th centile) or No (%) |
Presenting at <34 Wks Median (25th–75th centile) or No (%) |
|
|---|---|---|---|
| N | 616 | 176 | |
| Baseline | |||
| Gestational Age (weeks) | 36.6 (33.3–38.0) | 30.9 (28.2–32.9) | |
| Age (years) | 32 (28–35) | 32 (27–35.5) | |
| Body Mass Index (kg/m2) | 32.7 (29.0–37.0) | 32.9 (29.2–38.2) | |
| Nulliparous | 263 (59.8%) | 99 (56.3%) | |
| Smoker | 52 (8.4%) | 15 (8.5%) | |
| Race | |||
| White/Caucasian | 307 (69.9%) | 98 (55.7%) | |
| Black/African American | 56 (12.8%) | 36 (20.5%) | |
| Asian/Pacific Islander | 33 (7.5%) | 11 (6.3%) | |
| Other | 43 (9.8%) | 31 (17.6%) | |
| Previous Preeclampsia | 47 (10.7%) | 36 (20.5%) | |
| Chronic Hypertension | 81 (18.4%) | 56 (31.8%) | |
| Preexisting Diabetes | 31 (7.1%) | 17 (9.7%) | |
| Presentation | |||
| Highest SBP in Triage (mmHg) | 137 (126–147) | 140 (129–150) | |
| Highest DBP in Triage (mmHg) | 87 (80–94) | 87 (77–97) | |
| Proteinuria | 120 (27.3%) | 63 (35.8%) | |
| ALT in Triage (U/L) | 15 (12–21) | 31.0 (64.1) | |
| Creatinine in Triage (µmol/L) | 53 (44–62) | 53 (44–62) | |
| Uric Acid in Triage (µmol/L) | 274 (232–333) | 262 (220–340) | |
| Platelet Count in Triage (× 109 per L) | 236 (194–280) | 253 (206–293) | |
| Two Weeks after Presentation | |||
| Any Hypertensive Disorder | 449 (72.9%) | 128 (72.7%) | |
| Chronic HTN | 98 (15.9%) | 43 (24.4%) | |
| Gestational HTN | 173 (28.1%) | 29 (16.5%) | |
| Preeclampsia | 178 (28.9%) | 56 (31.2%) | |
| Any Adverse Outcome | 268 (43.5%) | 59 (33.5%) | |
| HTN + Abnormal LFTs/Platelets | 25 (4.1%) | 15 (8.5%) | |
| HTN+DIC | 2 (0.3%) | 2 (1.1%) | |
| HTN + Abruption | 9 (1.5%) | 5 (2.8%) | |
| HTN + Pulmonary Oedema | 2 (0.3%) | 2 (1.1 %) | |
| HTN + Eclampsia | 1 (0.2%) | 1 (0.6%) | |
| Indicated Delivery | 262 (42.5%) | 57 (32.4%) | |
| FGR /Abnormal UA Doppler | 25 (4.1%) | 12 (6.8%) | |
| Fetal Death | 2 (0.3%) | 2 (1.1%) | |
| Neonatal Death | 2 (0.3%) | 2 (1.1%) | |
SBP= systolic blood pressure, DBP= diastolic blood pressure, ALT= alanine transaminase, HTN= hypertension, DIC= disseminated intravascular coagulation FGR= fetal growth restriction, UA Doppler= umbilical artery Doppler. Values were missing for body-mass index in 5 patients, alanine aminotranferase in 15 patients, serum creatinine in 12 patients, uric acid in 21 patients.
To convert creatinine to mg/dL- divide by 76.26. To convert uric acid to mg/dL- divide by 59.48.
Table 2.
Subject characteristics by adverse outcome
| No Adverse Outcome | Adverse Outcome | |||
|---|---|---|---|---|
| Median (25th–75th centile) or No (%) |
Median (25th–75th centile) or No (%) |
p | ||
| N | 348 (56.5%) | 268 (43.5%) | ||
| Gestational Age (weeks) | 35.7 (32.8–35.7) | 37.0 (34.6–38.2) | <0.001 | |
| Age (years) | 31.0 (28.0–35.0) | 32.0 (29.0–35.0) | 0.27 | |
| Body Mass Index (kg/m2) | 32.9 (29.4–37.0) | 32.3 (28.4–37.2) | 0.46 | |
| Nulliparous | 198 (56.9%) | 164 (61.2%) | 0.28 | |
| Smoker | 36 (10.3%) | 16 (6.0%) | 0.05 | |
| Race | 0.47 | |||
| White | 232 (67.7%) | 173 (64.8%) | ||
| Black | 48 (13.8%) | 44 (16.5%) | ||
| Asian / Pacific Islander | 22 (6.3%) | 22 (8.2%) | ||
| Unknown/Other | 46 (13.2%) | 28 (10.5%) | ||
| History of Preeclampsia | 46 (13.2%) | 37 (13.8%) | 0.83 | |
| History of Chronic Hypertension | 64 (18.4%) | 73 (27.2%) | 0.009 | |
| History of Diabetes | 23 (6.6%) | 25 (9.3%) | 0.21 | |
| History of Renal Disease | 14 (4.0%) | 8 (3.0%) | 0.49 | |
| Highest SBP in Triage (mmHg) | 132 (124–141) | 145 (136–154) | <0.001 | |
| Highest DBP in Triage (mmHg) | 85 (77–90) | 92 (84–99) | <0.001 | |
| Proteinuria in Triage | 53 (15.2%) | 130 (48.5%) | <0.001 | |
| ALT in Triage (U/L) | 15 (12–21) | 16 (12–23) | 0.029 | |
| Creatinine >53 µmol/L* | 53.5% | 68.7% | <0.001 | |
| Uric Acid in Triage (µmol/L) | 259 (220–309) | 303 (256–369) | <0.001 | |
| Platelet Count in Triage (× 109 per L) | 248 (205–289) | 219 (187–260) | <0.001 | |
GA=Gestational age, SBP= systolic blood pressure, DBP= diastolic blood pressure, ALT= alanine transaminase. Values were missing for body-mass index in 5 patients, alanine aminotranferase in 15 patients, serum creatinine in 12 patients, uric acid in 21 patients. P<0.05 is considered signficant.
Because the median (25th–75th centile) ranges appear similar despite significant difference in the distribution of creatinine values in the two groups, we report the percentage of creatinine values greater than the median value in each group.
To convert creatinine to mg/dL- divide by 76.26. To convert uric acid to mg/dL- divide by 59.48.
sFlt1/PlGF ratio and subsequent clinical outcomes
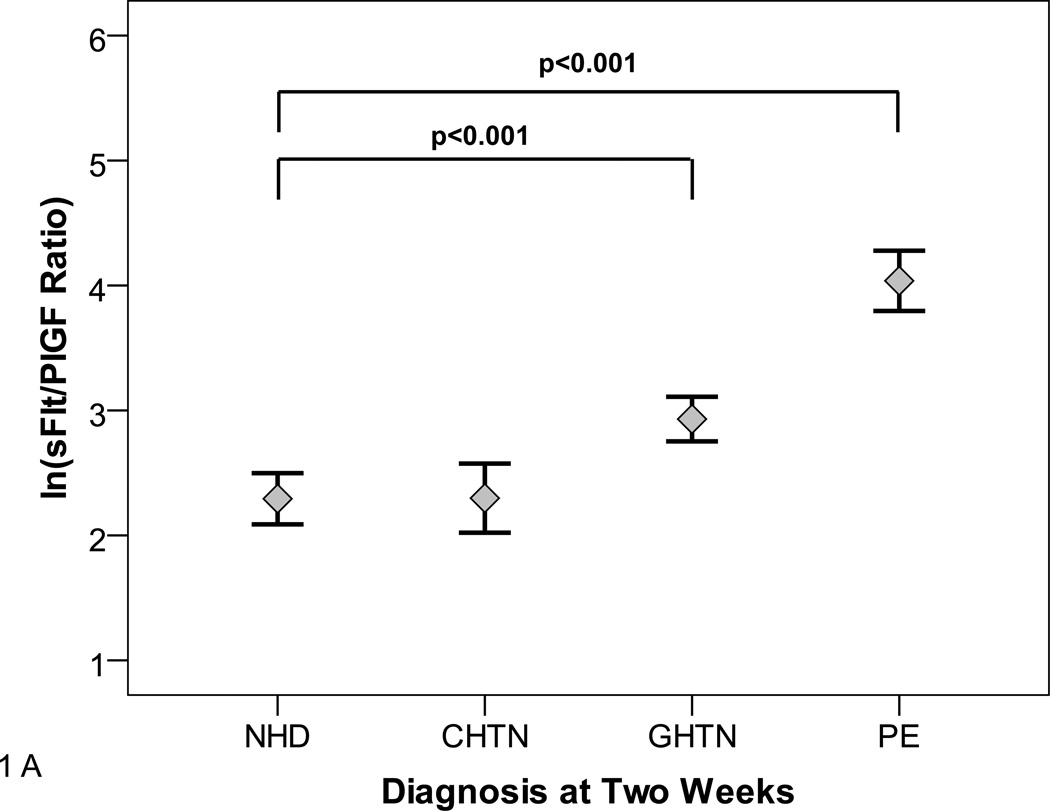
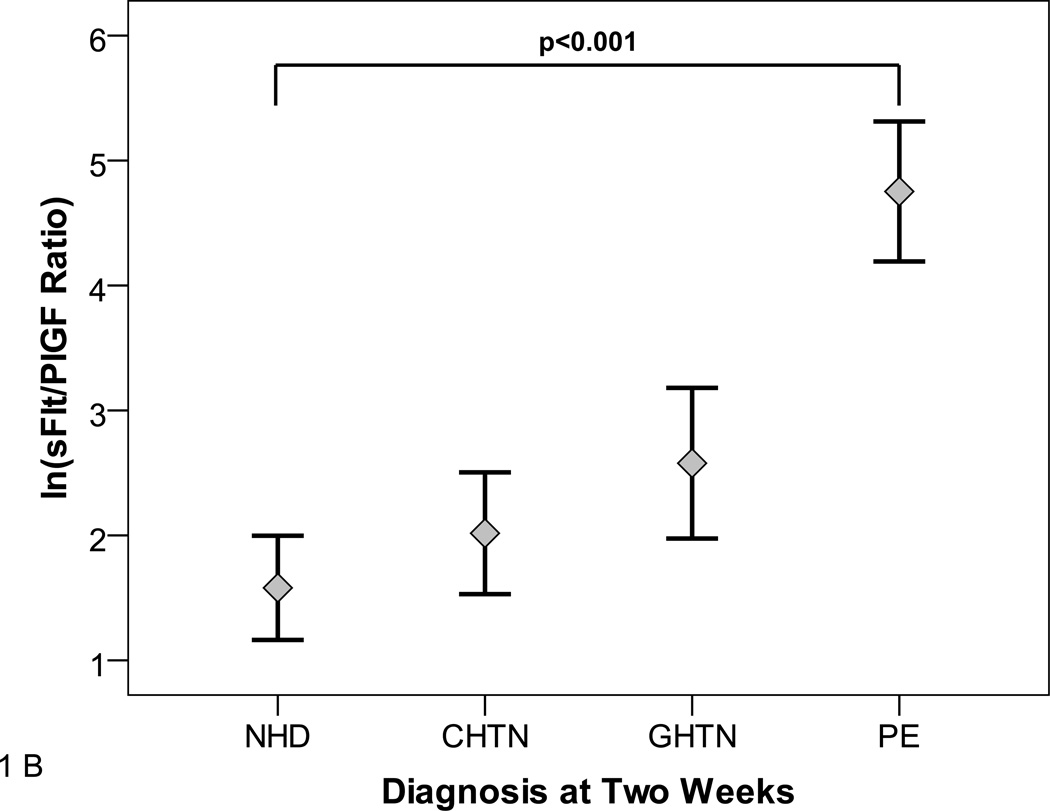
As reported in previous studies,7, 16, 20 the sFlt1/PlGF ratio was associated with the clinical diagnosis of preeclampsia. Participants with gestational hypertension had moderately elevated sFlt1/PlGF while participants with preeclampsia had markedly elevated sFlt1/PlGF ratio compared with participants who had no hypertensive disorder (Figure 1A). Similarly, in participants presenting at less than 34 weeks gestation, preeclampsia was associated with dramatically elevated sFlt1/PlGF levels (Figure 1B). The individual values of sFlt1, PlGF and sFlt1/PlGF ratio are shown in Supplementary Table 1.
Figure 1. sFlt1/PlGF Ratio at Presentation.
Panels A and B show the distribution of natural log transformed (ln) sFlt1/PlGF ratios at initial presentation by subsequent diagnosis. Diagnoses were ascertained 2 weeks after presentation according to ACOG criteria. NHD=No hypertensive disorder, CHTN=chronic hypertension, GHTN=gestational hypertension PE=Preeclampsia.
Panel A shows distribution among all participants. Panel B shows distribution among participants presenting at <34 weeks gestation.
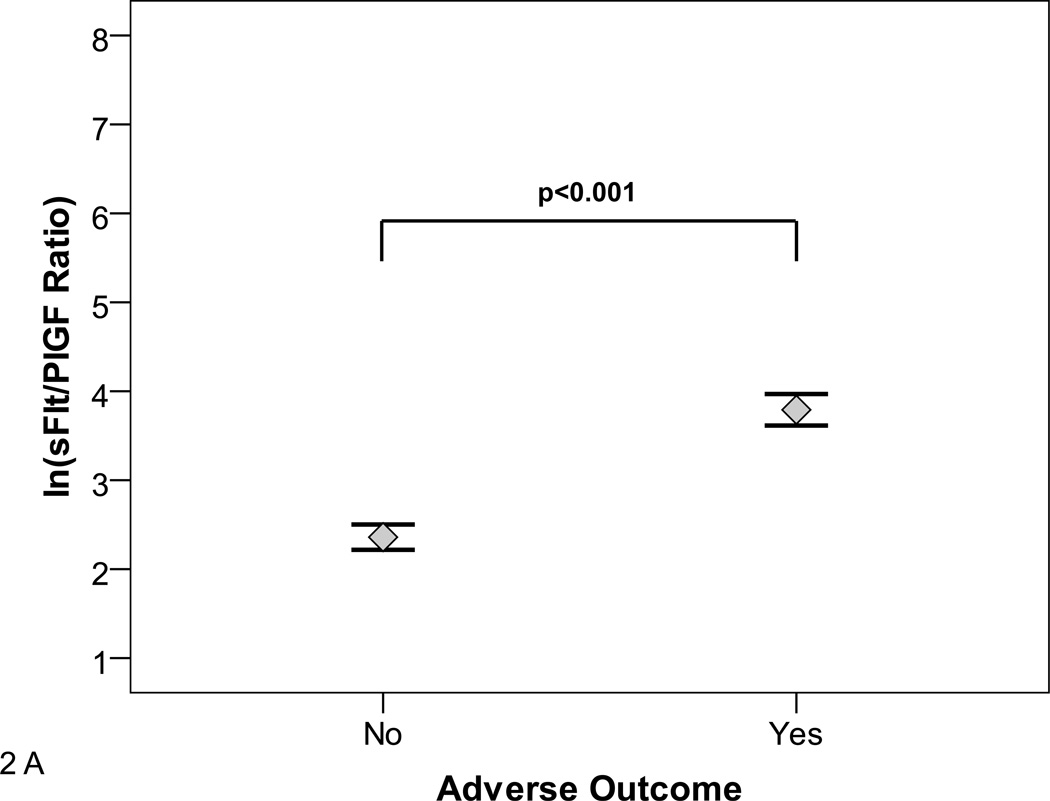
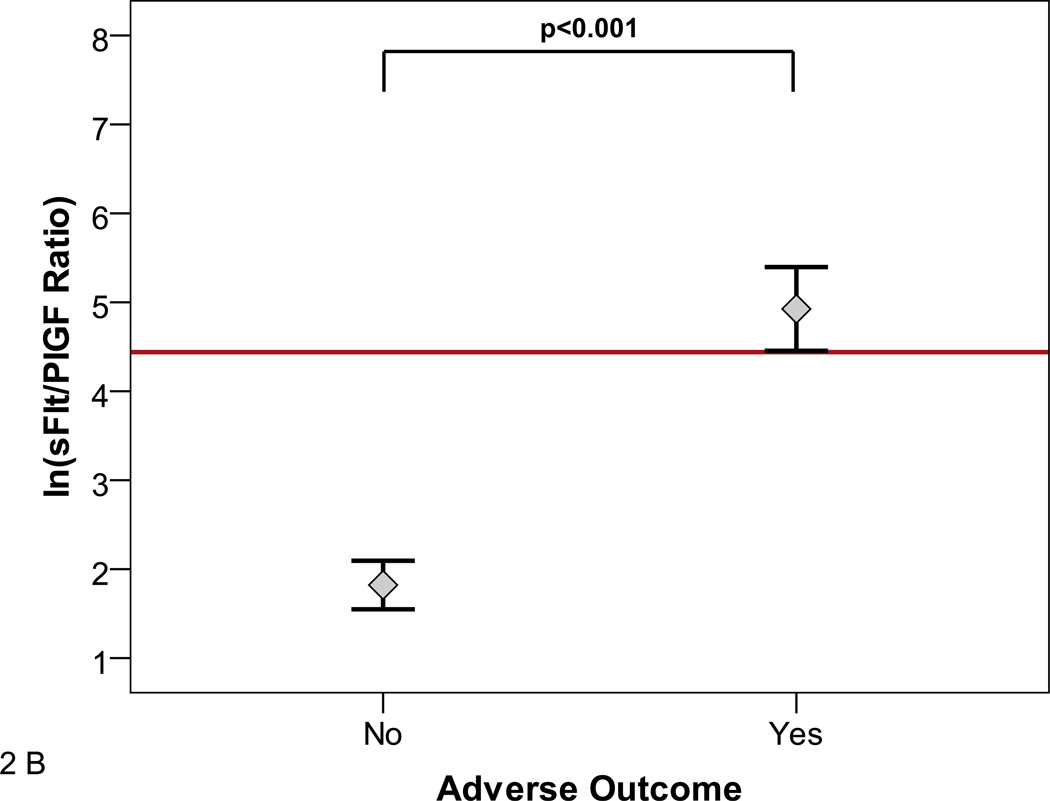
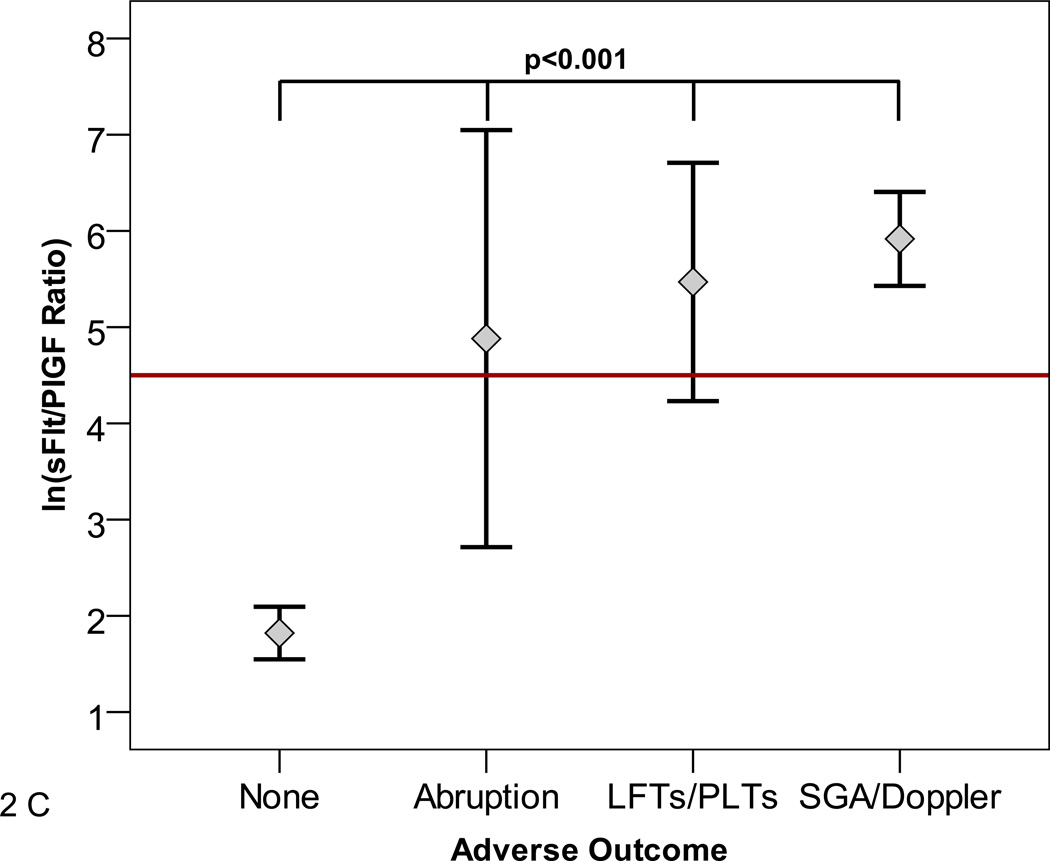
The sFlt1/PlGF ratio at presentation was associated with subsequent adverse outcomes (Figure 2A and B). The median [25th–75th centile] sFlt1/PlGF ratio in women who had any adverse outcome (N=268) versus no adverse outcome (N=348) was 47.0 [15.5–112.2] versus 10.8 [4.1–28.6], (p<0.0001). In women presenting at less than 34 weeks, the median [25th–75th centile] sFlt1/PlGF ratio in women who experienced any adverse outcome (N=59) versus no adverse outcome (N=117) was 226.6 [50.4–547.3] versus 4.5 [2.0–13.5], p<0.0001. Although we were limited by sample size to study the various adverse outcomes individually, evaluation of the relatively common adverse outcomes occurring in women presenting at less than 34 weeks gestation (placental abruption, elevated liver enzymes/low platelets, or small for gestational age birth weight/abnormal uterine artery doppler) were also associated with elevated sFlt1/PlGF ratios (Figure 2C).
Figure 2. sFlt1/PlGF Ratio and Adverse outcomes.
The distribution of natural log transformed (ln) sFlt1/PlGF ratios at initial presentation by subsequent adverse outcomes is shown. Adverse outcomes were ascertained 2 weeks after presentation.
Panel A shows distribution in all participants.
Panel B includes only participants presenting at less than 34 weeks gestation.
Panel C shows individual adverse outcomes in women presenting at less than 34 weeks gestation. Placental abruption, elevated liver enzymes and/or low platelets (LFTs/PLTs), and small for gestational age birth weight and/or absent/reversed umbilical artery Doppler (SGA/Doppler) were associated with elevated ln sFlt1/PlGF ratio. Red reference line denotes an sFlt1/PlGF ratio=85. Participants with more than one adverse outcome (N=5) were assigned to the abruption group or the SGA/Doppler group. Reassignment of these participants to other groups had no effect on the significance of the results.
When participants were divided into tertiles based on sFlt1/PlGF ratio, the risk of subsequent adverse outcome was elevated in women with sFlt1/PlGF ratios in the third compared to those in the first tertile (Table 3). Although the incidence of adverse outcome was lower in women who were non-proteinuric at presentation (31.9% vs 71.0% in women with proteinuria, p<0.001) and in women who were normotensive at presentation (26.1% vs. 58.0% in hypertensive women, p<0.001), the risk of adverse outcome by tertile was similar irrespective of hypertension or proteinuria (Table 3). In women presenting at less than 34 weeks, the relationship between sFlt1/PlGF tertile and adverse outcomes was even stronger and similarly did not differ based on presence of hypertension or proteinuria (Table 3). There were no changes to the results when the model was restricted to only the first triage visit amongst the participants (Supplementary Table 2).
Table 3.
sFlt1/PlGF tertile and risk of adverse outcome in all participants and those presenting at less than 34 weeks gestation
| All | Tertile 1 (n=205, S/P≤9.7) |
Tertile 2 (N=206, 9.7<S/P<39.2) |
Tertile 3 (n=205, S/P≥39.2) |
|||||
|---|---|---|---|---|---|---|---|---|
| N | Adverse Outcomes |
Adverse Outcomes |
OR (95% CI) | Adverse Outcomes |
OR (95% CI) | Adverse Outcomes |
OR (95% CI) | |
| All Participants | 616 | 268 (43.5%) | 43 (21.0%) | Ref | 78 (37.9%) | 2.3 (1.5, 3.6) | 147 (71.7%) | 9.5 (6.1, 15.0) |
| Normotensive | 280 | 73 (26.1%) | 18 (14.8%) | Ref | 28 (26.7%) | 2.1 (1.1, 4.1) | 27 (50.9%) | 6.0 (2.9, 12.5) |
| Non-Proteinuric | 183 | 138 (31.9%) | 28 (16.4%) | Ref | 52 (32.1%) | 2.4 (1.4, 4.1) | 58 (58.0%) | 7.1 (4.0, 12.4) |
| Presenting at <34 Weeks | Tertile 1 (n=58, S/P≤4.2) | Tertile 2 (N=59, 4.2<S/P<40.5) | Tertile 3 (n=59, S/P≥40.5) | |||||
| N | Adverse Outcomes | Adverse Outcomes | OR (95% CI) | Adverse Outcomes | OR (95% CI) | Adverse Outcomes | OR (95% CI) | |
| All Participants | 176 | 59 (33.5%) | 4 (6.9%) | Ref | 9 (15.3%) | 2.4 (0.7, 8.4) | 46 (78.0%) | 47.8 (14.6, 156.6) |
| Normotensive | 76 | 11 (14.5%) | 2 (5.3%) | Ref | 2 (7.4%) | 1.4 (0.2, 10.9) | 7 (63.6%) | 31.5 (4.8, 206.6) |
| Non-Proteinuric | 113 | 18 (15.9%) | 0 (0.0%) | Ref* | 5 (10.2%) | Ref* | 13 (61.9%) | 28.3 (8.0, 99.7) |
Adverse outcomes were considered if they occurred within 2 weeks of presentation. S/P= sFlt1/PlGF ratio. Sample sizes and percents for each tertile represent the number of adverse outcomes and the percent of adverse outcomes from all those classified in a tertile.
In non-proteinuric participants presenting at less than 34 weeks, the reference odds ratio is the incidence of adverse outcome in tertiles 1 and 2 combined.
Predictive accuracy of sFlt1/PlGF
In single variable logistic regression models including women presenting at less than 34 weeks, greater sFlt1/PlGF, systolic blood pressure, proteinuria, uric acid, creatinine, and lower platelet count were associated with higher risk of adverse outcomes (p<0.001 for sFlt1/PlGF, SBP, proteinuria, and uric acid; p=0.008 for creatinine; p=0.006 for platelet count). Other subject characteristics such as maternal age, gestational age, body mass index, smoking, and history of chronic hypertension were not associated with adverse outcomes in women presenting at less than 34 weeks. In multivariable logistic regression models controlling for maternal age, parity, body mass index and smoking, the factors that remained significant predictors of adverse outcomes were sFlt1/PlGF, systolic blood pressure, proteinuria, uric acid, creatinine, and lower platelet count (p<0.001 for sFlt1/PlGF, SBP, proteinuria, and uric acid; p=0.013 for creatinine; p=0.011 for platelet count).
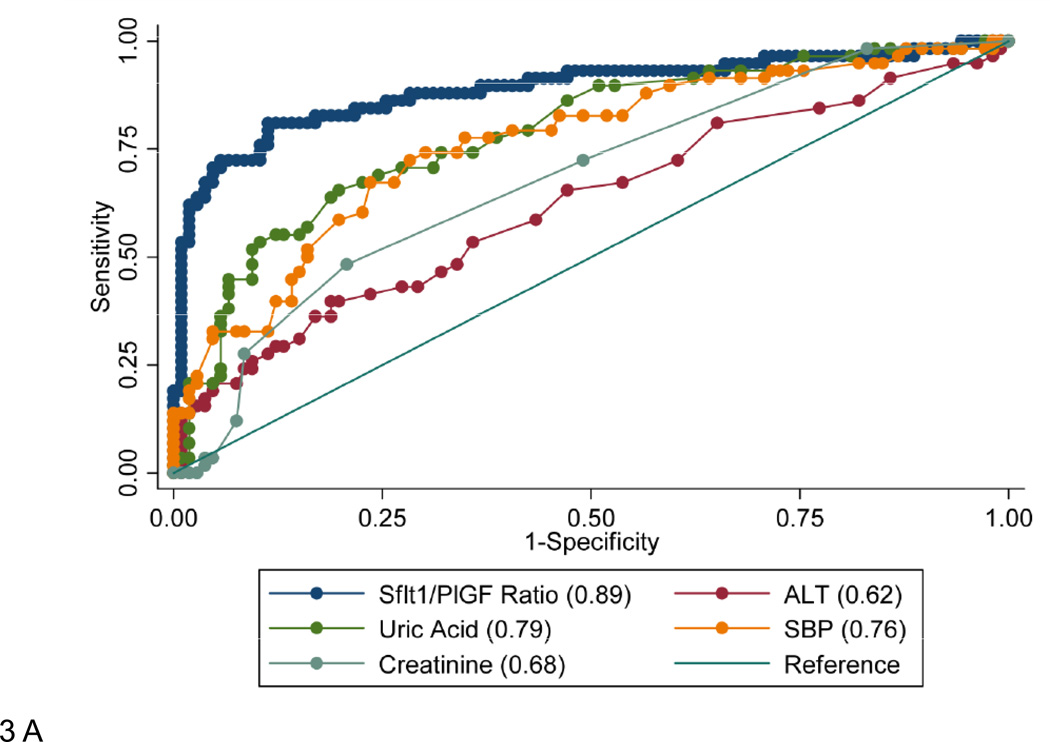
In women presenting at less than 34 weeks gestation, the sFlt1/PlGF ratio had superior performance to other parameters measured at the time of presentation including systolic blood pressure, uric acid, ALT, and creatinine (as defined by greater area under the receiver-operating-characteristic curve [AUC], Figure 3A). In patients presenting at less than 34 weeks, the combination of hypertension, proteinuria, and sFlt1/PlGF ratio was superior to hypertension and proteinuria alone for the prediction of adverse outcomes (Table 4). Uric acid, ALT, creatinine, and platelet count were not significant predictors of adverse outcome when systolic blood pressure, proteinuria, and sFlt1/PlGF were included in the model (p=0.59 for uric acid, p=0.78 for ALT, p=0.74 for creatinine, p=0.78 for platelet count). The AUC was similar when the model was restricted to only the first triage visit amongst the participants (Supplementary Figure 2). Exclusion of women with adverse outcomes at presentation (5%) did not substantially alter the prediction model.
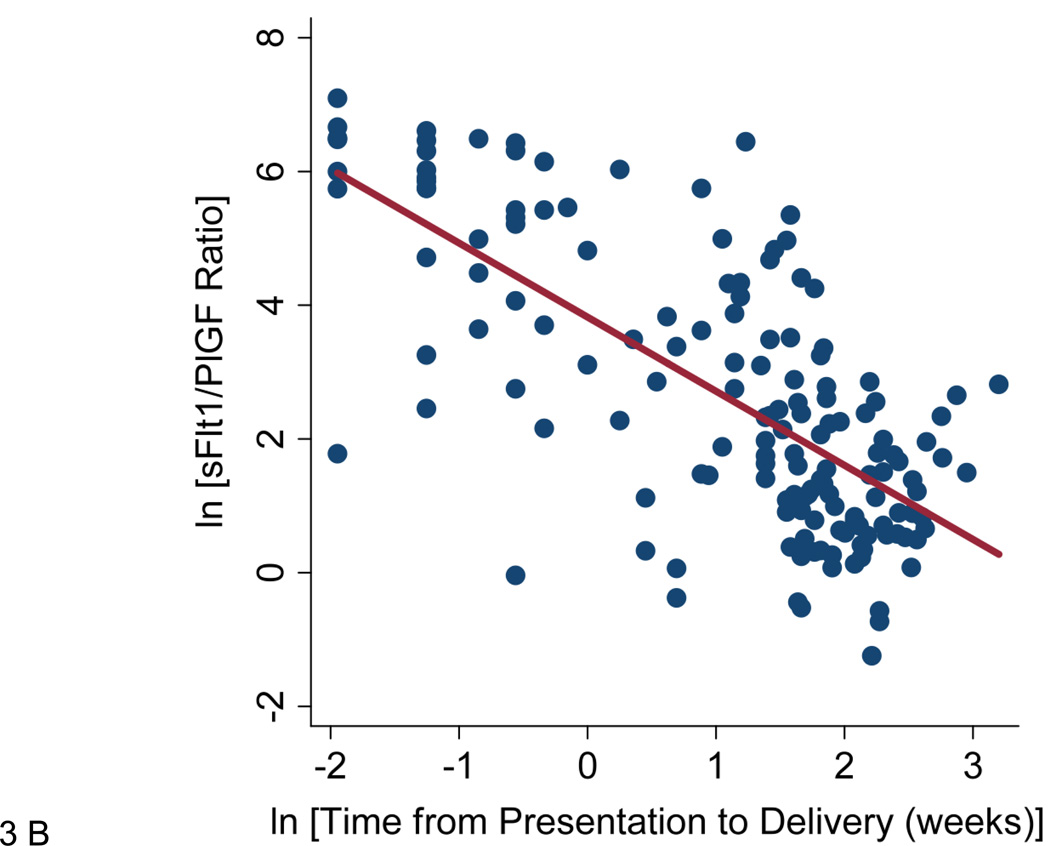
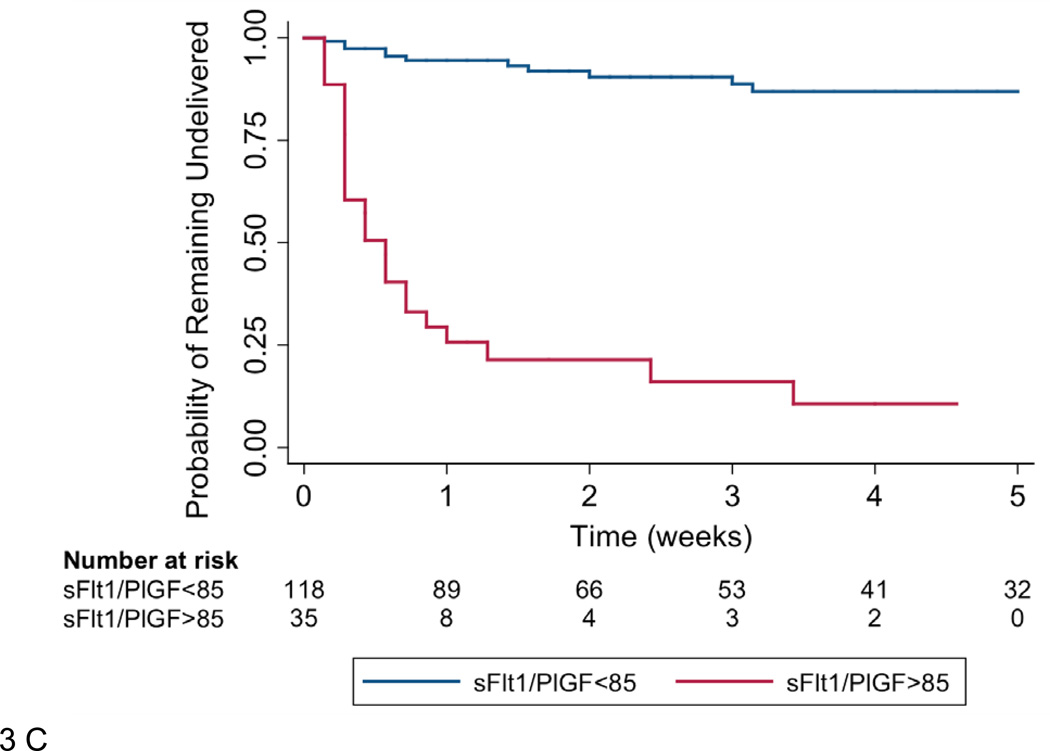
Figure 3. Predictive accuracy and correlation with duration of pregnancy of the sFlt1/PlGF Ratio.
Panel A shows receiver operating characteristic curves for prediction of adverse outcomes using the sFlt1/PlGF ratio, ALT (alanine aminotransferase), uric acid, SBP (highest systolic blood pressure measured in triage) and creatinine, in patients presenting less than 34 weeks gestation. All laboratory values were measured in blood collected at the time of presentation. The AUC is given for each potential predictor in the legend. All AUC's were significantly different from that of the sFlt1/PlGF ratio alone (p<0.01).
Panel B shows the time from presentation to delivery plotted against the sFlt1/PlGF ratio at presentation in participants presenting at less than 34 weeks gestation. r=−0.71, p<0.0001. Panel C shows the Kaplan-Meier survival function for time to delivery in participants presenting less than 34 weeks gestation. Patients were censored at delivery or at 34 weeks gestation.
Table 4.
Area under the receiver operating characteristic curves for each combination of possible predictors
| Predictors |
Single variable AUC (95% CI) |
Single variable p-value |
Multivariable AUC (95% CI) ** |
Multivariable p-value |
|---|---|---|---|---|
| SBP +Proteinuria | 0.84 (0.78, 0.90) | --- | 0.84 (0.78, 0.90) | --- |
| SBP +Proteinuria+UA | 0.86 (0.81, 0.92) | 0.24 | 0.86 (0.80, 0.92) | 0.22 |
| SBP +Proteinuria+S/P | 0.93 (0.89, 0.97) | 0.001* | 0.92 (0.88, 0.96) | 0.001* |
| SBP +Proteinuria + | 0.92 (0.88, 0.96) | 0.003* | 0.92 (0.88, 0.96) | 0.002* |
| S/P+UA |
Significant at <0.05
Controlling for maternal age, parity, body mass index, and smoking
P-values are for the comparison of each set of predictors against the combination of systolic blood pressure and proteinuria alone.
SBP= highest systolic blood pressure in triage, UA=uric acid, S/P=sFlt1/PlGF ratio.
ROC analysis suggested that an sFlt1/PlGF cutpoint of 85 would allow the maximum number of participants to be correctly classified with regard to adverse outcomes (87%). In women presenting at less than 34 weeks, a cutpoint of 85 gave a sensitivity of 72.9% and specificity of 94.0%. Of the 126 women (71.5% of total women) who had sFlt1/PlGF ratio less than 85, 16 experienced an adverse outcome (Supplementary Table 3). This corresponded to a negative predictive value of 87.3% and negative likelihood ratio of 0.29. Ten of the women with low sFlt1/PlGF ratio who experienced adverse outcomes had complicating conditions other than preeclampsia to which their adverse outcomes could have been attributed (Supplementary Table 3). In five of the remaining six women, the adverse outcome recorded was indicated delivery, and the indication for delivery was headache. Of the 50 women with sFlt1/PlGF ratio greater than or equal to 85, 7 did not experience an adverse outcome within 2 weeks. This corresponded to a positive predictive value of 86.0% and positive likelihood ratio of 12.2. Interestingly, these 7 patients experienced adverse outcome after 3 weeks (Supplementary Table 4).
When we included participants presenting both before and after 34 weeks gestation in the ROC analysis, the sFlt1/PlGF ratio had similar accuracy to the highest systolic blood pressure measured in triage in predicting adverse outcomes (AUC=0.76 for sFlt1/PlGF vs. 0.74 for systolic blood pressure, p=0.44). In this group, the sFlt1/PlGF ratio remained more accurate than other laboratory values in predicting adverse outcomes occurring within two weeks (AUC=0.76 versus uric acid [AUC=0.67, p=0.0005], serum ALT [AUC=0.56, p<0.0001], or serum creatinine [AUC=0.60, p<0.0001]). When we excluded indicated delivery from the composite outcome measure among all participants, the AUC for prediction of adverse outcomes by the sFlt1/PlGF ratio for substantially improved from 0.76 (0.72–0.80) to 0.85 (0.79–0.91).
sFlt1/PlGF and remaining duration of pregnancy
The sFlt1/PlGF ratio was inversely correlated with the time elapsed between presentation and delivery (natural log transformed, r=−0.51, p<0.0001) in all participants. This relationship was strengthened with elimination of women presenting at 34 weeks gestation or greater (r=−0.71, p<0.0001, Figure 3B). Overall, among women presenting at less than 34 weeks gestation, delivery occurred within two weeks of presentation in 86.0% of women with sFlt1/PlGF ratio ≥ 85 compared with 15.8% of women with sFlt1/PlGF ratio <85 (p<0.001). Time to event analysis confirmed a relationship between sFlt1/PlGF ratio and time to delivery at less than 34 weeks (HR 15.2 95% CI 8.1–28.7, Figure 3C). This relationship was slightly attenuated but remained significant after adjustment for gestational age at presentation, highest systolic blood pressure measured in triage, and proteinuria at presentation (HR 9.4 95% CI 4.7–18.7).
Discussion
This study focused on 3rd trimester women evaluated for suspected preeclampsia. The data indicates that a plasma sFlt1/PlGF ratio >85 at presentation was associated with adverse outcomes and imminent delivery within 2 weeks of presentation. Moreover, in women presenting before gestational week 34, the ratio of sFlt1/PlGF performed considerably better than other laboratory tests and clinical signs currently used to predict such outcomes. These angiogenic factor assays performed particularly well in women presenting atypically with relatively normal blood pressures or with no proteinuria. Notably, the sFlt1/PlGF ratio at presentation was inversely correlated with remaining duration of pregnancy. These results suggest that the sFlt1/PlGF ratio may be a useful tool for triage of women undergoing initial evaluation for suspected preeclampsia.
These data have important clinical implications. Currently, the risk stratification of patients with preeclampsia is dependent on classification of women into three major categories: no preeclampsia, mild preeclampsia, or severe preeclampsia. Diagnosis of preeclampsia frequently requires admission, as 24–48 hours may be needed to evaluate serial blood pressures, laboratory values, and to collect a 24 hour urine specimen for quantification of protein.3 This information is used to guide the decision to pursue expectant management, especially when patients present at <34 weeks. However, previous studies have suggested that these criteria are inaccurate at predicting maternal and fetal complications.5, 21, 22 Consistent with this, we found fair predictive value for laboratory values and signs generally considered indicative of severe preeclampsia. In contrast, the sFlt1/PlGF ratio had high predictive value in women at less than 34 weeks gestation and particularly useful among participants who presented atypically.
Accurate risk stratification of women with suspected preeclampsia has the potential to reduce unnecessary admissions, inappropriate discharges and the considerable morbidity associated with iatrogenic preterm delivery. For example, women with non-specific symptoms (for example, headache) may not necessitate immediate delivery if the sFlt1/PlGF is low and other concerning signs are not present. Conversely, women presenting with atypical signs and symptoms, such as those without hypertension and/or proteinuria, may not be currently classified as high risk for adverse outcomes, but may in fact be at considerable risk if the sFlt1/PlGF ratio is high. Identification of these high risk women at initial presentation may provide opportunity for expedited transfer to higher level medical facilities, administration of betamethasone, and appropriate counseling for anticipated preterm delivery. Furthermore, the sFlt1/PlGF ratio may be useful as a surrogate endpoint in ongoing clinical trials of therapy for preeclampsia.23, 24 Moreover, the addition of a test which accurately predicts subsequent adverse outcomes to initial preeclampsia evaluation has the potential to decrease costs associated with multiple outpatient evaluations and inpatient admissions in women with suspected preeclampsia. Although the data presented here provide compelling evidence that sFlt1/PlGF testing may be a useful adjunct to preeclampsia evaluation, this requires further testing in randomized trials.
The sFlt1/PlGF ratio did not identify women at risk of adverse outcomes related to conditions such as acute fatty liver of pregnancy, longstanding oligohydraminos, or chronic hypertension, suggesting that these markers are quite specific for preeclampsia. The predictive accuracy of the sFlt1/PlGF ratio was best in women presenting at gestational ages less than 34 weeks. This could be because obstetric care providers have a lower threshold for delivering women after 34 weeks;25, 26 thus, women presenting at late gestational ages with any suspicion of preeclampsia will likely be delivered. When indicated delivery was eliminated from the composite outcome measure, the sFlt1/PlGF ratio performed significantly better in the full cohort of women (data not shown). It is also possible that because sFlt1/PlGF ratios tend to increase slightly after 36 weeks in all women,20 the sFlt1/PlGF may not have the same discriminatory power at late gestational ages. Despite these considerations, because of the substantial risk of neonatal morbidity in women presenting at less than 34 weeks gestation, accurate risk prediction has the greatest potential for benefit in this subgroup of patients.27
We found that the AUC was highest for the sFlt1/PlGF ratio compared to individual biomarkers alone (see supplementary table 1A and 1B). The ratio has previously been shown to be highly correlated with preeclampsia diagnosis15, 16 and supports prior findings which suggest an angiogenic imbalance exists in women with preeclampsia with elevated levels of an antiangiogenic factor (sFlt1) and low levels of a proangiogenic factor (PlGF).7, 9, 12 While previous studies have shown that sFlt1 and/or PlGF levels may be useful in the diagnosis of preeclampsia,15, 16 we were unable to locate any studies that examined the association between levels of these proteins and subsequent adverse maternal and perinatal outcomes. Our data therefore extends the findings of prior studies showing that higher sFlt1/PlGF ratio is associated with the diagnosis of preeclampsia and more severe disease.7, 9, 13, 28 Previous studies examining methods for risk stratification of women with hypertensive disorders of pregnancy have generally shown these methods to have fair accuracy.5, 29 A recent prospective study used clinically available information to predict the risk of adverse outcomes in preeclampsia with accuracy comparable to that described in the present study.30 Several important differences exist between that study and our own; these include a different study population, alternative adverse outcomes and time period during which these outcomes were assessed.
Preeclampsia is a multisystem disease disorder, though its characteristic lesion, glomerular endotheliosis occurs in the kidney. However, clinicians currently diagnose preeclampsia using clinical parameters: the appearance of de novo 3rd trimester hypertension and proteinuria. As demonstrated in the literature during a period when renal biopsies were performed, the clinical diagnosis was incorrect in as much as 15–20% of nulliparas and over 30% of multiparas.31 More recently data from animal models have demonstrated that glomerular endotheliosis is a consequence of neutralization of VEGF signaling by sFlt1 in the glomerulus.9, 32, 33 These findings suggest the possibility that abnormally high sFlt1 levels may serve as a surrogate for glomerular endotheliosis, thus delineating those women in whom diagnosis is most certain and that higher levels of sFlt1 result in more severe endothelial abnormalities. Although this is speculative, the data here demonstrating the accuracy of the angiogenic factors to predict adverse outcomes supports this hypothesis.
Some limitations of our study merit consideration. This study was observational, and current practice limited the ability to fully test the accuracy of the sFlt1/PlGF ratio for risk stratification. Demonstrative of this is the fact that several women with low sFlt1/PlGF ratios were classified as having adverse outcomes (indicated delivery) even though they were delivered for a potentially benign reason: headache. It is unclear whether headache in these women was related to impending eclampsia or more common non-preeclampsia related causes. A larger study with the exclusion of indicated delivery from the composite outcome measure might have partially addressed this limitation, but the fortunate rarity of devastating outcomes (such as eclampsia and death) in the developed world will continue to limit the ability of an observational study to test the true accuracy of the sFlt1/PlGF ratio. Because of the limited sample size, we were unable to examine in detail the various adverse outcomes individually. Also, since this is an observational study, we cannot evaluate whether the alterations in these biomarkers are the cause or effect of preeclampsia.
In summary, the sFlt1/PlGF ratio is strongly associated with adverse outcomes and imminent delivery in women presenting with signs and/or symptoms of preeclampsia in this pilot study. The use of the sFlt1/PlGF ratio for risk stratification of women undergoing preeclampsia evaluation in the obstetric triage unit has the potential to reduce both morbidity and health care costs. The availability of a method, such as this, to quickly and accurately assess risk for preeclampsia-associated adverse outcomes at initial presentation could aid in management of patients with suspected preeclampsia. Future studies should validate our findings in large multi-center cohorts in different populations to determine the impact of clinical decisions based on results of sFlt1/PlGF testing on health outcomes, and assess the cost-effectiveness of management strategies based on sFlt1/PlGF testing.
Supplementary Material
Acknowledgments
S.R. is supported by Harvard Diversity and Community Partnership Faculty Fellowship Award. C.E.P was supported by Howard Hughes Medical Institute Medical Research Training Fellowship (2009–10). S.A.K is an investigator of the Howard Hughes Medical Institute. We thank Dawn McCullough, RN for patient recruitment and data collection.
Funding
Harvard Diversity and Community Partnership Faculty Fellowship and Howard Hughes Medical Institute.
Footnotes
Conflict of Interest Disclosures
Dr. Verlohren is a consultant to Roche Diagnostics. Dr. Thadhani is a co-inventor on patents related to the prediction of preeclampsia that has been out licensed to diagnostic companies and has financial interest in Aggamin LLC. Dr. Karumanchi is a co-inventor of multiple patents related to angiogenic proteins for the diagnosis and therapy of preeclampsia. These patents have been licensed to multiple companies. Dr. Karumanchi reports having served as a consultant to Roche and Beckman Coulter and has financial interest in Aggamin LLC. The remaining authors report no conflicts.
References
- 1.Wallis AB, Saftlas AF, Hsia J, Atrash HK. Secular trends in the rates of preeclampsia, eclampsia, and gestational hypertension, united states, 1987–2004. Am J Hypertens. 2008;21:521–526. doi: 10.1038/ajh.2008.20. [DOI] [PubMed] [Google Scholar]
- 2.Friedman SA, Schiff E, Kao L, Sibai BM. Neonatal outcome after preterm delivery for preeclampsia. Am J Obstet Gynecol. 1995;172:1785–1788. doi: 10.1016/0002-9378(95)91412-9. discussion 1788–1792. [DOI] [PubMed] [Google Scholar]
- 3.Acog practice bulletin. Diagnosis and management of preeclampsia and eclampsia. Number 33, january 2002. Obstet Gynecol. 2002;99:159–167. doi: 10.1016/s0029-7844(01)01747-1. [DOI] [PubMed] [Google Scholar]
- 4.Sibai BM, Stella CL. Diagnosis and management of atypical preeclampsia-eclampsia. Am J Obstet Gynecol. 2009;200:481, e481–e487. doi: 10.1016/j.ajog.2008.07.048. [DOI] [PubMed] [Google Scholar]
- 5.Ganzevoort W, Rep A, de Vries JI, Bonsel GJ, Wolf H. Prediction of maternal complications and adverse infant outcome at admission for temporizing management of early-onset severe hypertensive disorders of pregnancy. Am J Obstet Gynecol. 2006;195:495–503. doi: 10.1016/j.ajog.2006.02.012. [DOI] [PubMed] [Google Scholar]
- 6.Stamilio DM, Sehdev HM, Morgan MA, Propert K, Macones GA. Can antenatal clinical and biochemical markers predict the development of severe preeclampsia? Am J Obstet Gynecol. 2000;182:589–594. doi: 10.1067/mob.2000.103890. [DOI] [PubMed] [Google Scholar]
- 7.Levine RJ, Maynard SE, Qian C, Lim KH, England LJ, Yu KF, Schisterman EF, Thadhani R, Sachs BP, Epstein FH, Sibai BM, Sukhatme VP, Karumanchi SA. Circulating angiogenic factors and the risk of preeclampsia. N Engl J Med. 2004;350:672–683. doi: 10.1056/NEJMoa031884. [DOI] [PubMed] [Google Scholar]
- 8.Kendall RL, Thomas KA. Inhibition of vascular endothelial cell growth factor activity by an endogenously encoded soluble receptor. Proc Natl Acad Sci U S A. 1993;90:10705–10709. doi: 10.1073/pnas.90.22.10705. [DOI] [PMC free article] [PubMed] [Google Scholar]
- 9.Maynard SE, Min JY, Merchan J, Lim KH, Li J, Mondal S, Libermann TA, Morgan JP, Sellke FW, Stillman IE, Epstein FH, Sukhatme VP, Karumanchi SA. Excess placental soluble fms-like tyrosine kinase 1 (sflt1) may contribute to endothelial dysfunction, hypertension, and proteinuria in preeclampsia. J Clin Invest. 2003;111:649–658. doi: 10.1172/JCI17189. [DOI] [PMC free article] [PubMed] [Google Scholar]
- 10.Maharaj AS, Walshe TE, Saint-Geniez M, Venkatesha S, Maldonado AE, Himes NC, Matharu KS, Karumanchi SA, D'Amore PA. Vegf and tgf-beta are required for the maintenance of the choroid plexus and ependyma. J Exp Med. 2008;205:491–501. doi: 10.1084/jem.20072041. [DOI] [PMC free article] [PubMed] [Google Scholar]
- 11.Lu F, Longo M, Tamayo E, Maner W, Al-Hendy A, Anderson GD, Hankins GD, Saade GR. The effect of over-expression of sflt-1 on blood pressure and the occurrence of other manifestations of preeclampsia in unrestrained conscious pregnant mice. Am J Obstet Gynecol. 2007;196:396, e391–e397. doi: 10.1016/j.ajog.2006.12.024. discussion 396 e397. [DOI] [PubMed] [Google Scholar]
- 12.Levine RJ, Lam C, Qian C, Yu KF, Maynard SE, Sachs BP, Sibai BM, Epstein FH, Romero R, Thadhani R, Karumanchi SA. Soluble endoglin and other circulating antiangiogenic factors in preeclampsia. N Engl J Med. 2006;355:992–1005. doi: 10.1056/NEJMoa055352. [DOI] [PubMed] [Google Scholar]
- 13.Kusanovic JP, Romero R, Chaiworapongsa T, Erez O, Mittal P, Vaisbuch E, Mazaki-Tovi S, Gotsch F, Edwin SS, Gomez R, Yeo L, Conde-Agudelo A, Hassan SS. A prospective cohort study of the value of maternal plasma concentrations of angiogenic and anti-angiogenic factors in early pregnancy and midtrimester in the identification of patients destined to develop preeclampsia. J Matern Fetal Neonatal Med. 2009;22:1021–1038. doi: 10.3109/14767050902994754. [DOI] [PMC free article] [PubMed] [Google Scholar]
- 14.Noori M, Donald AE, Angelakopoulou A, Hingorani AD, Williams DJ. Prospective study of placental angiogenic factors and maternal vascular function before and after preeclampsia and gestational hypertension. Circulation. 2010;122:478–487. doi: 10.1161/CIRCULATIONAHA.109.895458. [DOI] [PubMed] [Google Scholar]
- 15.Verlohren S, Galindo A, Schlembach D, Zeisler H, Herraiz I, Moertl MG, Pape J, Dudenhausen JW, Denk B, Stepan H. An automated method for the determination of the sflt-1/pigf ratio in the assessment of preeclampsia. Am J Obstet Gynecol. 2010;202 doi: 10.1016/j.ajog.2009.09.016. 161 e161-161 e111. [DOI] [PubMed] [Google Scholar]
- 16.Sunderji S, Gaziano E, Wothe D, Rogers LC, Sibai B, Karumanchi SA, Hodges-Savola C. Automated assays for svegf r1 and plgf as an aid in the diagnosis of preterm preeclampsia: A prospective clinical study. Am J Obstet Gynecol. 2010;202:40, e41–e47. doi: 10.1016/j.ajog.2009.07.025. [DOI] [PubMed] [Google Scholar]
- 17.E. Schneider AGaRHea. Technical performance of the first fully automated assays for soluble fms-like tyrosine kinase 1 and human placental growth factor. Z Geburtshilfe Neonatol. 2009;213:69. [Google Scholar]
- 18.Roberts JM, Myatt L, Spong CY, Thom EA, Hauth JC, Leveno KJ, Pearson GD, Wapner RJ, Varner MW, Thorp JM, Jr, Mercer BM, Peaceman AM, Ramin SM, Carpenter MW, Samuels P, Sciscione A, Harper M, Smith WJ, Saade G, Sorokin Y, Anderson GB. Vitamins c and e to prevent complications of pregnancy-associated hypertension. N Engl J Med. 2010;362:1282–1291. doi: 10.1056/NEJMoa0908056. [DOI] [PMC free article] [PubMed] [Google Scholar]
- 19.DeLong ER, DeLong DM, Clarke-Pearson DL. Comparing the areas under two or more correlated receiver operating characteristic curves: A nonparametric approach. Biometrics. 1988;44:837–845. [PubMed] [Google Scholar]
- 20.Romero R, Nien JK, Espinoza J, Todem D, Fu W, Chung H, Kusanovic JP, Gotsch F, Erez O, Mazaki-Tovi S, Gomez R, Edwin S, Chaiworapongsa T, Levine RJ, Karumanchi SA. A longitudinal study of angiogenic (placental growth factor) and anti-angiogenic (soluble endoglin and soluble vascular endothelial growth factor receptor-1) factors in normal pregnancy and patients destined to develop preeclampsia and deliver a small for gestational age neonate. J Matern Fetal Neonatal Med. 2008;21:9–23. doi: 10.1080/14767050701830480. [DOI] [PMC free article] [PubMed] [Google Scholar]
- 21.Menzies J, Magee LA, Macnab YC, Ansermino JM, Li J, Douglas MJ, Gruslin A, Kyle P, Lee SK, Moore MP, Moutquin JM, Smith GN, Walker JJ, Walley KR, Russell JA, von Dadelszen P. Current chs and nhbpep criteria for severe preeclampsia do not uniformly predict adverse maternal or perinatal outcomes. Hypertens Pregnancy. 2007;26:447–462. doi: 10.1080/10641950701521742. [DOI] [PubMed] [Google Scholar]
- 22.Meler E, Figueras F, Mula R, Crispi F, Benassar M, Gomez O, Gratacos E. Prognostic role of uterine artery doppler in patients with preeclampsia. Fetal Diagn Ther. 2010;27:8–13. doi: 10.1159/000258048. [DOI] [PubMed] [Google Scholar]
- 23.Ahmed A. New insights into the etiology of preeclampsia: Identification of key elusive factors for the vascular complications. Thromb Res. 2011;127(Suppl 3):S72–S75. doi: 10.1016/S0049-3848(11)70020-2. [DOI] [PubMed] [Google Scholar]
- 24.Thadhani R, Kisner T, Hagmann H, Bossung V, Noack S, Schaarschmidt W, Jank A, Kribs A, Cornely OA, Kreyssig C, Hemphill L, Rigby AC, Khedkar S, Lindner TH, Mallmann P, Stepan H, Karumanchi SA, Benzing T. Pilot study of extracorporeal removal of soluble fms-like tyrosine kinase 1 in preeclampsia. Circulation. 2011;124:940–950. doi: 10.1161/CIRCULATIONAHA.111.034793. [DOI] [PubMed] [Google Scholar]
- 25.Odendaal HJ, Pattinson RC, Bam R, Grove D, Kotze TJ. Aggressive or expectant management for patients with severe preeclampsia between 28–34 weeks'gestation: A randomized controlled trial. Obstet Gynecol. 1990;76:1070–1075. [PubMed] [Google Scholar]
- 26.Sibai BM, Mercer BM, Schiff E, Friedman SA. Aggressive versus expectant management of severe preeclampsia at 28 to 32 weeks'gestation: A randomized controlled trial. Am J Obstet Gynecol. 1994;171:818–822. doi: 10.1016/0002-9378(94)90104-x. [DOI] [PubMed] [Google Scholar]
- 27.Mercer BM. Preterm premature rupture of the membranes. Obstet Gynecol. 2003;101:178–193. doi: 10.1016/s0029-7844(02)02366-9. [DOI] [PubMed] [Google Scholar]
- 28.Chaiworapongsa T, Romero R, Kim YM, Kim GJ, Kim MR, Espinoza J, Bujold E, Goncalves L, Gomez R, Edwin S, Mazor M. Plasma soluble vascular endothelial growth factor receptor-1 concentration is elevated prior to the clinical diagnosis of pre-eclampsia. J Matern Fetal Neonatal Med. 2005;17:3–18. doi: 10.1080/14767050400028816. [DOI] [PubMed] [Google Scholar]
- 29.Williams KP, Galerneau F. The role of serum uric acid as a prognostic indicator of the severity of maternal and fetal complications in hypertensive pregnancies. J Obstet Gynaecol Can. 2002;24:628–632. doi: 10.1016/s1701-2163(16)30193-1. [DOI] [PubMed] [Google Scholar]
- 30.von Dadelszen P, Payne B, Li J, Ansermino JM, Broughton Pipkin F, Cote AM, Douglas MJ, Gruslin A, Hutcheon JA, Joseph KS, Kyle PM, Lee T, Loughna P, Menzies JM, Merialdi M, Millman AL, Moore MP, Moutquin JM, Ouellet AB, Smith GN, Walker JJ, Walley KR, Walters BN, Widmer M, Lee SK, Russell JA, Magee LA. Prediction of adverse maternal outcomes in pre-eclampsia: Development and validation of the fullpiers model. Lancet. 2011;377:219–227. doi: 10.1016/S0140-6736(10)61351-7. [DOI] [PubMed] [Google Scholar]
- 31.Fisher KA, Luger A, Spargo BH, Lindheimer MD. Hypertension in pregnancy: Clinical-pathological correlations and remote prognosis. Medicine (Baltimore) 1981;60:267–276. [PubMed] [Google Scholar]
- 32.Eremina V, Sood M, Haigh J, Nagy A, Lajoie G, Ferrara N, Gerber HP, Kikkawa Y, Miner JH, Quaggin SE. Glomerular-specific alterations of vegf-a expression lead to distinct congenital and acquired renal diseases. J Clin Invest. 2003;111:707–716. doi: 10.1172/JCI17423. [DOI] [PMC free article] [PubMed] [Google Scholar]
- 33.Li Z, Zhang Y, Ying Ma J, Kapoun AM, Shao Q, Kerr I, Lam A, O'Young G, Sannajust F, Stathis P, Schreiner G, Karumanchi SA, Protter AA, Pollitt NS. Recombinant vascular endothelial growth factor 121 attenuates hypertension and improves kidney damage in a rat model of preeclampsia. Hypertension. 2007;50:686–692. doi: 10.1161/HYPERTENSIONAHA.107.092098. [DOI] [PubMed] [Google Scholar]
Associated Data
This section collects any data citations, data availability statements, or supplementary materials included in this article.


