Abstract
Adaptive optics is implemented in a harmonic generation microscope using a wavefront sensorless correction scheme. Both the second- and third-harmonic intensity signals are used as the optimization metric. Aberration correction is performed to compensate both system- and specimen-induced aberrations by using an efficient optimization routine based upon Zernike polynomial modes. Images of live mouse embryos show an improved signal level and resolution.
Harmonic generation microscopy (HGM) was proposed as a method for label-free imaging of biological specimens [1]. Using the nonlinear optical properties of the tissue, third- and second-harmonic generation (THG, SHG) are produced at the focus of a short-pulsed laser beam, revealing cellular structure with three-dimensional resolution. Implementations of combined SHG and THG imaging have often used excitation wavelengths around 1200 nm [2-4]. This choice was influenced by the relatively low absorption of this wavelength by biological tissues and the convenient placement of the SHG and THG around 600 and 400 nm, respectively, permitting the use of standard optics and detectors. A disadvantage of this excitation wavelength is that high-numerical-aperture objectives required for such imaging are not typically specified for this wavelength. One should therefore expect reduced performance both in terms of transmission and aberrations. Furthermore, aberrations are introduced by the specimens themselves, particularly by thick specimens to which HGM is often applied [5]. As the harmonic generation is nonlinearly dependent on the excitation intensity, these factors could have a significant effect on the imaging performance.
One application area where HGM has shown promise is in imaging for developmental biology [3,2,4]. In early-stage mouse embryos, THG images reveal cellular structure and sub-cellular features, whereas SHG has shown mitotic spindles and the zona pellucida. It has also been shown that large aberrations are induced when focussing through embryos [5]. When combined with the system aberrations arising from the nonoptimal objective lenses, the effects can cause a significant reduction in signal level and resolution. Adaptive optics has been used to compensate for aberrations in various microscopes [6]. In this Letter we demonstrate the use of adaptive optics for the correction of system and specimen-induced aberrations in the HGM of live mouse embryos.
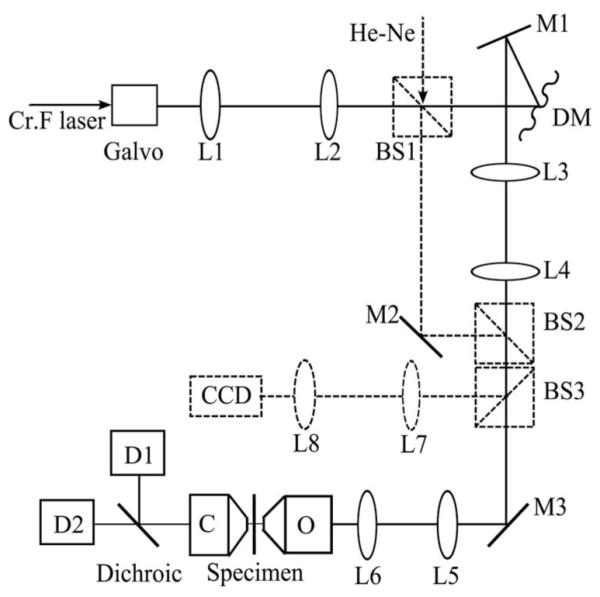
A schematic of the adaptive microscope is shown in Fig. 1. The chromium forsterite laser (Mavericks, Del Mar Photonics) emits 65 fs pulses at a repetition rate of 100 MHz, center wavelength λ=1235 nm and output power around 200 mW. The expanded beam was steered by two-axis galvanometer mirrors that are imaged onto a deformable membrane mirror (MIRAO 52-e, Imagine Eyes). The deformable mirror (DM) was imaged onto the pupil plane of the microscope objective. The illumination power in the focus was approximately 30 mW. The harmonic emission was collected in trans-configuration by an oil immersion condenser (NA=1.4). The SHG and THG were separated by a dichroic filter and were detected simultaneously by using two photomultiplier tubes. Specimen scanning in the axial (z) direction was enabled by a piezo actuator attached to the sample stage. The objective lens (Olympus UApo/340 water immersion, 40×, NA=1.15) was chosen because of its high transmission (60% at λ=1235 nm) compared with other objectives that were tested. For in situ DM characterization, three beam-splitter cubes were inserted into the optical pathway to form a Mach–Zehnder interferometer (dashed outline in Fig. 1) using a heliumneon laser (λ=633 nm).
Fig. 1.

Schematic of the microscope. Lx, lens; BSx, beam splitter; Mx, mirror; DM, deformable mirror; O, objective; C, condenser; Dx, detector.
The aberration correction procedure involved the sequential correction of Zernike polynomial modes through the maximization of a metric defined as the total image intensity, i.e., Σx,yI(x,y), where I represents the image. A similar approach has been employed in other adaptive microscopes and provides rapid correction with a small number of metric measurements [7,8]. The metric value I0 was measured for the initial aberrated image. An amplitude b of a chosen mode was added to the DM, and the corresponding image metric I+ was measured. An amount −b was then added, and the value I− was measured. The correction aberration amplitude was then calculated through a parabolic maximization as a=b(I+−I−)/(2I+−4I0+2I−). This was repeated for each mode of interest. For this demonstration, we chose to correct 18 low-order Zernike modes (excluding piston, tip, tilt, and defocus). As the I0 measurement is common to all modes, the correction of n modes requires 2n+1 measurements. Hence, the total number of scans per correction cycle was 37.
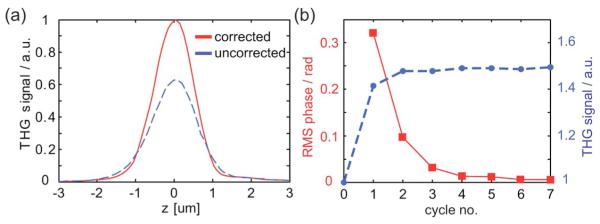
System aberrations were corrected by optimizing the THG from the rear glass/air interface of a coverglass of 170 μm thickness. The objective adjustment collar was set to the corresponding glass thickness. Prior to the correction, the DM surface was flat up to an rms value of less than λ/12 at λ=633 nm. The plots in Fig. 2(a) show the THG axial response before and after five repeated correction cycles. The peak intensity increased by almost 50%, and the FWHM decreased by 14% to 1.22 μm, compared with a calculated value of 1.15 μm for an unaberrated system. The procedure was repeated to check whether further improvement could be obtained. The signal rapidly converged on a maximum, which shows that for this particular specimen Zernike modes have a mostly independent effect on the THG signal. Figure 2(b) shows the signal improvement achieved with each correction cycle (blue dashed curve), together with the accordingly retrieved phase aberration. The total correction aberration had an amplitude of 0.37 rad rms at λ=1235 nm. This procedure could be repeated before imaging each specimen, for example, to mitigate the effects of any variations in the coverslip thickness.
Fig. 2.
(Color online) Correction of system aberrations. (a) THG axial response at a glass/air interface before (blue dashed line) and after correction. (b) THG signal (blue dashed line) and incremental retrieved phase aberration for subsequently applied correction cycles.
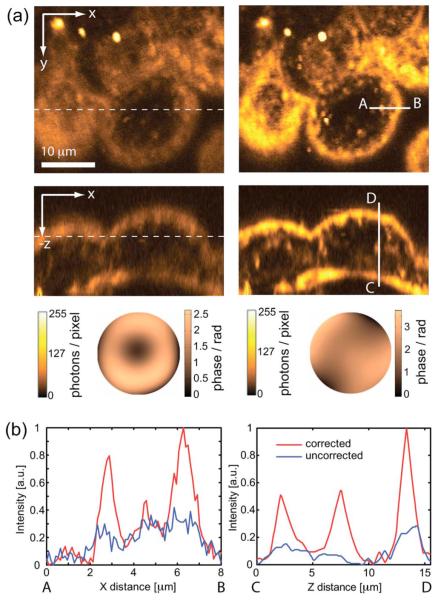
In another experiment, aberrations induced by mouse embryo specimens were corrected. Figure 3 shows frames from a three-dimensional image stack of an embryonic day 5.5 stage mouse embryo. The cover glass in the culture dish had a nominal maximum thickness of 130 μm, which corresponded to the objective correction collar’s minimum setting. First, the system aberrations were compensated by the procedure previously described, resulting in the correction phase of amplitude 0.58 rad rms. This consisted mainly of spherical aberration, probably due to incomplete coverglass compensation in the objective lens. A THG image stack covering 40 μm×40 μm ×20 μm within the embryo was acquired from a region approximately 90 μm deep in the sample [Fig. 3(a), left]. There was no significant SHG from this portion of the embryo. One cycle of the correction procedure was performed at the x-y section shown in the figure. The correction aberration amplitude was 0.67 rad rms at λ=1235 nm. The image stack was reacquired with the phase correction applied. The result is shown in Fig. 3(a) right. Cell boundaries and organelles are clearly visible. The total signal from the corrected x-y section increased by 54%. A second correction cycle, performed to verify the initial correction, showed no significant improvement. Fig. 3(b) shows intensity profiles, as indicated by the solid lines in (a), along the x and z directions both before and after correction of the specimen aberrations. Aberration correction has improved both signal and resolution. It can be seen that the increase in brightness of small features is more significant than the increase in background signal.
Fig. 3.
(Color online) (a) THG images of a 5.5 day old live mouse embryo with correction of only system aberrations (left) and after additional correction of specimen-induced aberrations (right). The dashed lines show where the xy and xz planes intersect. The corresponding correction phase functions are also shown. (b) Intensity profiles along the solid lines A-B and C-D as drawn in (a).
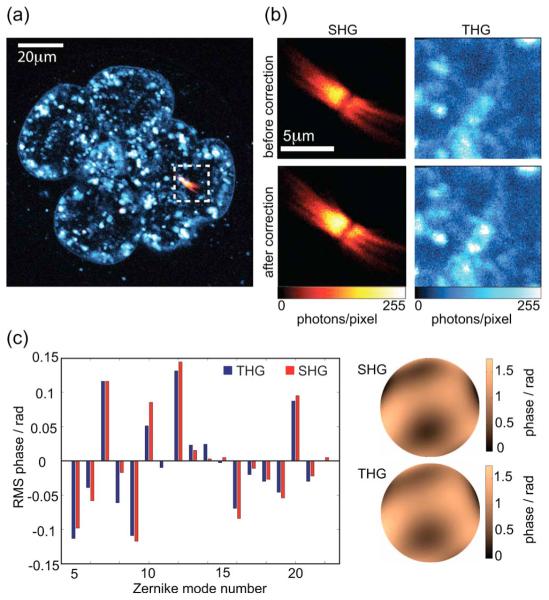
Both SHG and THG can be used separately as the optimization metric. Figure 4 shows images from a live embryonic day 2.5 stage mouse embryo. A strong THG signal is observed from cytoplasmic structures (possibly lipid vesicles); SHG is seen from mitotic spindles in one of the cells at a 45 μm depth. We performed SHG-based correction using an x-y image containing the spindle and the THG-based correction to a plane in close vicinity, where sufficient THG could be observed. Two cycles were performed for each correction procedure. As expected from the smaller imaging depth, the aberrations had smaller amplitude than in the 5.5 day old embryo. The corresponding Zernike coefficients, shown in the bar chart, are similar, which is expected as both SHG and THG channels are affected by the same aberrations. This shows that THG and SHG signals can both be used independently for the correction procedure. After correction, the total signal increased by 21% and 9% for SHG and THG, respectively. This difference in improvement is attributed to the different specimen structures. Preliminary studies show that the effect of aberrations on the image intensity varies, such that the intensity from fine structures is reduced more than that from larger features.
Fig. 4.
(Color online) Equivalence of correction using SHG and THG signals. (a) Overview of the 2.5 day old embryo showing SHG (solid red) and THG. (b) Sections used for the SHG- and THG-based corrections. The sections are located in close vicinity. Upper image pair, before correction; lower image pair, after correction. (c) Zernike coefficients and phase functions retrieved by both correction procedures.
Aberration correction leads to more efficient imaging and could permit the use of lower illumination power for the same image signal-to-noise ratio. This has important consequences for imaging of live specimens in HGM, where the illumination dose can affect long-term viability. In this Letter, we have shown that both system and specimen-induced aberrations have detrimental effects on the imaging properties of HGM. Adaptive optics have been used to mitigate these effects and restore the signal level and resolution of these microscopes. In these experiments THG and SHG signals have proved to be a suitable metric for aberration correction, where improved resolution corresponds to higher intensity. It is possible that for certain objects this relationship between resolution and intensity is different. For example, when several interfaces are near the focus, a maximized THG signal does not necessarily correspond to minimum aberrations. In such situations, other metrics such as image sharpness or the use of spatial averaging could be incorporated.
Acknowledgments
Support from the following grants is acknowledged: Biotechnology and Biological Science Research Council (BBE0049461), Engineering and Physical Sciences Research Council (EP/E055818/1), Austrian Science Fund (J2826-N20).
Footnotes
OCIS codes: 180.0180, 180.4315, 110.1080, 170.3880, 180.6900, 190.4160.
References
- 1.Yelin D, Silberberg Y. Opt. Express. 1999;5:169. doi: 10.1364/oe.5.000169. [DOI] [PubMed] [Google Scholar]
- 2.Chu SW, Chen SY, Tsai TH, Liu TM, Lin CY, Tsai HJ, Sun CK. Opt. Express. 2003;11:3093. doi: 10.1364/oe.11.003093. [DOI] [PubMed] [Google Scholar]
- 3.Débarre D, Supatto W, Farge E, Moulia B, Schanne-Klein MC, Beaurepaire E. Opt. Lett. 2004;29:2881. doi: 10.1364/ol.29.002881. [DOI] [PubMed] [Google Scholar]
- 4.Hsieh CS, Chen SU, Lee YW, Yang YS, Sun CK. Opt. Express. 2008;16:11574. [PubMed] [Google Scholar]
- 5.Schwertner M, Booth MJ, Wilson T. Opt. Express. 2004;12:6540. doi: 10.1364/opex.12.006540. [DOI] [PubMed] [Google Scholar]
- 6.Booth MJ. Philos. Trans. R. Soc. London, Ser. A. 2007;365:2829. doi: 10.1098/rsta.2007.0013. [DOI] [PubMed] [Google Scholar]
- 7.Débarre D, Booth MJ, Wilson T. Opt. Express. 2007;15:8176. doi: 10.1364/oe.15.008176. [DOI] [PubMed] [Google Scholar]
- 8.Débarre D, Botcherby EJ, Booth MJ, Wilson T. Opt. Express. 2008;16:9290. doi: 10.1364/oe.16.009290. [DOI] [PubMed] [Google Scholar]


