

Abstract
A broad structural landscape often needs to be characterized in order to fully understand how regulatory RNAs perform their biological functions at the atomic level. We present a protocol for visualizing thermally accessible RNA conformations at atomic-resolution and with timescales extending up to milliseconds. The protocol combines molecular dynamics (MD) simulations with experimental residual dipolar couplings (RDCs) measured in partially aligned 13C/15N isotopically enriched elongated RNA samples. The structural ensembles generated in this manner provide insights into RNA dynamics and its role in functionally important transitions.
Keywords: RNA dynamics, adaptive recognition, collective motions, non-coding RNA, movies
1. Introduction
The lifetime of many non-coding RNAs feature several conformational transitions that serve a variety of functions[1-5]. Conformational transitions can guide folding pathways during RNA co-transcriptional folding; enable sensing and signaling events that regulate gene expression in response to environmental changes; allow ribozymes to carry out multi-step catalytic reactions; and allow complex ribonucleoproteins to assemble in a hierarchical manner. The characterization of a broad structural landscape – rather than a single conformation – will often be required to fully understand how regulatory RNAs perform their functions at the atomic level.
There is growing evidence that conformers that are transiently and dynamically sampled in solution play an important role directing RNA structural transitions[1, 2]. Characterizing the thermally accessible ensemble of RNA conformations at atomic-resolution is a challenge that cannot be met by any one technique. For example, while NMR spectroscopy can be used to characterize dynamics over a broad range of timescales with site-specific resolution[6-8], the underlying motions cannot be constructed based purely on NMR data because the number of measurements that can be made typically pale in number in comparison to the total number of parameters needed to fully describe the dynamics. Molecular Dynamics (MD) simulations provide an all-atom description of dynamics; however, forces fields remain to be thoroughly validated particularly for nucleic acids and simulation timescales remain limited to ∼100 ns[9, 10].
Due to their spatio-temporal complementarity, the limitations inherent to NMR and MD could in principle be overcome by combining the two techniques; MD can fill the shortage in NMR data and NMR used to validate force fields and extend the MD conformational sampling to longer timescales. While such combined NMR/MD approaches have successfully been used in studies of protein dynamics[11-14], application to RNA has proven difficult. This is largely because unlike globular proteins, overall motions in highly flexible RNAs can be strongly coupled to internal motions making it difficult, if not impossible, to predict NMR data based on an MD trajectory[15-18].
We recently introduced a domain-elongation strategy for decoupling internal and overall motions in RNA[19, 20]. This makes it possible to compute NMR observables from a given MD trajectory, and thus to unite and bridge the two techniques[21]. We describe here such an application aimed at constructing atomic-resolution RNA structural ensembles[21].
2. Description of Method
2.2 Interpretation of RDCs measured in elongated RNA (E-RNA)
RDCs arise due to incomplete averaging of the dipolar interaction in partially aligned molecules[22-24]. An expression (in Hz) for the dipolar coupling (Dij) between two directly bonded spin ½ nuclei (i and j) is given by (Figure 1),
Figure 1.

Measurement RDCs in partially aligned molecules. (A) Residual dipolar couplings between spins i and j provide long-range constraints on the average orientation (θ) of the inter-nuclear bond vector relative to the applied magnetic field (Bo). (B) Measurement of residual dipolar couplings (D) as new contributions to the splittings of resonances (J) observed upon partial molecular alignment.
| (1) |
where μ0 is the magnetic permittivity of vacuum, h is Planck's constant, rij is the inter-nuclear distance between the spins, and γ is the gyromagnetic ratio. The angular term in Equation (1) is a function of the angle θ between the inter-nuclear vector and the applied magnetic field (Figure 1 A). The angular bracket denotes a time average over all angles sampled by the inter-nuclear vector due to both overall motions and internal motions occurring at timescales shorter than the inverse of the dipolar interaction (<ms). An effective bond length, rij, eff, subsumes the effects of distance averaging.
Motional averaging will generally reduce the value of the angular term and thus the magnitude of observed dipolar couplings (which can be on the order of kHz for non-reorienting directly bonded spins). When overall tumbling is random, the angular term averages to zero, and dipolar couplings are not observed under solution conditions. However, if a degree of alignment can be imparted on the solute of interest, the angular term will no longer average to zero. The greater the degree of alignment the greater the value of the angular term and magnitude of observed dipolar couplings. As is the case for through bond scalar couplings (J), through space dipolar couplings (D) effectively increase or decrease the average magnetic field at a given nucleus, resulting in splitting of resonances. Dipolar couplings are therefore often measured as new contributions to scalar couplings (J) that are observed under conditions of molecular alignment (J+D) (Figure 1B).
Use of RDCs in constructing RNA structural ensembles requires the ability to predict RDCs for a given proposed structural ensemble in which conformers interconvert at timescales shorter than the inverse of the dipolar interaction. This task is considerably simplified when one can (i) assume that internal motions are not correlated to overall alignment (the so-called “decoupling approximation”) and (ii) determine the overall order or alignment tensor governing partial alignment of the molecule. Studies have shown that the decoupling approximation does not always hold for highly flexible and extended nucleic acid structures[15-18, 25, 26]. In particular, changes in the relative orientation of helical domains can result in large changes in the overall RNA shape, which can in turn alter overall alignment of the molecule relative to the magnetic field (Figure 2A). The ensuing breakdown in the decoupling approximation can make it difficult if not impossible to compute RDCs for a proposed structural ensemble.
Figure 2.
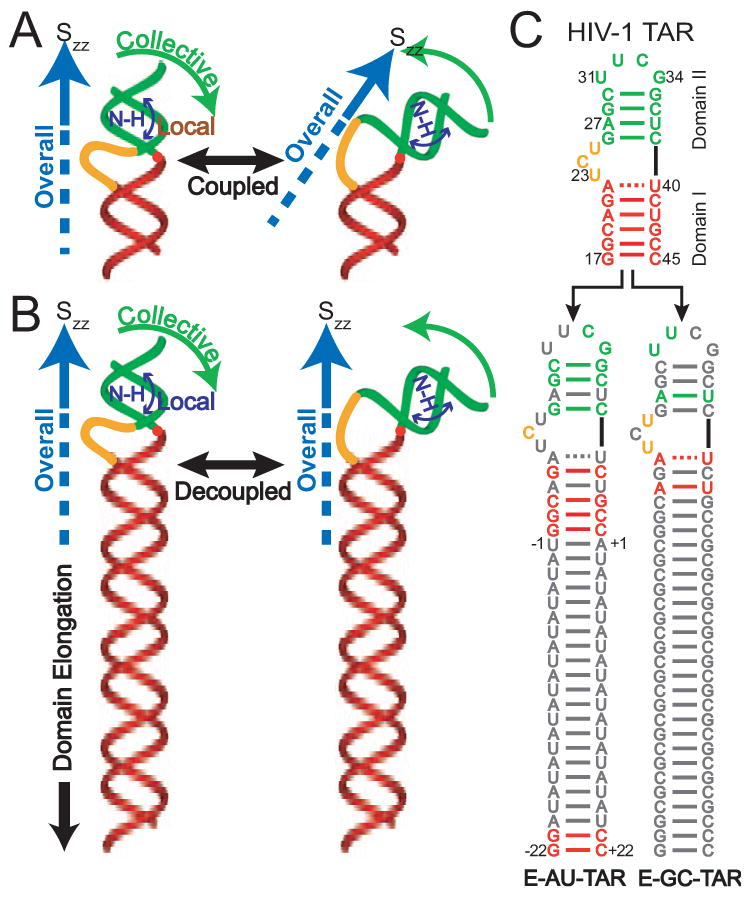
Decoupling internal and overall motions in RNA by domain-elongation[20]. (A) Collective helix motions lead to coupled changes in overall alignment as described by the principal axis of the order tensor (Szz). (B) Decoupling collective motional modes by domain elongation effectively renders Szz parallel to the long-axis of the RNA. (C) NMR invisible elongation of TAR RNA. Isotopically unlabeled residues are shown in grey. Two terminal G–C base-pairs are added to domain I in E-TAR to maximize yields by in vitro transcription.
One approach to overcome this problem is to elongate a target helix such that the overall RNA shape and hence its overall alignment is dominated by the elongated helix and is no longer as sensitive to internal motions occurring elsewhere in the molecule (Figure 2B). The elongation also serves to predefine the overall order tensor to be axially symmetric with principal direction oriented nearly parallel to the axis of the elongated helix (Figure 2B). The RDCs measured in the elongated helix can be used to experimentally determine the overall order tensor (Skl). Thus, the time-averaged angular term in Equation (1) can be expressed for the nth conformer in terms of the time-independent orientation of an inter-nuclear vector relative to an arbitrary frame (αi) and the five order tensor elements (Skl) describing overall alignment[27, 28],
| (2) |
where is the angle between the inter-nuclear vector in the nth conformer and the mth axis of the arbitrary frame. For a structural ensemble consisting of N conformers that interconvert at timescales shorter than the inverse of the dipolar interaction (<ms), the observed RDCs will be a population-weighted average over the ensemble,
| (3) |
A number of factors make RDCs ideal data for generating structural ensembles[29, 30]. First, RDCs provide long-range orientational constraints on individual bond vectors and thus provide information at the site-specific level. Second, RDCs measured in elongated RNA can be computed for a given structural ensemble with a high degree of accuracy. Third, RDCs are sensitive to internal motions spanning a broad range of timescales (<ms) and the ensembles generated will therefore sample a broad conformational distribution[31, 32]. Finally, RDCs can be measured with great abundance over different regions of the RNA structure[32] and with the high density needed to construct multi-conformer ensembles[19, 29, 30, 33].
2.3 Design of “NMR invisible” elongated RNA
The elongation of an RNA target is typically preformed by extending the length of a terminal helix using a stretch of Watson-Crick base-pairs (Figure 2C)[20]. To avoid increasing spectral overlap due to elongation residues, an isotopic labeling strategy is used to render elongation residues “NMR invisible”[20]. Here, two constructs are prepared in which stretches of alternating unlabelled A–U/U-A (E-AU-RNA) and G–C/C-G (E-GC-RNA) base-pairs are employed for elongation using otherwise uniformly 13C/15N labeled G–C and A–U nucleotides, respectively (Figure 2C) [20]. Two G-C base pairs are added to the terminal end of E-AU-RNA to facilitate RNA synthesis by in vitro transcription. Structure prediction software such as mfold 3.3 are used to ensure that no alternate structures form as the result of elongation [34]. The two constructs thus allow acquisition of NMR data over the entire RNA target while keeping elongation residues “NMR invisible”.
One must ensure that the elongation does not perturb the structural and functional integrity of the RNA. This can be conveniently done by comparing spectra of elongated and non-elongated RNA samples. In general, elongation of terminal helices is not expected to give rise to significant RNA structural perturbations. However, depending on the RNA context, elongation of other non-terminal helices, which can allow the measurement of independents set of RDCs (and RCSAs) that can be applied to generate strutural dynamics with enhanced spatial resolution [19], may cause unwanted perturbations and should be carefully analyzed.
The degree of helix elongation needed to sufficiently decouple internal and overall motions will vary depending on the RNA target. In general, the elongation should render a target helix at least 4-5-fold longer than other helices in the RNA. If a structure for the RNA target is available, one can perform simulations using programs such as PALES[35], using idealized A-form helices to model the elongated helix[19], to examine the degree of motional coupling. In these simulations, one computes the variance in the predicted overall alignment tensor relative to the elongated helix as a function of varying the relative orientation of other shorter helices in the RNA. In general, the principal direction of order (Szz) should not vary more than ±7 degrees about the elongated axis and the asymmetry (η) should always be <0.15. The secondary structure of an E-RNA construct should be verified using a secondary structure prediction programs such as mfold 3.3 to make sure that no alternative secondary structures can form[34].
The E-RNA NMR samples (> 0.2 mM) are prepared using standard in vitro transcription reactions employing the appropriately 13C/15N labeled nucleotides[36, 37]. Formation of the elongated helix can be verified using NMR[20]. First, one expects to observe an intense 1H signal corresponding to the chemically degenerate Watson-Crick hydrogen bonded imino protons of guanines and uridines used in the elongation in 1D 1H spectra. Second, one expects to observe signals that are characteristic of sequential 13C/15N enriched terminal GC base-pairs in the elongated helix, which are included to enhance transcription efficiency.
2.4. Partial alignment of E-RNA
The measurement of RDCs in solution NMR is contingent upon inducing an appropriate degree of alignment typically on the order of 10-3[38]. These levels of alignment can now be routinely achieved by dissolving biomolecules in inert ordered media (for reviews see[39, 40]) that transmit some of their order to solute molecules through mechanisms that are believed to involve a combination of steric obstruction and charge-charge interactions (Figure 3A). The most popular and commercially available ordering medium is Pf1 phage[41, 42]. Relative to other media, Pf1 phage is tolerant to the high salt concentrations used in nucleic acid samples and is negatively charged thus reducing the possibility for adverse inter-molecular interactions. Pf1 phage is available commercially or can be prepared using the methods described in reference[41]. Typically, a Pf1 solution is exchanged into NMR buffer by repeated (at least three) rounds of ultracentrifugation (1hr in a Beckman TLA-100.3 rotor at 95,000 rpm, or 3-6 hrs in a VTi50 rotor at 40,000 rpm) followed by re-suspension of the pellet into the NMR buffer. Alternatively, one can dialyze Pf1 phage into the desired buffer. After completing the aligned experiments, the same ultracentrifugation procedure can in principle be used to recover the nucleic acid (supernatant) from the phage solution (pellet). Note that it will generally be difficult to achieve perfect separation of the nucleic acid sample from the phage medium.
Figure 3.
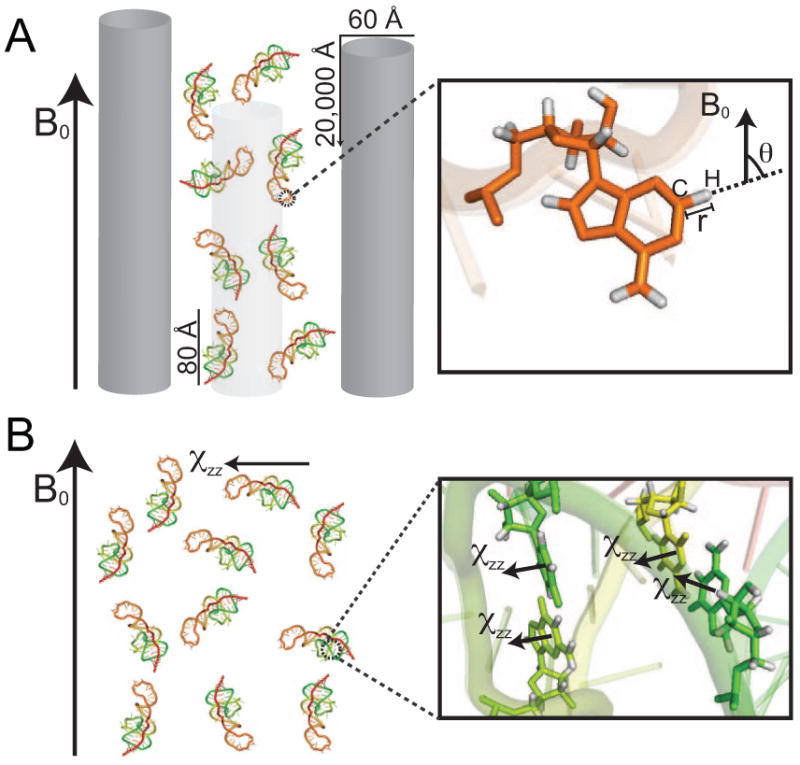
Partial alignment of nucleic acids using (A) ordering media such as Pf1 phage which transmit their order through steric and electrostatic mechanisms and (B) spontaneous alignment due to constructive addition of anisotropic magnetic susceptibility tensors (χ) in the nucleobases of nucleic acids.
Owing to their large structural anisotropy, the concentration of Pf1 phage needed to align E-RNA samples (∼6-8 mg/ml) is usually considerably smaller than for non-elongated RNA (∼20-25 mg/ml). If a model structure for the RNA is available, programs for predicting steric alignment such as PALES[35] can be used to assess relative levels of order and the Pf1 phage concentration be adjusted accordingly. The aligned RNA sample is typically prepared by adding a pre-concentrated RNA solution (∼0.5-1.5 mM) in NMR buffer to a desired volume of Pf1 phage (50 mg/mL) in NMR buffer in an Eppendorf tube and the sample gently transferred into the NMR tube avoiding formation of bubbles. It is important to verify that the ordering medium does not interfere with the RNA conformation by comparing chemical shifts obtained in the unaligned and aligned samples. Note that small variations in the chemical shifts of nucleobase carbons and nitrogens are expected between unaligned and aligned samples due to incomplete averaging of Residual Chemical Shift Anisotropies (RCSAs) [43-45]. These RCSA contributions scale linearly with the magnetic field and degree of order.
It should be noted that an alternative approach for aligning nucleic acids involves spontaneous alignment due to interactions with the magnetic field itself (Figure 3B). Although the degree of field induced alignment remains smaller than optimal, there are reasons to believe that optimal levels will inevitably be reached as larger nucleic acids are investigated and magnetic field strengths continue to rise. This approach is not described here and the reader can consult reviews on this topic.
2.5. Measurement of RDCs in E-RNA
A large number of pulse sequences have been reported for the measurement of a wide variety of RDCs in nucleic acids. These experiments are not described in detail here as they have been reviewed elsewhere.[52] The RDCs are generally computed from the difference in splittings observed in the absence (J) and presence of alignment media (J+D) (Figure 1B). For large E-RNA, it is important to employ TROSY schemes for measuring RDCs in the nucleobases[46]. For example, CH splittings in the nucleobases are measured as the difference between the upfield and downfield components of the 1H –13C doublet along the 1H dimension using the narrow TROSY component in the 13C dimension. For E-RNA, the most commonly targeted RDCs are those between directly bonded C-H and N-H nuclei (e.g. C2H2/C8H8 of the adenine and guanine bases, C5H5/C6H6 of the uracil and cytosine bases, N1H1 and N3H3 of the guanine and uracil bases, and C1′H1′ of the ribose), which yield the largest RDC magnitudes. While additional one, two, and three bond RDCs can also be measured, these RDCs are smaller and may prove difficult to measure in larger E-RNAs (>60 nt).
When using frequency domain experiments to measure splittings, phase distortions due to improper calibration of timing delays and/or imperfections in shaped pulses can yield splitting measurement errors that are larger than theoretical limits (approximately given by 0.7*Linewidth*(1/Signal:Noise))[47]. To avoid differential contributions from magnetic field induced RDCs and relaxation interference effects, splittings in unaligned and aligned samples should be measured at the same magnetic field strength. It is advisable to estimate the experimental RDC uncertainty from the standard deviation in duplicate measurements. Resonances exhibiting significant differences (>3σ) as a result of considerable broadening, overlap, presence/absence of unresolved multiplets should not be used in subsequent data analysis.
2.6 Normalizing RDCs measured in distinct E-RNA samples
The RDCs measured in the different E-AU and E-GC samples need to be normalized to take into account possible differences in the degree of alignment before the data can be pooled together and analyzed in constructing atomic-resolution ensembles[19]. The normalization is carried out using RDCs measured in contiguous Watson-Crick base-pairs, which can be modeled assuming an idealized A-form geometry (see below). The errors introduced due to A-form structural noise can be estimated as described previously[53]. The normalization is accomplished by repeatedly fitting the total pool of RDCs to individual idealized A-form helices following uniform scaling of the RDCs measured in one sample (typically the sample with the lesser number of measured RDCs) by a normalization factor L The L value that minimizes the Quality factor (Q)[48] is computed using[19]:
| (4) |
Fitting of the RDCs to the A-form helices can be accomplished using various programs including ORDERTEN-SVD[27], REDCAT[49], PALES[35], iDC[50], CONFORMIST[51] and RAMAH[43].
2.7 Determining the overall order tensor
The interpretation of E-RNA RDCs is greatly simplified by determining the overall order tensor governing alignment. The overall order tensor can be determined using RDCs measured in the reference elongated helix using a procedure that has been described in detail elsewhere[52, 53]. The procedure is briefly outlined below:
Build idealized A-form helices (PDB files) corresponding to the sequence of the reference helix. For example, to build an A-form helix using the Biopolymer module of Insight II 2000.1 (Molecular Simulations, Inc): click on the module icon in the upper left corner and select append from the nucleotide menu. In the popup box, select “A_RNA_Duplex”. Input a name for the molecule into the text field. Next, select the appropriate Watson-Crick base-pair in the Nucleotide text field. Continue to append base-pairs – following along in sequence from 5′ to 3′ – until you have completed building the desired helix. Click cancel and then select the File menu and choose the desired export option for the helix coordinates. The idealized A-form helices should conform to published parameters[53-55]. If building helices using INSIGHT II 2000.1 (Moleculr Simulations, Inc.), care needs to be taken to correct the propeller twist angles to the proper value of -14.50. We have a program named HPmod to correct for the improper propeller twist (available from Author upon request). Programs such as Curves 5.1 [56], FreeHelix98[57], 3DNA[55, 58], SCHNAaP[59], NUPARM and NUCGEN[60] can be used to compute relevant helix parameters.
Compute five order tensor elements for each A-form helix by fitting the RDCs to the A-form PDB coordinates. Several programs are available to carry out such calculations including ORDERTEN-SVD[27], REDCAT[49], PALES[35], iDC[50], CONFORMIST[51] and RAMAH[43]. Note, non-ideal WC base-pairs are excluded from this analysis. In our lab RAMAH is used to determine the five order tensor elements.
Examine the correlation between measured and back-calculated RDCs. Major outliers should be interrogated for possible measurement errors.
Use AFORM-RDC[53] or other approaches[61] to estimate the order tensor error due to structural noise and RDC measurement uncertainty.
Owing to the uniform distribution of charge in polyanionic nucleic acids, the steric and electrostatic forces are believed to have a similar functional form[62, 63]. Consequently, E-RNAs are expected to align in ordering media with the principal direction of order (Szz) oriented along the elongated axis. In general, one expects positive alignment (Szz> 0) with the Szz direction being, on average, oriented parallel to the magnetic field[19]. The asymmetry of alignment is also expected to be nearly axially symmetric (η∼0)[19].
2.8 Molecular Dynamics (MD) simulations of RNA
MD simulations are used in this case to generate a large conformational pool that can be filtered using experimental RDCs so as to generate a more accurate ensemble of RNA conformers. A variety of MD simulation packages and force-fields can be employed to simulate nucleic acids. Here we describe a protocol for simulating RNA using the CHARMM MD package[64] with force-field parameter set 27 for nucleic acids[65].
-
System Preparation using MMTSB Toolkit: To prepare the system for simulation with CHARMM, the MMTSB Toolset (http://blue11.bch.msu.edu/mmtsb/Main_Page)[66] is used. The Toolset consists of a set of perl scripts that can be used to prepare, initiate and analyze a system for MD simulation. Here they are only described in terms of preparing a system for an MD simulation:
Obtain coordinates for the RNA from the Protein Data Bank (PDB) (http://www.pdb.org) or the Nucleic Acid Database (NDB) (http://ndbserver.rutgers.edu/). Use the MMTSB toolset script convpdb.pl to add solvent and ions to the system using the command: convpdb.pl -solvate -cutoff 15 -cubic -ions SOD:27 hivtar-0.pdb > hivtar-0-solvated-ions.pdb. In this example -solvate flag indicates that pdb solvent molecules will be added, -cutoff 15 specifies the distance (15 Å) from the RNA to the edge of the solvent cube, -cubic specifies a solvent shape (alternatively a octahedron water box could be specified with -octahedron flag), -ions SOD:27 specifies that 27 sodium ions be added to make the system charge neutral, and hivtar-0.pdb indicates the input pdb file.
Use the MMTSB toolset script genPSF to generate protein structure file (PSF) and CHARMM formatted coordinate file using the command: genPSF.pl -par nodeoxy -crdout hivtar-0-solvated-ions.cor hivtar-0-solvated-ions.pdb > hivtar-0-solvated-ions.psf. Here the -par nodeoxy flag specifies that the system is an RNA molecule, -crdout and hivtar-0-solvated-ions.cor specifies the filename for the output CHARMM formatted coordinate, and is hivtar-0-solvated-ions.psf is the output PSF file.
-
Equilibration using CHARMM
Read in parameter and topology file set 27 for nucleic acids
Read in generate PSF and coordinates files
Do 500 steps Steepest Descent (SD) minimization to remove bad contacts using the CHARMM MINI SD module
Place harmonic constraints on heavy atoms of the RNA using CONS HARM (see CHARMM's cons.doc manual) and perform 1000 steps of SD minimization, followed by 2000 steps of Adopted Basis Newton-Raphson (ABNR) minimization or until energy converges (see CHARMM's minimiz.doc manual). This process allows solvent and counter-ions to relax around the RNA.
The energy minimized structure is heated up to 300 K, by carrying out a series of constant temperature simulations starting at 0 K for ∼20 ps at each temperature. The temperature is increased by 25 K each incremental time-step using coordinates from the previous run as input for the next 20 ps simulation. We usually use the Nosé Hoover thermostat with a coupling constant of 100 ps -1 together with the Velocity Verlet (VVER) integrator with a integration time-step of 1 fs. Periodic boundary conditions are used, with electrostatics calculated using particle-mesh Ewald and Lenard-Jones interaction truncated at 12 Å, with a switching function applied between 10 to 12 Å.
At 300 K the harmonic constraint is gradually removed by decreasing the force constant.
Equilibration is continued at 300 K and without any harmonic constraints for an additional 500 ps.
-
Generation of trajectory: Generation of structural ensembles from an MD derived pool of conformations hinges on the ability to adequately sample the relevant regions of conformational space. It has been shown that using multiple short trajectories may enhance the rate of conformational sampling[67, 68] when compared to a single long trajectory of same effective length, which is advantageous to our methods since we use experimental data to filter unrealistic conformations. In this protocol we will describe the use of multiple short trajectories to generate such selection pools.
Initiate a set of independent MD constant temperature replica trajectories starting from the same equilibrated structure generated in part-A. We have found 50 replicas to be sufficient. The thermostat, integrator and non-bonded energy calculation options are same as stated above.
Assign each replica a different set of initial velocities by specifying a different seed value for the random number generator used to assign initial velocities using the ISEED input flag into DYNA.
Generate trajectories of about ∼ 3 ns, while saving conformations each 1 ps.
Discard the first 1 ns and pool the remaining ∼ 2 ns trajectories for each replica to create a selection pool. In this case we generated ∼100,000 conformations. Use this pool for selection of structural ensembles as described below.
2.9 Combine NMR RDCs and MD to generate a structural ensemble – Sample and Select
The Sample and Select method was originally implemented as a tool to generate structural ensembles of proteins using a combination of MD and NMR derived NH spin relaxation order parameters (S2)[11]. The basic idea is to sample the relevant conformational space and then select a sub-ensemble that is most consistent with the experimental data. We adapted this method to use RDCs measured on E-RNA to select structural ensembles of RNA from a selection pool derived from an MD simulation[21]. The SAS selection is preformed following the recently described procedure[21] in which one minimizes a cost function utilizing a Monte-Carlo simulated annealing approach:
Randomly select an N-membered subset of structures from the total pool of M structures and calculate χ2 using where and are the calculated and measured RDCs, respectively, and L is the total number of bond vectors.
Randomly replace one of the N-membered structures with a randomly chosen structure from the remaining M-N conformational pool. Accept the move for step k to k+1 if χ2(k + 1) < χ2(k). If χ2(k +1)> χ2(k), accept the move with a probability P = e((χ2(k)−χ2(k+1))Ti), where Ti is the effective temperature. We typically use a linear cooling schedule, specifically Ti+1 = 0.9Ti, where the index i runs over the temperature increments.
Continue Monte-Carlo annealing simulations until χ2 converges. In our simulations with M = 80000, N=20 and L=82, convergence was achieved within 100 temperature increments with each consisting of 100,000 MC steps.
As an example, we used the SAS approach together with RDCs measured in two elongated RNA samples to construct atomic-resolution ensembles for the HIV-1 transactivation response element (TAR). RDCs were measured in two elongated samples in which each domain was independently elongated. In Figure 4A, we compare the RDCs measured previously[19] in the two elongated TAR samples with those predicted based on the combined 50 × 1.6 = 80 ns MD trajectory. Though some correlation is observed between the measured and predicted RDCs, the deviations (RMSD ranging between 13-16 Hz) remains substantially larger than the estimated RDC measurement uncertainty (∼4 Hz). The poor agreement indicates that the MD simulation does not accurately reproduce the TAR internal motions. This highlights the importance of including experimental data in the analysis of MD simulations. Using SAS we were able to select a sub-ensemble consisting of N=20 snap-shots from the MD trajectory that reproduce the RDCs close to within experimental precision (Figure 4B). The SAS selected TAR structural ensemble is shown in Figure 4C and reveals extensive local and global motions in TAR at atomic-resolution.
Figure 4.
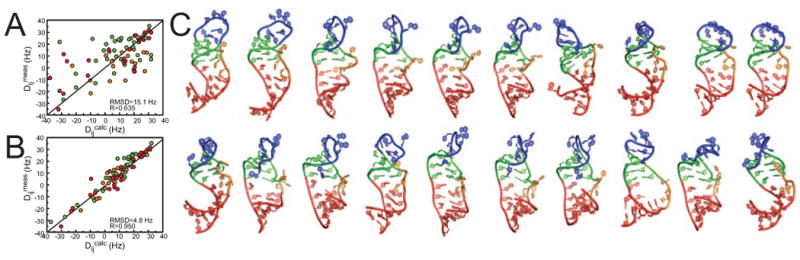
Constructing atomic-resolution TAR structural ensembles using motionally decoupled RDCs in conjunction with MD[21]: SAS analysis of HIV-1 E-TAR RDCs. (A) Plots of experimental RDCs versus values computed from the 80 ns MD trajectory for EI-TAR. Data for helix I, helix II, and bulge, are shown in red, green and orange respectively following the color code in Figure 2. Also shown is the root-mean-square-deviation (rmsd) and correlation coefficient (R). (B) Plot of experimental RDCs versus values calculated from the N=20 SAS ensemble using EI-TAR+EII-TAR RDCs (C). The 20 SAS selected TAR conformers.
Once an ensemble is constructed, it is important to have the means to establish its validity. This can be done using experimental data that is not included in the selection process. In addition to RDCs, future studies can also include RCSAs[43, 45], NOEs, as well as spin relaxation order parameters[69, 70], or data from other experimental techniques such as SHAPE foot printing[71] data and fluorescence[72]. The constructed ensembles can also be compared with expected parameters. For example, average and standard deviations for various base angles have been reported for Watson-Crick base-pairs that are flanked by other Watson-Crick base-pairs in A-form helices[53]. Last but not least, the ensemble can be interpreted in light of known mechanistic aspects of the RNA function.
3. Concluding Remarks
Domain-elongation provides the basis for uniting NMR experimental data with computational methods and thereby constructing RNA structural ensembles at atomic-resolution with timescale sensitivity extending up to millisecond timescales. The SAS approach is very general, and additional sources of experimental data, including RCSA and spin relaxation NMR measurements, can be included in the future to enhance the accuracy of the generated structural ensembles. Future studies should also focus on the development of methods for modulating the alignment of elongated RNA and for
Footnotes
Publisher's Disclaimer: This is a PDF file of an unedited manuscript that has been accepted for publication. As a service to our customers we are providing this early version of the manuscript. The manuscript will undergo copyediting, typesetting, and review of the resulting proof before it is published in its final citable form. Please note that during the production process errors may be discovered which could affect the content, and all legal disclaimers that apply to the journal pertain.
References
- 1.Al-Hashimi HM, Walter NG. RNA Dynamics: It is about time. Curr Opin Struct Biol. 2008;18(3):321–9. doi: 10.1016/j.sbi.2008.04.004. [DOI] [PMC free article] [PubMed] [Google Scholar]
- 2.Hall KB. RNA in motion. Curr Opin Chem Biol. 2008;12(6):612–8. doi: 10.1016/j.cbpa.2008.09.033. [DOI] [PMC free article] [PubMed] [Google Scholar]
- 3.Nudler E. Flipping riboswitches. Cell. 2006;126(1):19–22. doi: 10.1016/j.cell.2006.06.024. [DOI] [PubMed] [Google Scholar]
- 4.Perez-Canadillas JM, Varani G. Recent advances in RNA-protein recognition. Curr Opin Struct Biol. 2001;11(1):53–58. doi: 10.1016/s0959-440x(00)00164-0. [DOI] [PubMed] [Google Scholar]
- 5.Tucker BJ, Breaker RR. Riboswitches as versatile gene control elements. Curr Opin Struct Biol. 2005;15(3):342–8. doi: 10.1016/j.sbi.2005.05.003. [DOI] [PubMed] [Google Scholar]
- 6.Furtig B, et al. Time-resolved NMR studies of RNA folding. Biopolymers. 2007;86(5-6):360–83. doi: 10.1002/bip.20761. [DOI] [PubMed] [Google Scholar]
- 7.Henzler-Wildman K, Kern D. Dynamic personalities of proteins. Nature. 2007;450(7172):964–72. doi: 10.1038/nature06522. [DOI] [PubMed] [Google Scholar]
- 8.Mittermaier A, Kay LE. New tools provide new insights in NMR studies of protein dynamics. Science. 2006;312(5771):224–8. doi: 10.1126/science.1124964. [DOI] [PubMed] [Google Scholar]
- 9.Mackerell AD, Jr, Nilsson L. Molecular dynamics simulations of nucleic acid-protein complexes. Curr Opin Struct Biol. 2008;18(2):194–9. doi: 10.1016/j.sbi.2007.12.012. [DOI] [PMC free article] [PubMed] [Google Scholar]
- 10.Orozco M, Noy A, Perez A. Recent advances in the study of nucleic acid flexibility by molecular dynamics. Curr Opin Struct Biol. 2008;18(2):185–93. doi: 10.1016/j.sbi.2008.01.005. [DOI] [PubMed] [Google Scholar]
- 11.Chen Y, Campbell SL, Dokholyan NV. Deciphering protein dynamics from NMR data using explicit structure sampling and selection. Biophys J. 2007;93(7):2300–6. doi: 10.1529/biophysj.107.104174. [DOI] [PMC free article] [PubMed] [Google Scholar]
- 12.Lindorff-Larsen K, et al. Simultaneous determination of protein structure and dynamics. Nature. 2005;433(7022):128–32. doi: 10.1038/nature03199. [DOI] [PubMed] [Google Scholar]
- 13.Markwick PR, Bouvignies G, Blackledge M. Exploring multiple timescale motions in protein GB3 using accelerated molecular dynamics and NMR spectroscopy. J Am Chem Soc. 2007;129(15):4724–30. doi: 10.1021/ja0687668. [DOI] [PubMed] [Google Scholar]
- 14.Showalter SA, Bruschweiler R. Quantitative molecular ensemble interpretation of NMR dipolar couplings without restraints. J Am Chem Soc. 2007;129(14):4158–9. doi: 10.1021/ja070658d. [DOI] [PubMed] [Google Scholar]
- 15.Zhang Q, et al. Probing motions between equivalent RNA domains using magnetic field induced residual dipolar couplings: accounting for correlations between motions and alignment. J Am Chem Soc. 2003;125(35):10530–1. doi: 10.1021/ja0363056. [DOI] [PubMed] [Google Scholar]
- 16.Musselman C, Al-Hashimi HM, Andricioaei I. iRED analysis of TAR RNA reveals motional coupling, long-range correlations, and a dynamical hinge. Biophys J. 2007;93(2):411–22. doi: 10.1529/biophysj.107.104620. [DOI] [PMC free article] [PubMed] [Google Scholar]
- 17.Showalter SA, et al. Iron responsive element RNA flexibility described by NMR and isotropic reorientational eigenmode dynamics. J Biomol NMR. 2005;32(3):179–93. doi: 10.1007/s10858-005-7948-2. [DOI] [PubMed] [Google Scholar]
- 18.Zhang Q, Al-Hashimi HM. Extending the NMR spatial resolution limit for RNA by motional couplings. Nat Methods. 2008;5(3):243–5. doi: 10.1038/nmeth.1180. [DOI] [PubMed] [Google Scholar]
- 19.Zhang Q, et al. Visualizing spatially correlated dynamics that directs RNA conformational transitions. Nature. 2007;450(7173):1263–7. doi: 10.1038/nature06389. [DOI] [PubMed] [Google Scholar]
- 20.Zhang Q, et al. Resolving the motional modes that code for RNA adaptation. Science. 2006;311(5761):653–6. doi: 10.1126/science.1119488. [DOI] [PubMed] [Google Scholar]
- 21.Frank AT, et al. Constructing RNA Dynamical Ensembles by Combining MD and Motionally Decoupled NMR RDCs: New insights into RNA Dynamics and Adaptive Ligand Recognition. Nucleic Acids Res. 2009 doi: 10.1093/nar/gkp156. Advance Access. [DOI] [PMC free article] [PubMed] [Google Scholar]
- 22.Bothner-By AA. Magnetic field induced alignment of molecules. In: Grant DM, Harris RK, editors. Encyclopedia of Nuclear Magnetic Resonance. Wiley; Chichester: 1995. pp. 2932–38. [Google Scholar]
- 23.Tjandra N, Bax A. Direct measurement of distances and angles in biomolecules by NMR in a dilute liquid crystalline medium. Science. 1997;278(5340):1111–14. doi: 10.1126/science.278.5340.1111. [DOI] [PubMed] [Google Scholar]
- 24.Tolman JR, et al. Nuclear Magnetic Dipole Interactions in Field-Oriented Proteins - Information For Structure Determination in Solution. Proc Natl Acad Sci U S A. 1995;92(20):9279–83. doi: 10.1073/pnas.92.20.9279. [DOI] [PMC free article] [PubMed] [Google Scholar]
- 25.Getz MM, et al. Structural plasticity and Mg2+ binding properties of RNase P P4 from combined analysis of NMR residual dipolar couplings and motionally decoupled spin relaxation. RNA. 2007;13(2):251–66. doi: 10.1261/rna.264207. [DOI] [PMC free article] [PubMed] [Google Scholar]
- 26.Sun X, Zhang Q, Al-Hashimi HM. Resolving fast and slow motions in the internal loop containing stem-loop 1 of HIV-1 that are modulated by Mg2+ binding: role in the kissing-duplex structural transition. Nucleic Acids Res. 2007;35(5):1698–713. doi: 10.1093/nar/gkm020. [DOI] [PMC free article] [PubMed] [Google Scholar]
- 27.Losonczi JA, et al. Order matrix analysis of residual dipolar couplings using singular value decomposition. J Magn Reson. 1999;138(2):334–342. doi: 10.1006/jmre.1999.1754. [DOI] [PubMed] [Google Scholar]
- 28.Saupe A. Recent results in the field of liquid crystals. Angew Chem, Int Ed Engl. 1968;7:97–112. [Google Scholar]
- 29.Schwieters CD, Clore GM. A physical picture of atomic motions within the Dickerson DNA dodecamer in solution derived from joint ensemble refinement against NMR and large-angle X-ray scattering data. Biochemistry. 2007;46(5):1152–66. doi: 10.1021/bi061943x. [DOI] [PubMed] [Google Scholar]
- 30.Clore GM, Schwieters CD. Amplitudes of protein backbone dynamics and correlated motions in a small alpha/beta protein: correspondence of dipolar coupling and heteronuclear relaxation measurements. Biochemistry. 2004;43(33):10678–91. doi: 10.1021/bi049357w. [DOI] [PubMed] [Google Scholar]
- 31.Tolman JR, et al. NMR evidence for slow collective motions in cyanometmyoglobin. Nat Struct Biol. 1997;4(4):292–297. doi: 10.1038/nsb0497-292. [DOI] [PubMed] [Google Scholar]
- 32.Getz M, et al. Review NMR studies of RNA dynamics and structural plasticity using NMR residual dipolar couplings. Biopolymers. 2007;86(5-6):384–402. doi: 10.1002/bip.20765. [DOI] [PubMed] [Google Scholar]
- 33.Fisher CK, et al. Ultra-High Resolution Characterization of Domain Motions and Correlations by Multi-Alignment and Multi-Reference RDC NMR. J Chem Phys B. 2008;112(51):16815–22. doi: 10.1021/jp806188j. [DOI] [PMC free article] [PubMed] [Google Scholar]
- 34.Zuker M. Calculating nucleic acid secondary structure. Curr Opin Struct Biol. 2000;10(3):303–10. doi: 10.1016/s0959-440x(00)00088-9. [DOI] [PubMed] [Google Scholar]
- 35.Zweckstetter M, Bax A. Prediction of sterically induced alignment in a dilute liquid crystalline phase; aid to protein structure determination by NMR. J Am Chem Soc. 2000;122:3791–92. [Google Scholar]
- 36.Milligan JF, et al. Oligoribonucleotide synthesis using T7 RNA-polymerase and synthetic DNA templates. Nucleic Acids Res. 1987;15(21):8783–98. doi: 10.1093/nar/15.21.8783. [DOI] [PMC free article] [PubMed] [Google Scholar]
- 37.Milligan JF, Uhlenbeck OC. Synthesis of small RNAs using T7 RNA polymerase. Methods Enzymol. 1989;180:51–62. doi: 10.1016/0076-6879(89)80091-6. [DOI] [PubMed] [Google Scholar]
- 38.Tjandra N. Establishing a degree of order: obtaining high-resolution NMR structures from molecular alignment. Structure. 1999;7(9):R205–11. doi: 10.1016/s0969-2126(99)80167-1. [DOI] [PubMed] [Google Scholar]
- 39.Prestegard JH, Kishore AI. Partial alignment of biomolecules: an aid to NMR characterization. Curr Opin Chem Biol. 2001;5(5):584–90. doi: 10.1016/s1367-5931(00)00247-7. [DOI] [PubMed] [Google Scholar]
- 40.Tolman JR, Al-Hashimi HM. NMR Studies of Biomolecular Dynamics and Structural Plasticity Using Residual Dipolar Couplings. In: Webb GA, editor. Annual Reports on NMR Spectroscopy. Academic Press; 2003. pp. 105–66. [Google Scholar]
- 41.Hansen MR, Mueller L, Pardi A. Tunable alignment of macromolecules by filamentous phage yields dipolar coupling interactions. Nat Struct Biol. 1998;5(12):1065–74. doi: 10.1038/4176. [DOI] [PubMed] [Google Scholar]
- 42.Clore GM, Starich MR, Gronenborn AM. Measurement of residual dipolar couplings of macromolecules aligned in the nematic phase of a colloidal suspension of rod- shaped viruses. J Amer Chem Soc. 1998;120(40):10571–72. [Google Scholar]
- 43.Hansen AL, Al-Hashimi HM. Insight into the CSA tensors of nucleobase carbons in RNA polynucleotides from solution measurements of residual CSA: towards new long-range orientational constraints. J Magn Reson. 2006;179(2):299–307. doi: 10.1016/j.jmr.2005.12.012. [DOI] [PubMed] [Google Scholar]
- 44.Ottiger M, Tjandra N, Bax A. Magnetic field dependent amide N-15 chemical shifts in a protein-DNA complex resulting from magnetic ordering in solution. J Amer Chem Soc. 1997;119(41):9825–30. [Google Scholar]
- 45.Ying J, Grishaev A, Bax A. Carbon-13 chemical shift anisotropy in DNA bases from field dependence of solution NMR relaxation rates. Magn Reson Chem. 2006;44(3):302–10. doi: 10.1002/mrc.1762. [DOI] [PubMed] [Google Scholar]
- 46.Pervushin K, et al. Attenuated T-2 relaxation by mutual cancellation of dipole-dipole coupling and chemical shift anisotropy indicates an avenue to NMR structures of very large biological macromolecules in solution. Proc Natl Acad Sci U S A. 1997;94(23):12366–71. doi: 10.1073/pnas.94.23.12366. [DOI] [PMC free article] [PubMed] [Google Scholar]
- 47.Kontaxis G, Clore GM, Bax A. Evaluation of cross-correlation effects and measurement of one- bond couplings in proteins with short transverse relaxation times. J Magn Reson. 2000;143(1):184–96. doi: 10.1006/jmre.1999.1979. [DOI] [PubMed] [Google Scholar]
- 48.Cornilescu G, et al. Validation of protein structure from anisotropic carbonyl chemical shifts in a dilute liquide crystalline phase. J Am Chem Soc. 1998;120(27):6836–37. [Google Scholar]
- 49.Valafar H, Prestegard JH. REDCAT: a residual dipolar coupling analysis tool. J Magn Reson. 2004;167(2):228–41. doi: 10.1016/j.jmr.2003.12.012. [DOI] [PubMed] [Google Scholar]
- 50.Wei YF, Werner MH. iDC: A comprehensive toolkit for the analysis of residual dipolar couplings for macromolecular structure determination. J Biomol NMR. 2006;35(1):17–25. doi: 10.1007/s10858-006-9009-x. [DOI] [PubMed] [Google Scholar]
- 51.Skrynnikov NR, et al. Orienting domains in proteins using dipolar couplings measured by liquid-state NMR: differences in solution and crystal forms of maltodextrin binding protein loaded with beta-cyclodextrin. J Mol Biol. 2000;295(5):1265–73. doi: 10.1006/jmbi.1999.3430. [DOI] [PubMed] [Google Scholar]
- 52.Bailor MH, et al. Characterizing the relative orientation and dynamics of RNA A-form helices using NMR residual dipolar couplings. Nat Protoc. 2007;2(6):1536–46. doi: 10.1038/nprot.2007.221. [DOI] [PMC free article] [PubMed] [Google Scholar]
- 53.Musselman C, et al. Impact of static and dynamic A-form heterogeneity on the determination of RNA global structural dynamics using NMR residual dipolar couplings. J Biomol NMR. 2006;36(4):235–49. doi: 10.1007/s10858-006-9087-9. [DOI] [PubMed] [Google Scholar]
- 54.Neidle S. Oxford Handbook of Nucleic Acid Structure. New York: Oxford University Press; 1999. [Google Scholar]
- 55.Olson WK, et al. A Standard Refernce Frame for the Description of Nucleic Acid Base-pair Geometry. J Mol Biol. 2001;313:229–37. doi: 10.1006/jmbi.2001.4987. [DOI] [PubMed] [Google Scholar]
- 56.Ravishanker G, et al. Conformational and helicoidal analysis of 30 ps of molecular-dynamcis on the d(CGCGAATTCGCG) double helix: “curves”, dials, and windows. J Biomol Struct Dyn. 1989;6(4):669–99. doi: 10.1080/07391102.1989.10507729. [DOI] [PubMed] [Google Scholar]
- 57.Dickerson RE. DNA bending: The prevalence of kinkiness and the virtues of normality. Nucleic Acids Res. 1998;26(8):1906–26. doi: 10.1093/nar/26.8.1906. [DOI] [PMC free article] [PubMed] [Google Scholar]
- 58.Lu XJ, Olson WK. 3DNA: a software package for the analysis, rebuilding and visualization of three-dimensional nucleic acid structures. Nucleic Acids Res. 2003;31(17):5108–21. doi: 10.1093/nar/gkg680. [DOI] [PMC free article] [PubMed] [Google Scholar]
- 59.Lu J. Collectins: collectors of microorganisms for the innate immune system. BioEssays. 1997;19:509–18. doi: 10.1002/bies.950190610. [DOI] [PubMed] [Google Scholar]
- 60.Bansal M, Bhattacharyya D, Ravi B. NUPARM and NUCGEN: software for analysis and generation of sequence dependent nucleic acid structures. Comp Appl Biosci. 1995;11(3):281–87. doi: 10.1093/bioinformatics/11.3.281. [DOI] [PubMed] [Google Scholar]
- 61.Zweckstetter M, Bax A. Evaluation of uncertainty in alignment tensors obtained from dipolar couplings. J Biomol NMR. 2002;23(2):127–37. doi: 10.1023/a:1016316415261. [DOI] [PubMed] [Google Scholar]
- 62.Wu B, et al. Prediction of molecular alignment of nucleic acids in aligned media. J Biomol NMR. 2006;35(2):103–15. doi: 10.1007/s10858-006-9004-2. [DOI] [PubMed] [Google Scholar]
- 63.Zweckstetter M, Hummer G, Bax A. Prediction of charge-induced molecular alignment of biomolecules dissolved in dilute liquid-crystalline phases. Biophys J. 2004;86(6):3444–60. doi: 10.1529/biophysj.103.035790. [DOI] [PMC free article] [PubMed] [Google Scholar]
- 64.Brooks BR, et al. CHARMM - a program for macromolecular energy minimization and dynamics calculations. J Comp Chem. 1983;4(2):187–217. [Google Scholar]
- 65.MacKerell AD, Banavali N, Foloppe N. Development and current status of the CHARMM force field for nucleic acids. Biopolymers. 2000;56(4):257–265. doi: 10.1002/1097-0282(2000)56:4<257::AID-BIP10029>3.0.CO;2-W. [DOI] [PubMed] [Google Scholar]
- 66.Feig M, Karanicolas J, Brooks CL. 223rd National Meeting of the American-Chemical-Society. Orlando, Fl: 2002. MMTSB Tool Set: enhanced sampling and multiscale modeling methods for applications in structural biology. [DOI] [PubMed] [Google Scholar]
- 67.Auffinger P, Westhof E. Biophys J. 2. Vol. 71. 1996. H-bond stability in the tRNA(Asp) anticodon hairpin: 3 ns of multiple molecular dynamics simulations; pp. 940–54. [DOI] [PMC free article] [PubMed] [Google Scholar]
- 68.Caves LS, Evanseck JD, Karplus M. Locally accessible conformations of proteins: multiple molecular dynamics simulations of crambin. Protein Sci. 1998;7(3):649–66. doi: 10.1002/pro.5560070314. [DOI] [PMC free article] [PubMed] [Google Scholar]
- 69.Prompers JJ, Bruschweiler R. General framework for studying the dynamics of folded and nonfolded proteins by NMR relaxation spectroscopy and MD simulation. JACS. 2002;124(16):4522–4534. doi: 10.1021/ja012750u. [DOI] [PubMed] [Google Scholar]
- 70.Showalter SA, Johnson E, Rance M, Bruschweiler R. Toward quantitative interpretation of methyl side-chain dynamics from NMR by molecular dynamics simulations. JACS. 2007;129(46):14146–14147. doi: 10.1021/ja075976r. [DOI] [PubMed] [Google Scholar]
- 71.Gherghe CM, Shajani Z, Wilkinson KA, Varani G, Weeks KM. Strong correlation between SHAPE chemistry and the generalized NMR order parameter (S-2) in RNA. JACS. 2008;130(37):12244–12245. doi: 10.1021/ja804541s. [DOI] [PMC free article] [PubMed] [Google Scholar]
- 72.Walter NG, Burke JM. Fluorescence assays to study structure, dynamics, and function of RNA and RNA-ligand complexes. Method Enzymol. 2000;317:409–40. doi: 10.1016/s0076-6879(00)17027-2. [DOI] [PubMed] [Google Scholar]