

Abstract
We have previously investigated the relative roles of extracellular glucose and lactate as fuels for glutamatergic neurons during synaptic activity. The conclusion from these studies was that cultured glutamatergic neurons utilize glucose rather than lactate during NMDA (N-methyl-d-aspartate)-induced synaptic activity and that lactate alone is not able to support neurotransmitter glutamate homoeostasis. Subsequently, a model was proposed to explain these results at the cellular level. In brief, the intermittent rises in intracellular Ca2+ during activation cause influx of Ca2+ into the mitochondrial matrix thus activating the tricarboxylic acid cycle dehydrogenases. This will lead to a lower activity of the MASH (malate–aspartate shuttle), which in turn will result in anaerobic glycolysis and lactate production rather than lactate utilization. In the present work, we have investigated the effect of an ionomycin-induced increase in intracellular Ca2+ (i.e. independent of synaptic activity) on neuronal energy metabolism employing 13C-labelled glucose and lactate and subsequent mass spectrometric analysis of labelling in glutamate, alanine and lactate. The results demonstrate that glucose utilization is positively correlated with intracellular Ca2+ whereas lactate utilization is not. This result lends further support for a significant role of glucose in neuronal bioenergetics and that Ca2+ signalling may control the switch between glucose and lactate utilization during synaptic activity. Based on the results, we propose a compartmentalized CiMASH (Ca2+-induced limitation of the MASH) model that includes intracellular compartmentation of glucose and lactate metabolism. We define pre- and post-synaptic compartments metabolizing glucose and glucose plus lactate respectively in which the latter displays a positive correlation between oxidative metabolism of glucose and Ca2+ signalling.
Keywords: Ca2+, glucose, lactate, malate–aspartate shuttle (MASH), neuron
Abbreviations: [Ca2+]I, intracellular concentration of Ca2+; CCN, cultured cerebellar neuron; MASH, Malate–Aspartate SHuttle; CiMASH, Ca2+-induced limitation of the MASH; fura 2/AM, fura 2 acetoxymethyl ester; LDH, lactate dehydrogenase; MCL, molecular carbon labelling; MTBSTFA, N-tertbutyl-dimethylsilyl-N-methyltrifluoroacetamide; NMDA, N-methyl-d-aspartate
INTRODUCTION
The main energy substrate for the brain is undoubtedly glucose, but whether glucose itself or glucose-derived lactate produced by nearby astrocytes is the preferred energy substrate for glutamatergic neurons during activation has been debated in recent years (for a recent review, see Dienel, 2011). The astrocyte–neuron lactate shuttle hypothesis suggests that during brain activation, astrocytes metabolize blood–borne glucose to lactate, which is then released and metabolized by nearby glutamatergic neurons during activation (Pellerin and Magistretti, 1994; Pellerin et al., 2007). Lactate is beyond any doubt an important (energy) substrate for neurons both in vitro and in vivo; most recently, it has been suggested that neuronal metabolism of (astrocyte-derived) lactate is important for memory formation (Newman et al., 2011; Suzuki et al., 2011); however, neurons in vivo may consume as much as 65% of the interstitial glucose (Zielke et al., 2007). We have previously shown that mouse cerebellar (glutamatergic) neurons in culture metabolize lactate avidly; however, utilization of glucose but not that of lactate was increased during NMDA (N-methyl-d-aspartate)-induced synaptic activity and, furthermore, lactate alone was not able to support neurotransmitter homoeostasis in these cells (Bak et al., 2006). Since synaptic activity is associated with an increase in the [Ca2+]i (intracellular concentration of Ca2+), a central regulator of key metabolic processes, we have previously proposed a model (Bak et al., 2009) in which Ca2+, after entry into the mitochondrial matrix, partially inhibits (i.e. limits the maximal activity) the MASH (malate–aspartate shuttle). This shuttle is believed to be of crucial importance for net transport of reducing equivalents across the inner mitochondrial membrane (McKenna et al., 2006). Such limitation of MASH activity increases cytosolic NADH and favours production of lactate and consumption of glucose via anaerobic glycolysis whereas utilization of lactate would be repressed. When the level of [Ca2+]i returns to resting levels between action potentials, the MASH would be reactivated causing a decrease in cytosolic NADH and both glucose and lactate may then be metabolized. The net result of this is that utilization of glucose increases with synaptic activity [see Figure 1 and Bak et al. (2009) for further details]. In the following, we will refer to this model as the CiMASH (Ca2+-induced limitation of the MASH) model. The previous work (Bak et al., 2006, 2009) was performed by inducing synaptic activity employing pulses of NMDA. In the present work, we aimed to investigate the effect of an isolated increase in [Ca2+]i (i.e. independent of synaptic activity) on neuronal utilization of glucose and lactate. To this end, we incubated cultured mouse cerebellar neurons [CCNs (cultured cerebellar neurons)] in the presence of [U-13C]glucose (2.5 mM), [U-13C]lactate (1.0 mM), and the combined presence of both substrates with only one of them labelled. Intracellular [Ca2+] was titrated employing ionomycin, and 13C labelling in intracellular glutamate, alanine and lactate was analysed by MS. The results suggest that utilization of glucose correlates positively with increasing [Ca2+]i, whereas lactate shows no such correlation; this indicates that intracellular Ca2+ signalling in neurons promotes utilization of glucose as energy substrate.
Figure 1. The CiMASH mechanism in glutamatergic neurons as originally described in Bak et al. (2009).

(A) Schematic depiction of a neuron showing possible mechanisms involved in regulation of glucose (glc) and lactate (lac) metabolism during neuronal depolarization and (B) the dynamics of glucose and lactate metabolism during re-polarization and at resting membrane potential. (C) A schematic depiction of cytosolic Ca2+ dynamics during neuronal spiking; arrows indicate when the CiMASH mechanism is operating. During neuronal depolarization (A), [Ca2+]i is increased via flux of Ca2+ through NMDA receptors and voltage-gated Ca2+ channels (VGCC) subsequently inducing release from endoplasmic reticulum (ER, 1). This triggers accumulation of Ca2+ in the mitochondrial matrix (2) and activation of α-ketoglutarate dehydrogenase (α-KGDH, 3), which competes with the malate/α-ketoglutarate carrier (MKC) for substrate thus limiting efflux of α-ketoglutarate (α-KG, 4). This leads to less α-ketoglutarate being available for the cytosolic aspartate aminotransferase (AATc) reaction (5) in turn limiting activity of cytosolic malate dehydrogenase (MDHc) and thus re-oxidation of cytosolic NADH (6). The increased cytosolic [NADH] together with decreased [ATP] will activate anaerobic glycolysis leading to lactate synthesis via the LDH reaction and re-oxidation of NADH (7). During this period, oxidation of lactate will be limited because of the increased [NADH] (8, 9). (B) During neuronal re-polarization and in the period between depolarizations where [Ca2+]i is low and MASH activity is restored, cytosolic [NAD+] will increase again. In conjunction with the increased [lactate] formed by anaerobic glycolysis, this will limit formation of lactate via the LDH reaction (10) whereas the opposite reaction is now favoured (11). The net effect at this point is formation of pyruvate (pyr) from glucose-derived lactate as well as extracellular lactate. Thus, extracellular lactate is only consumed during rest whereas glucose fuels the energy needed during neuronal depolarization. This latter part is now revised in the present paper (see Figure 8). c, cytosolic; m, mitochondrial; AGC, aspartate/glutamate carrier; Asp, aspartate; Glu, glutamate; GLUT, glucose transporter; Mal, malate; MCT, monocarboxylate transporter; OAA, oxaloacetate; TCA, tricarboxylic acid. Reproduced with permission from: LK Bak, AB Walls, A Schousboe, A Ring, U Sonnewald and HS Waagepetersen, Neuronal glucose but not lactate utilization is positively correlated with NMDA-induced neurotransmission and fluctuations in cytosolic Ca2+ levels, J Neurochem, 2009 Wiley-Blackwell. copyright 2009 The Authors Journal Compilation copyright 2009 International Society for Neurochemistry.
MATERIALS AND METHODS
Materials
Seven-day-old NMRI mice were acquired from Taconic M&B. Plastic culture flasks were purchased from NUNC A/S. Corning cellBIND surface 96-well plates as well as culture medium, poly-d-lysine (Mw>300 kg/mol), ionomycin, MTBSTFA (N-tertbutyl-dimethylsilyl-N-methyltrifluoroacetamide) containing 1% tertbutyl-dimethylchlorosilane were from Sigma–Aldrich. Fetal calf serum was purchased from Seralab Ltd, [U-13C]glucose and [U-13C]lactate from Cambridge Isotope Laboratories and penicillin from Leo Pharma. Fura 2/AM (fura 2 acetoxymethyl ester) was obtained from Invitrogen A/S. All other chemicals were of the purest grade available from regular commercial sources.
Cell culture
Primary cultures of murine cerebellar granule (glutamatergic) neurons (CCNs) were prepared as described previously (Schousboe et al., 1989). Briefly, cerebellum was excised from 7-day-old animals. The tissue was finely chopped, subjected to a gentle trypsinization (0.25 mg/ml trypsin for 15 min at 37°C) and triturated in a solution containing DNase [75 i.u. (international units)/ml] and trypsin inhibitor (0.53 mg/ml). The resulting cells were suspended in a modified Dulbecco's medium containing 24.5 mM KCl, 12 mM glucose, 7 μM p-aminobenzoate, 50 μM kainate and 10% (v/v) fetal calf serum to a total concentration of 2.75×10⁶ cells/ml and seeded in poly-d-lysine coated 25 cm2 culture flasks (5 ml per flask) or to a total concentration of 2.5×10⁶ cells/ml for seeding in poly-d-lysine coated 96-well plates (100 μl per well). The cultures were kept in a humidified atmosphere containing 5% CO2 at 37°C and employed for experiments after 7–8 days in vitro. In order to prevent astrocyte proliferation, cytosine arabinoside was added to a final concentration of 20 μM after 48 h in culture. Moreover, glucose was supplemented twice during culturing to ensure a minimum concentration of 12 mM. The presence of kainate blocks functional development of the subpopulation of GABAergic neurons (Drejer and Schousboe, 1989; Sonnewald et al., 2004, 2006) and its combination with cytosine arabinoside results in cultures containing 80–90% neurons exhibiting glutamatergic characteristics. Animals were handled according to Danish law and university policy under which no ethical approval is needed for the work carried out in this project.
Measurement of relative intracellular Ca2+ levels
The [Ca2+]i response to increasing concentrations of ionomycin was measured using the ratiometric Ca2+ probe fura-2 (Grynkiewicz et al., 1985). Cerebellar neurons seeded in 96-well plates were loaded by adding 5.2 μM fura-2/AM to the culture medium and incubating for 45 min in a humidified atmosphere containing 5% CO2 at 37°C. The cells were washed once with a Tris-buffered saline solution (15 mM Tris/HCl, 1 mM MgSO4, 140 mM NaCl, 3.5 mM KCl, 1.8 mM CaCl2, 5 mM glucose and 1.2 mM Na2PO4, pH 7.4) and left at room temperature (20°C) for 5 min to ensure complete de-esterification. The cultures were then incubated in a buffer identical with the Tris-buffered saline solution plus 0, 0.25, 0.5 or 0.75 μM ionomycin for 30 min. During both the de-esterification period and the experiment 10 μM of MK-801 and 30 μM verapamil were present in order to eliminate contributions from NMDA receptor stimulation (from any transmitter glutamate released due to the elevated [Ca2+]i) and L-type voltage-gated Ca2+ channels respectively. Employing a NOVOstar plate reader (BMG LABTECH GmbH), fura-2 was λex at 340 and 380 nm and the resulting λem was measured at 510 nm. All filters used had a bandwidth of 10 nm and the experimental temperature was 32°C. The results are calculated as the ratio of fluorescence from λex at 340 and 380 nm after background subtraction after 30 min of incubation. The data represent two batches of cerebellar neurons with 15 repetitions in total for each condition.
Metabolic experiments
Cultures of cerebellar neurons seeded in 25 cm2 flasks were washed twice with warm PBS (37°C; 137 mM NaCl, 2.7 mM KCl, 7.3 mM Na2HPO4, 1.5 mM KH2PO4, 0.9 mM CaCl2 and 0.5 mM MgCl2, pH 7.4) and incubated for 1.5 h at 37°C in serum-free culture medium containing either 2.5 mM [U-13C]glucose in the presence or absence of 1.0 mM unlabelled lactate (conditions A and C respectively) or 1.0 mM [U-13C]lactate in the presence or absence of 2.5 mM unlabelled glucose (conditions B and D respectively) as substrates. In order to titrate [Ca2+]i, increasing concentrations of ionomycin (0, 0.25, 0.50 and 0.75 μM) were present during the last 30 min in combination with 10 μM MK-801 and 30 μM verapamil. Some cultures were placed in a superfusion apparatus and superfused (4 ml/min) in a Hepes-buffered medium (5 mM Hepes, 135 mM NaCl, 5 mM KCl, 1.8 mM CaCl2 and 2.5 mM glucose, pH 7.4, 37°C; MK-801 and verapamil were not present in these experiments) for 10 min at which time the medium was switched to one containing 2.5 mM [U-13C]glucose in place of the unlabelled glucose and superfused for an additional 50 min. Ten 30-s pulses (4 min intervals) of NMDA (100 μM) and glycine (10 μM) were included in some cultures to induce neurotransmission activity (Bak et al., 2003). The medium was collected in fractions (12 ml corresponding to 3 min) for determination of lactate release. After the experiments, the cultures were extracted using 70% ethanol and the resulting isotopic enrichment in intracellular glutamate, alanine and lactate was determined using GC-MS.
Analytical chemistry and analysis of labelling data
Freeze-dried cell extracts were dissolved in water and an aliquot was dried under atmospheric air. The metabolites were extracted into an organic phase of ethanol and benzene and dried again before derivatization with MTBSTFA containing 1% tertbutyl-dimethylchlorosilane in DMF (dimethylformamide; Mawhinney et al., 1986). The samples were analysed using a Shimadzu GCMS-QP2010 Plus system (Shimadzu Corp.) equipped with a Zebron-5MS column from Phenomenex. Percent isotopic enrichment of glutamate, alanine and lactate was determined after correcting for naturally abundant 13C as described by Biemann (1962).
Details on labelling of glutamate, alanine and lactate from [U-13C]glucose and [U-13C]lactate are available elsewhere (e.g. Bak et al., 2006) and the labelling in glutamate is presented as percentage MCL (molecular carbon labelling) as explained in Bak et al. (2006). In short, the MCL value is an average of the percentage 13C labelling in a given metabolite. For instance, an MCL value of 20% means that 20% of all carbon atoms in the glutamate pool are 13C. Since incorporation of 13C into alanine arises through rapid transamination of pyruvate and as such reflects labelling in this metabolite, both syntheses of pyruvate from lactate and glucose contribute to the average molecular labelling. Hence, the percentage M+3 (i.e. the 12C monoisotopic mass plus three) for alanine indicates the direct conversion of uniformly labelled glucose or lactate into alanine through pyruvate and is therefore presented here. Likewise, lactate labelling should be presented as percentage M+3. However, due to a constant contamination of the lactate signal on the GC-MS from the derivatization reagent, the percentage M+3 values for lactate are presented as percentage of control within each batch of neurons.
In order to obtain information on tricarboxylic acid cycle activity, CRs (cycling ratios) were calculated based on labelling in glutamate according to the following formula: ([M+1]+[M+3]+[M+4]+[M+5]/[M+2]), i.e. the labelling occurring in two or more turns of the tricarboxylic acid cycle divided by the labelling occurring after the first turn (see Bak et al., 2006 for details).
The amount of lactate released to the media during superfusion of CCNs was quantified as previously detailed by Lund et al. (2011). Briefly, the collected superfusion media were freeze-dried and re-dissolved in water. Black microtitre plates were used for conversion of lactate present in the sample by LDH (lactate dehydrogenase). In this reaction, NAD+ is concomitantly reduced to NADH that can be detected due to its autofluorescence (350 and 455 nm as λex and λem respectively). In order for the reaction to be stoichiometric, pyruvate formed from lactate was further transaminated to alanine by alanine aminotransferase in the presence of glutamate. l-Lactate was used as a standard.
The results are presented as means±S.E.M. Data were compared by Student's t test or one-way ANOVA followed by either Bonferroni (<5 groups) or Tukey–Kramer (≥5 groups) post hoc tests. A P-value of 0.05 or less was considered statistically significant. Data were analysed employing Microsoft Excel 2010 and GraphPad Prism 5 software.
RESULTS
Titration of intracellular Ca2+
Ionomycin, which is commonly employed as a Ca2+ ionophore to elevate [Ca2+]i (Liu and Hermann, 1978; Nicholls, 2006), was used to titrate [Ca2+]i in CCNs. The ratio of fura-2 fluorescence intensity measured at 510 nm after λex at 340 and 380 nm increased significantly in the measured range of ionomycin concentrations (Figure 2), indicating that ionomycin may be employed as a tool to investigate the metabolic response to increasing levels of [Ca2+]i.
Figure 2. Effect of ionomycin on the intracellular Ca2+ concentration.

Cultures of cerebellar neurons were exposed to increasing concentrations of ionomycin for 30 min and the resulting effect on the intracellular Ca2+ concentration was measured employing the ratiometric Ca2+ sensitive dye fura-2. The results are displayed as the ratio of emitted light at 550 nm after λex at 340 and 380 nm and each bar represents the means±S.E.M. Data were obtained from two individual batches of cerebellar neurons with 14–15 repetitions in total for each condition. a, b, c, d and e denotes differences from 0, 0.2, 0.4, 0.6 and 0.8 μM ionomycin respectively (one-way ANOVA followed by Tukey–Kramer post hoc test). Ionomycin dose-dependently increases the intracellular Ca2+ concentration.
As discussed by Nicholls (2006), ionomycin will not only facilitate Ca2+ entry across the plasma membrane but also be embedded in the inner mitochondrial membrane (and other internal membranes) inducing Ca2+ fluxes across the mitochondrial inner membrane as well; this may lead to Ca2+ deregulation in cultured cells including cultured neurons. However, this effect is both time- and concentration-dependent and primarily observed at ionomycin concentrations above 1 μM (Nicholls, 2006). Still, it should be mentioned that even at the levels of ionomycin employed in this study, there might be a direct effect on bioenergetics since Ca2+ cycling across the inner mitochondrial membrane is linked to the proton gradient (Nicholls, 2006). The present work demonstrates that it is possible to employ ionomycin to dose-dependently manipulate [Ca2+]i levels in CCNs making ionomycin a valuable tool to study the metabolic consequences of Ca2+ signalling independent of neuronal depolarization. It should be mentioned that both the mitochondrial and plasma membrane potentials might be affected by ionomycin; however, based on the work by Nicholls (2006) we conclude that at the exposure time and concentration of ionomycin employed in the present work, the effects on these parameters as well as induction of Ca2+ deregulation are minimal.
Metabolic experiments
CCNs were incubated for 1 h in the presence of [U-13C]glucose (2.5 mM) and lactate (1 mM; panel A in Figures 3–6); [U-13C]lactate and glucose (panel B), [U-13C]glucose (panel C) or [U-13C]lactate (panel D) followed by 30 min in the additional presence of increasing concentrations of ionomycin (0, 0.25, 0.5, 0.75 μM). The resulting 13C labelling was analysed by MS (see the Materials and methods section) in intracellular glutamate (Figure 3), alanine (Figure 4) and lactate (Figure 5). In the presence of unlabelled lactate, ionomycin-dependent increases in 13C labelling from [U-13C]glucose were observed in glutamate, alanine and lactate (panel A in Figures 3–5 respectively). Since glutamate is in rapid equilibrium with tricarboxylic acid cycle-derived (13C-labelled) α-ketoglutarate under these conditions (Berkich et al., 2005), the increase in glutamate labelling suggests that glycolysis plus tricarboxylic acid cycle activity is up-regulated by ionomycin. Labelling in alanine reflects labelling in the associated pyruvate pool derived from either glucose (via glycolysis) or lactate (via the LDH reaction). Thus, the ionomycin-dependent increase in alanine M+3 (Figure 4A) in combination with the increase in [U-13C]glucose-derived lactate M+3 (Figure 5A) reflects increased glycolysis under these conditions. In the presence of [U-13C]lactate and unlabelled glucose, ionomycin-dependent decreases in 13C-labelling were observed in glutamate (Figure 3B) and alanine (Figure 4B), but not lactate (Figure 5B). This suggests that extracellular lactate is metabolized independently of ionomycin-induced effects on [Ca2+]i and glycolysis and that the decrease in labelling in glutamate and alanine reflects increased synthesis of glucose-derived pyruvate. In the presence of [U-13C]glucose as the sole substrate, the labelling in glutamate (Figure 3C) was higher than when unlabelled lactate was present (compare with Figure 3A). This indicates that the (labelled) pyruvate pool is diluted by unlabelled lactate or in other words that extracellular lactate is metabolized to a significant extent even in the presence of glucose. Interestingly, labelling in alanine was not affected by ionomycin (Figure 4C), which was in contrast with lactate that showed a rather large relative response (Figure 5C). Thus, in the presence of glucose only, labelled lactate is being generated from a pyruvate pool in which the labelling (via glycolytic activity) is strongly dependent on ionomycin-induced increases in [Ca2+]i; however, this pool is so small that it is not evident from the labelling in the bulk pyruvate pool reflected by labelling in alanine. When [U-13C]lactate was the only substrate available, labelling in both glutamate and (intracellular) lactate was not affected by ionomycin whereas labelling in alanine showed decreases (Figures 3D, 5D and 4D, respectively). This might indicate that tricarboxylic acid cycle metabolism of lactate-derived carbon is unaffected by ionomycin; however, the drop in alanine labelling is not easily explained.
Figure 3. Effect of ionomycin on 13C-labelling from [U-13C]glucose and [U-13C]lactate into intracellular glutamate.

Cultures of cerebellar neurons were incubated for 1 h with either 2.5 mM [U-13C]glucose in the presence or absence of 1 mM unlabelled lactate (A and C respectively) or 1 mM [U-13C]lactate in the presence or absence of 2.5 mM unlabelled glucose (B and D respectively) as substrates. In order to titrate the intracellular Ca2+ level, increasing concentrations of ionomycin (0, 0.25, 0.50 and 0.75 μM) were present during the last 30 min of incubation in combination with 10 μM MK-801 and 30 μM verapamil. The resulting 13C-enrichment in intracellular glutamate was determined by GC-MS. The results are displayed as percentage MCL, which is a measure of the average 13C-labelling of a given metabolite. The data were obtained from 2 to 4 individual batches of cerebellar neurons with 5–14 repetitions in total for each condition and the bars represent means±S.E.M. Significant differences (P<0.05, one-way ANOVA followed by Bonferroni's post hoc test) from 0 and 0.25 μM ionomycin are indicated by a and b, respectively. 13C-Labelling from glucose into glutamate is enhanced by ionomycin-induced increased intracellular Ca2+ concentration both in the presence and absence of lactate (A and C respectively). This signifies increased glycolysis and tricarboxylic acid cycle activity since glutamate is in rapid equilibrium with the tricarboxylic acid cycle intermediate α-ketoglutarate. In contrast, 13C-labelling from lactate is decreased by ionomycin in the presence but not in the absence of glucose (B and D respectively). Collectively these results indicate that extracellular lactate is metabolized independently of Ca2+-induced effects on glycolysis and tricarboxylic acid cycle activity, the latter causing dilution of 13C-labelling from increased metabolism of unlabelled glucose when present.
Figure 6. Effect of ionomycin on tricarboxylic acid cycle activity.

Cultures of cerebellar neurons were incubated for 1 h with either 2.5 mM [U-13C]glucose in the presence or absence of 1 mM unlabelled lactate (A and C respectively) or 1 mM [U-13C]lactate in the presence or absence of 2.5 mM unlabelled glucose (B and D respectively) as substrates. In order to titrate the intracellular Ca2+ level, increasing concentrations of ionomycin (0, 0.25, 0.50 and 0.75 μM) were present during the last 30 min of incubation in combination with 10 μM MK-801 and 30 μM verapamil. The resulting 13C-enrichment in intracellular glutamate was determined by GC-MS. Based on the isotopomeric 13C-labelling of glutamate, the CR, which is a measure of the activity of the tricarboxylic acid cycle, was calculated as described in the Materials and Methods section. The data were obtained from 2 to 4 individual batches of cerebellar neurons with 5–14 repetitions in total for each condition and the bars represent means±S.E.M. Significant differences (P<0.05, one-way ANOVA followed by Bonferroni's post hoc test) from 0 to 0.25 μM ionomycin are indicated by a and b, respectively. Irrespective of the presence of extracellular lactate, the rate of [U-13C]glucose metabolism in the tricarboxylic acid cycle increases with increasing ionomycin-induced intracellular Ca2+ levels (A and C). However, with the exception of 0.25 μM ionomycin in the presence of glucose, the metabolism of lactate through the tricarboxylic acid cycle is unaffected by ionomycin (B and D).
Figure 4. Effect of ionomycin on 13C-labelling from [U-13C]glucose and [U-13C]lactate into intracellular alanine.

Cultures of cerebellar neurons were incubated for 1 h with either 2.5 mM [U-13C]glucose in the presence or absence of 1 mM unlabelled lactate (A and C respectively) or 1 mM [U-13C]lactate in the presence or absence of 2.5 mM unlabelled glucose (B and D respectively) as substrates. In order to titrate the intracellular Ca2+ level, increasing concentrations of ionomycin (0, 0.25, 0.50 and 0.75 μM) were present during the last 30 min of incubation in combination with 10 μM MK-801 and 30 μM verapamil. The resulting 13C-enrichment in intracellular alanine was determined by GC-MS. The results are displayed as the 13C-enrichment of the M+3 isotopomer, i.e. alanine labelled in all three carbon atoms that originate directly from [U-13C]glucose- or [U-13C]lactate-derived pyruvate via transamination. The data were obtained from 3 to 4 individual batches of cerebellar neurons with 5–14 repetitions in total for each condition and the bars represent means±S.E.M. Significant differences (P<0.05, one-way ANOVA followed by Bonferroni's post hoc test) from 0 and 0.25 μM ionomycin are indicated by a and b, respectively. 13C-labelling from glucose into alanine is enhanced by ionomycin-induced increased intracellular Ca2+ concentration in the presence but not the absence of lactate (A and C respectively). Moreover, the 13C-labelling from glucose is substantially higher in the absence than in the presence of unlabelled lactate. Since 13C-labelling in alanine reflects that of pyruvate, these findings indicate not only Ca2+-induced up-regulation of glycolytic activity but also that lactate is extensively metabolized even in unstimulated neurons. When lactate is the labelled substrate, ionomycin brings about a decrease in 13C-labelling in alanine in the presence of glucose (B). This might be explained by dilution of labelling due to metabolism of unlabelled glucose, although the corresponding decrease observed in the absence of glucose (D) argues against this.
Figure 5. Effect of ionomycin on 13C-labelling from [U-13C]glucose and [U-13C]lactate into intracellular lactate.

Cultures of cerebellar neurons were incubated for 1 h with either 2.5 mM of [U-13C]glucose in the presence or absence of 1 mM unlabelled lactate (A and C respectively) or 1 mM [U-13C]lactate in the presence or absence of 2.5 mM unlabelled glucose (B and D respectively) as substrates. In order to titrate the intracellular Ca2+ level, increasing concentrations of ionomycin (0, 0.25, 0.50 and 0.75 μM) were present during the last 30 min of incubation in combination with 10 μM MK-801 and 30 μM verapamil. The resulting 13C-enrichment in intracellular lactate was determined by GC-MS. The results are displayed as the 13C-enrichment of the M+3 isotopomer, i.e. lactate labelled in all three carbon atoms that originate directly from [U-13C]glucose- or [U-13C]lactate-derived pyruvate via the action of LDH. In addition, the data are expressed as percentage of control within each batch of neurons. The data were obtained from 2 individual batches of cerebellar neurons with 4–8 repetitions in total for each condition and the bars represent means±S.E.M. Significant differences (P<0.05, one-way ANOVA followed by Bonferroni's post hoc test) from 0 and 0.25 μM ionomycin are indicated by a and b, respectively. 13C-Labelling from glucose into lactate is enhanced by ionomycin-induced increased intracellular Ca2+ concentration both in the presence and absence of extracellular lactate (A and C respectively). This signifies increased glycolytic activity since labelling in lactate reflects that of pyruvate. In contrast, ionomycin has no effect on 13C-labelling of intracellular lactate from the extracellular pool of the same metabolite (B and D).
In order to obtain information about tricarboxylic acid cycle activity under the experimental conditions employed, we calculated the CRs for each experimental condition (see the Materials and methods section and Bak et al. (2006) for details). The CR in the presence of [U-13C]glucose and unlabelled lactate increased significantly as a consequence of treatment with ionomycin (Figure 6A), whereas no effect of ionomycin was evident when lactate was the labelled substrate in the presence of unlabelled glucose (Figure 6B) except for a small but significant increase in the presence of 0.25 μM ionomycin. When only [U-13C]glucose or [U-13C]lactate was present, the CRs were higher compared with when both substrates were present (compare panels C and D to A and B in Figure 6); however, ionomycin-dependent increases were only evident when [U-13C]glucose but not when [U-13C]lactate was the sole substrate (Figures 6C and 6D respectively). Collectively, this indicates metabolic compartmentation and that the tricarboxylic acid cycle metabolizing glucose-derived carbon increases cycling activity whereas the tricarboxylic acid cycle that metabolizes lactate-derived carbon operates at a constant level of activity independent of the metabolic response to the ionomycin-induced increase in [Ca2+]i.
In a separate experiment, CCNs were superfused in the presence of 2.5 mM glucose (no lactate) and subjected to pulses of NMDA (100 μM; plus 10 μM glycine) to induce Ca2+-dependent neurotransmission activity as previously described (see the Materials and methods and Bak et al., 2003; 2009 for further details). The superfusion medium was collected in fractions and the release of lactate was quantified by measuring the content of lactate in these fractions. The release (nmol·min−1·mg−1 of protein) was significantly increased when the cultures were subjected to pulses of NMDA (Figure 7), indicating increased anaerobic glycolysis.
Figure 7. NMDA-induced release of lactate from CCNs during superfusion in the presence of 2.5 mM glucose.
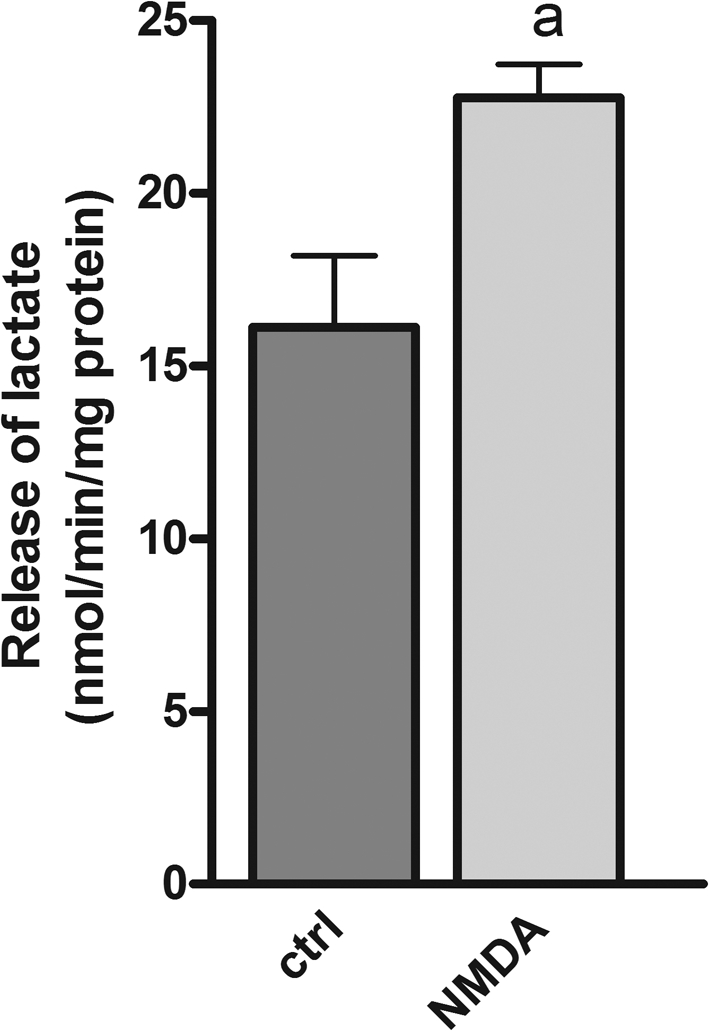
CCNs were superfused (2 ml/min) in a Hepes-buffered medium containing glucose (2.5 mM) as substrate and subjected to 30-s pulses consisting of NMDA (100 μM) and glycine (10 μM). The rate of lactate release was quantified as described in the Materials and methods section and expressed as nmol of lactate released per min per mg of protein. a; significantly different from the control (i.e. no NMDA pulses) as determined employing Student's t test (P<0.05).
DISCUSSION
We show here that neuronal glucose utilization is increased by an ionomycin-dependent increase in [Ca2+]i, mimicking neuronal Ca2+ signalling, whereas utilization of extracellular lactate is prominent but not significantly affected by Ca2+ signalling; these observations are in line with the CiMASH model (Figure 1) and furthermore suggestive of compartmentalized glucose and lactate metabolism. We present a revised CiMASH model in which metabolic compartmentation is taken into account, dividing the neuron into two metabolic compartments: a presynaptic compartment metabolizing glucose and a postsynaptic compartment metabolizing both glucose and lactate.
Ca2+-dependent regulation of glucose and lactate utilization
The observation that glucose utilization increases and lactate utilization decreases as a consequence of the presence of ionomycin (Figures 3A and 3B) mimics the previous findings that neuronal glycolysis and subsequent tricarboxylic acid cycle metabolism are up-regulated during NMDA-induced activation (Bak et al., 2006) and that consumption of glucose but not lactate correlates with neurotransmission activity (Bak et al., 2009). Here, we support and extend the earlier findings by demonstrating that the effects on metabolism previously reported as a consequence of NMDA receptor stimulation are mirrored by an ionomycin-induced increase in [Ca2+]i.
13C-Labelling in lactate when [U-13C]glucose is the sole substrate reflects labelling in glycolysis-generated pyruvate that is transformed into lactate by the reversible LDH-catalysed reaction. Thus, an increased labelling in lactate per se may not reflect net lactate production but simply increased glycolytic activity. However, comparing labelling from [U-13C]glucose into glutamate, lactate and alanine it is apparent that the relative increase in lactate labelling is greater for all ionomycin concentrations than the corresponding glutamate and alanine labelling in the presence of extracellular lactate. This clearly demonstrates that anaerobic glycolysis is amplified by ionomycin, resulting in net lactate production. That increased lactate production and release is indeed taking place in these cultures during neurotransmission activity is evident from the increase in the rate of lactate release when the cultures were subjected to pulses of NMDA (Figure 7).
In contrast to the labelling in lactate derived from [U-13C]glucose, labelling from extracellular [U-13C]lactate into intracellular lactate was unaffected by ionomycin (Figures 5B and 5D). Since the transfer of lactate between the intra- and extra-cellular environments is primarily controlled by the concentration gradient across the plasma membrane one would expect a decrease in uptake of extracellular lactate when glucose is present due to production of glucose-derived lactate and, hence, decreased labelling with increasing [Ca2+]i. However, taken together with the increase in lactate labelled from [U-13C]glucose, these data indicate a compartmentalization of the lactate produced from glucose and the extracellular lactate pool where the former is preferentially transported out of the cell independently of the import and utilization of the latter. Seemingly opposing this conclusion is a decrease in 13C enrichment from extracellular [U-13C]-lactate into glutamate and alanine observed when unlabelled glucose is present (Figures 3B and 4B). However, the decreased labelling in glutamate (Figure 3B) is probably due to dilution of labelling in the acetyl-CoA pool as a consequence of increased glycolytic degradation of glucose, which is also supported by the unaltered labelling from [U-13C]lactate into glutamate when glucose is absent (Figure 5D). The reduced labelling in alanine (Figure 4B) is possibly due to pyruvate being increasingly transported into the mitochondria to support augmented tricarboxylic acid cycling; this would likely occur at the expense of alanine production, as in fact seems to be the case (Figure 4D). Furthermore, a reduced alanine production would entail an even more pronounced decrease in alanine labelling from extracellular [U-13C]lactate compared with labelling in glutamate, which is also apparent from the present experiments (compare Figures 3D and 4D). However, dilution of labelling due to the presence of glucose cannot explain the decrease in 13C incorporation into alanine from [U-13C]lactate observed when glucose is absent (Figure 4D). This decrease might be due to a reduced production of alanine combined with an increase in pyruvate recycling activity initiated as a rescue operation to keep tricarboxylic acid cycling going at the expense of tricarboxylic acid cycle intermediates (Olstad et al., 2007); if this is indeed the case, it clearly signifies that glucose is needed to sustain energy metabolism during Ca2+-induced activation.
From the above considerations, one might envisage a scenario in which two pools of mitochondria exist at the postsynaptic region, one primarily but not exclusively metabolizing extracellular lactate-derived carbon (denoted type A in Figure 8) and one metabolizing glucose-derived carbon including glucose-derived lactate (type B); type A is insensitive whereas type B is sensitive to fluctuations in [Ca2+]i. This might be caused by the fact that for mitochondria to be sensitive to Ca2+ signalling, they have to be closely associated with the endoplasmic reticulum (Franzini-Armstrong, 2007); thus, a pool of postsynaptic mitochondria may not be closely associated with the endoplasmic reticulum, likely reflecting a mobile or moving fraction of mitochondria (MacAskill et al., 2010). It has been suggested that presynaptic terminals contain no MCTs (monocarboxylate transporters) necessary for import and export of lactate (Bergersen et al., 2005). Thus, presynaptic terminals may be fuelled only by oxidative glycolysis (the pyruvate generated is oxidized in the type C mitochondrial compartment in Figure 8) and glycolytically produced ATP (substrate-level phosphorylation) may play an important role in providing energy for presynaptic glutamate uptake and vesicular filling (Ikemoto et al., 2003; Bak et al., 2006; Schousboe et al., 2011).
Figure 8. A compartmentalized CiMASH model for glutamatergic neurons.

In the compartmentalized model, the CiMASH mechanism is working in the postsynaptic compartment in which NMDA-receptor-mediated Ca2+-induced Ca2+ release from the endoplasmic reticulum (ER) directly signals to a subset of postsynaptic mitochondria (type B) that increase their tricarboxylic acid cycle activity driven by breakdown of glucose-derived pyruvate (pyr). Notice that glucose-derived pyruvate is only in partial equilibrium with lactate (Lac)-generated pyruvate. When the CiMASH mechanism is activated, glucose-derived lactate is produced and released to the extracellular space for oxidation at a later time point. Pyruvate derived from extracellular lactate is metabolized in a mitochondrial compartment that is not affected by postsynaptic Ca2+ signalling (type A). At the presynaptic compartment, the voltage-gated Ca2+ channel (VGCC)-activated ER-to-mitochondria Ca2+-signalling will affect mitochondrial tricarboxylic acid cycle metabolism (type C) of glucose-derived pyruvate and activate the CiMASH mechanism to some extent; the lactate generated in this compartment is not able to leave the cell due to lack of transporters. It should be noted that substrate-level phosphorylation in the glycolytic pathway probably plays a functionally important role at the presynaptic terminal (not shown here).
A model of compartmentalized, Ca2+-dependent neuronal bioenergetics
The above considerations may lead to a revised model, in which the CiMASH mechanism is primarily operating in the postsynaptic compartment (Figure 8). In this model, the following sequence of events may take place during neurotransmission activity. Upon depolarization, the presynaptic terminal will consume glycolytic energy producing an intracellular store of lactate (presuming they have no MCTs) for later oxidation; this is caused by the idea that the immediate need for ATP for vesicular filling and in particular presynaptic glutamate uptake is produced by glycolysis, not mitochondrial oxidative metabolism (cf. above). At the postsynaptic end, NMDA-induced depolarization and the associated spike in [Ca2+]i induce the CiMASH mechanism, resulting in anaerobic glycolysis and lactate production, a fraction of which will be released to the extracellular environment and serve as an extracellular fuel reservoir; the latter may be in accordance with the ‘reverse’ lactate shuttle suggested by Mangia et al. (2009) as well as the suggestion by Gandhi et al. (2009) of astrocytic uptake of lactate, subsequent dispersion via the astrocytic syncytium and eventual discharge in a different location. In the type B mitochondrial compartment, increased cycling activity results in increased utilization of acetyl-CoA derived from glucose, whereas in the type A mitochondrial compartment, metabolism of lactate-derived acetyl-CoA will remain constant. Upon neuronal re-polarization, the neuronal utilization of the lactate produced during the depolarization event will increase due to the normalization of the MASH activity. During intense neuronal firing, the CiMASH mechanism would be even more pronounced, since fluctuations in the intramitochondrial [Ca2+] may not keep up with the rapid cytosolic spiking and mitochondria will accumulate Ca2+ and maintain an elevated intramitochondrial [Ca2+] for a longer period of time (Kaftan et al., 2000). As a final note, it is clear from the above discussion that the model reflects not only data presented in this manuscript but includes work from a number of laboratories as well as some aspects that are somewhat speculative. The task is now to test and if necessary modify the model based on both in vitro and eventually in vivo experiments.
Conclusion
The interpretation of the data presented in this paper lends further support to the CiMASH model and, furthermore leads to a model in which the CiMASH mechanism is operating at the postsynaptic compartment. Current studies are directed towards elucidating the second-messenger signalling pathways involved and establishing the subcellular localization of the CiMASH mechanism including postsynaptic mitochondrial dynamics.
ACKNOWLEDGEMENTS
Skilled technical assistance by Heidi Nielsen, Lene Vigh, Joan T. Borgholm and Grete Sφrensen as well as expert advice from Dr Avi Ring, Norwegian Defense Research Establishment, Oslo, Norway, is cordially acknowledged.
Footnotes
This work was funded by the Danish Medical Research Council [grant numbers 09-063393, 09-066319].
REFERENCES
- Bak LK, Schousboe A, Waagepetersen HS. Characterization of depolarization-coupled release of glutamate from cultured mouse cerebellar granule cells using DL-threo-beta-benzyloxyaspartate (DL-TBOA) to distinguish between the vesicular and cytoplasmic pools. Neurochem Int. 2003;43:417–424. doi: 10.1016/s0197-0186(03)00030-5. [DOI] [PubMed] [Google Scholar]
- Bak LK, Schousboe A, Sonnewald U, Waagepetersen HS. Glucose is necessary to maintain neurotransmitter homeostasis during synaptic activity in cultured glutamatergic neurons. J Cereb Blood Flow Metab. 2006;26:1285–1297. doi: 10.1038/sj.jcbfm.9600281. [DOI] [PubMed] [Google Scholar]
- Bak LK, Walls AB, Schousboe A, Ring A, Sonnewald U, Waagepetersen HS. Neuronal glucose but not lactate utilization is positively correlated with NMDA-induced neurotransmission and fluctuations in cytosolic Ca2+ levels. J Neurochem. 2009;109((Suppl. 1)):87–93. doi: 10.1111/j.1471-4159.2009.05943.x. [DOI] [PubMed] [Google Scholar]
- Bergersen LH, Magistretti PJ, Pellerin L. Selective postsynaptic co-localization of MCT2 with AMPA receptor GluR2/3 subunits at excitatory synapses exhibiting AMPA receptor trafficking. Cereb Cortex. 2005;15:361–370. doi: 10.1093/cercor/bhh138. [DOI] [PubMed] [Google Scholar]
- Berkich DA, Xu Y, LaNoue KF, Gruetter R, Hutson SM. Evaluation of brain mitochondrial glutamate and alpha-ketoglutarate transport under physiologic conditions. J Neurosci Res. 2005;79:106–113. doi: 10.1002/jnr.20325. [DOI] [PubMed] [Google Scholar]
- Biemann K. Mass Spectrometry: Organic Chemical Applications. New York: McGraw-Hill; 1962. The mass spectra of isotopically labeled molecules. pp. 223–227. [Google Scholar]
- Dienel GA. Brain lactate metabolism: the discoveries and the controversies. J Cereb Blood Flow Metab. 2011 doi: 10.1038/jcbfm.2011.175. [DOI] [PMC free article] [PubMed] [Google Scholar]
- Drejer J, Schousboe A. Selection of a pure cerebellar granule cell culture by kainate treatment. Neurochem Res. 1989;14:751–754. doi: 10.1007/BF00964953. [DOI] [PubMed] [Google Scholar]
- Franzini-Armstrong C. ER-Mitochondria communication. How privileged? Physiology. 2007;22:261–268. doi: 10.1152/physiol.00017.2007. [DOI] [PubMed] [Google Scholar]
- Gandhi GK, Cruz NF, Ball KK, Dienel GA. Astrocytes are poised for lactate trafficking and release from activated brain and for supply of glucose to neurons. J Neurochem. 2009;111:522–36. doi: 10.1111/j.1471-4159.2009.06333.x. [DOI] [PMC free article] [PubMed] [Google Scholar]
- Grynkiewicz G, Poenie M, Tsien RY. A new generation of Ca2+ indicators with greatly improved fluorescence properties. J Biol Chem. 1985;260:3440–50. [PubMed] [Google Scholar]
- Ikemoto A, Bole DG, Ueda T. Glycolysis and glutamate accumulation into synaptic vesicles – role of glyceraldehyde phosphate dehydrogenase and 3-phosphoglycerate kinase. J Biol Chem. 2003;278:5929–5940. doi: 10.1074/jbc.M211617200. [DOI] [PubMed] [Google Scholar]
- Kaftan EJ, Xu T, Abercrombie RF, Hille B. Mitochondria shape hormonally induced cytoplasmic calcium oscillations and modulate exocytosis. J Biol Chem. 2000;275:25465–25470. doi: 10.1074/jbc.M000903200. [DOI] [PubMed] [Google Scholar]
- Liu CM, Hermann TE. Characterization of ionomycin as a calcium ionophore. J Biol Chem. 1978;253:5892–5894. [PubMed] [Google Scholar]
- Lund TM, Obel LF, Risa O, Sonnewald U. β-Hydroxybutyrate is the preferred substrate for GABA and glutamate synthesis while glucose is indispensable during depolarization in cultured GABAergic neurons. Neurochem Int. 2011;59:309–318. doi: 10.1016/j.neuint.2011.06.002. [DOI] [PubMed] [Google Scholar]
- MacAskill AF, Atkin TA, Kittler JT. Mitochondrial trafficking and the provision of energy and calcium buffering at excitatory synapses. Eur J Neurosci. 2010;32:231–240. doi: 10.1111/j.1460-9568.2010.07345.x. [DOI] [PubMed] [Google Scholar]
- Mangia S, Simpson IA, Vannucci SJ, Carruthers A. The in vivo neuron-to-astrocyte lactate shuttle in human brain: evidence from modeling of measured lactate levels during visual stimulation. J Neurochem. 2009;109((Suppl. 1)):55–62. doi: 10.1111/j.1471-4159.2009.06003.x. [DOI] [PMC free article] [PubMed] [Google Scholar]
- Mawhinney TP, Robinett RS, Atalay A, Madson MA. Analysis of amino acids as their tert-butyldimethylsilyl derivatives by gas-liquid chromatography and mass spectrometry. J Chromatogr. 1986;358:231–242. doi: 10.1016/s0021-9673(01)90333-4. [DOI] [PubMed] [Google Scholar]
- McKenna MC, Waagepetersen HS, Schousboe A, Sonnewald U. Neuronal and astrocytic shuttle mechanisms for cytosolic-mitochondrial transfer of reducing equivalents: current evidence and pharmacological tools. Biochem Pharmacol. 2006;71:399–407. doi: 10.1016/j.bcp.2005.10.011. [DOI] [PubMed] [Google Scholar]
- Newman LA, Korol DL, Gold PE. Lactate produced by glycogenolysis in astrocytes regulates memory processing. PLoS One. 2011;6:e28427. doi: 10.1371/journal.pone.0028427. [DOI] [PMC free article] [PubMed] [Google Scholar]
- Nicholls DG. Simultaneous monitoring of ionophore- and inhibitor-mediated plasma and mitochondrial membrane potential changes in cultured neurons. J Biol Chem. 2006;281:14864–14874. doi: 10.1074/jbc.M510916200. [DOI] [PubMed] [Google Scholar]
- Olstad E, Olsen GM, Qu H, Sonnewald U. Pyruvate recycling in cultured neurons from cerebellum. J Neurosci Res. 2007;85:3318–25. doi: 10.1002/jnr.21208. [DOI] [PubMed] [Google Scholar]
- Pellerin L, Bouzier-Sore AK, Aubert A, Serres S, Merle M, Costalat R, Magistretti PJ. Activity-dependent regulation of energy metabolism by astrocytes: an update. Glia. 2007;55:1251–1262. doi: 10.1002/glia.20528. [DOI] [PubMed] [Google Scholar]
- Pellerin L, Magistretti PJ. Glutamate uptake into astrocytes stimulates aerobic glycolysis: a mechanism coupling neuronal activity to glucose utilization. Proc Natl Acad Sci USA. 1994;91:10625–10629. doi: 10.1073/pnas.91.22.10625. [DOI] [PMC free article] [PubMed] [Google Scholar]
- Schousboe A, Meier E, Drejer J, Hertz L. Preparation of primary cultures of mouse (rat) cerebellar granule cells. In: Shahar A, de Vellis J, Vernadakis A, Haber B, editors. In A Dissection and Tissue Culture Manual for the Nervous System. New York: Alan R. Liss; 1989. pp. 183–186. [Google Scholar]
- Schousboe A, Sickmann HM, Bak LK, Schousboe I, Jajo FS, Faek SAA, Waagepetersen HS. Neuron-Glia interactions in glutamatergic neurotransmission: roles of oxidative and glycolytic adenosine triphosphate as energy source. J Neurosci Res. 2011;89:1926–1934. doi: 10.1002/jnr.22746. [DOI] [PubMed] [Google Scholar]
- Sonnewald U, Kortner TM, Qu H, Olstad E, Sunol C, Bak LK, Schousboe A, Waagepetersen HS. Demonstration of extensive GABA synthesis in the small population of GAD positive neurons in cerebellar cultures by the use of pharmacological tools. Neurochem Int. 2006;48:572–578. doi: 10.1016/j.neuint.2006.01.005. [DOI] [PubMed] [Google Scholar]
- Sonnewald U, Olstad E, Qu H, Babot Z, Cristofol R, Sunol C, Schousboe A, Waagepetersen H. First direct demonstration of extensive GABA synthesis in mouse cerebellar neuronal cultures. J Neurochem. 2004;91:796–803. doi: 10.1111/j.1471-4159.2004.02794.x. [DOI] [PubMed] [Google Scholar]
- Suzuki A, Stern SA, Bozdagi O, Huntley GW, Walker RH, Magistretti PJ, Alberini CM. Astrocyte-neuron lactate transport is required for long-term memory formation. Cell. 2011;144:810–823. doi: 10.1016/j.cell.2011.02.018. [DOI] [PMC free article] [PubMed] [Google Scholar]
- Zielke HR, Zielke CL, Baab PJ, Tildon JT. Effect of fluorocitrate on cerebral oxidation of lactate and glucose in freely moving rats. J Neurochem. 2007;101:9–16. doi: 10.1111/j.1471-4159.2006.04335.x. [DOI] [PubMed] [Google Scholar]