

Abstract
In mammals, aldosterone is produced in the zona glomerulosa (zG), the outermost layer of the adrenal cortex, whereas glucocorticoids are produced in adjacent zona fasciculata (zF). However, the cellular mechanisms controlling the zonal development and the differential hormone production (i.e. functional zonation) are poorly understood. To explore the mechanisms, we defined zone-specific transcripts in this study. Eleven-week-old male rats were used and adrenal tissues were collected from zG and zF using laser-capture microdissection. RNA was isolated, biotin labeled, amplified, and hybridized to Illumina microarray chips. The microarray data were compared by fold change calculations. In zG, 235 transcripts showed more than a 2-fold up-regulation compared to zF with statistical significance. Similarly, 231 transcripts showed up-regulation in zF. The microarray findings were validated using quantitative RT-PCR and immunohistochemical staining on selected transcripts, including Cyp11b2 (zG/zF: 214.2x), Rgs4 (68.4x), Smoc2 (49.3x), and Mia1 (43.1x) in zG as well as Ddah1 (zF/zG 16.2x), Cidea (15.5x), Frzb (9.5x), and Hsd11b2 (8.3x) in zF. The lists of transcripts obtained in the current study will be an invaluable tool for the elucidation of cellular mechanisms leading to zG and zF functional zonation.
In 1866, Arnold described the histology of the three concentric zones of the mammalian adrenal cortex and named them zona glomerulosa (zG), zona fasciculata (zF) and zona reticularis (zR) (1). It is now accepted that these zones have distinct roles in steroid hormone production: zG synthesizes mineralocorticoids and zF produces glucocorticoids (2–4). The role of zR varies between species but in primates zR is a source of the so-called adrenal androgens (5–7). Thus, in addition to the zone-specific differences in histology, there is a functional zonation that allows the production of the adrenal zone-specific steroids. However, the exact molecular mechanisms causing functional zonation are still poorly defined. A number of studies have focused on the steroid-metabolizing enzymes that are required for the zone-specific production of mineralocorticoids and glucocorticoids.
In humans and rodents, functional zonation relies in part on the zone-specific expression of two cytochrome P450 isozymes termed aldosterone synthase (CYP11B2) and steroid 11β-hydroxylase (CYP11B1) that catalyze the final steps in the biosynthesis of aldosterone and glucocorticoids (i.e. corticosterone in rodents and cortisol in humans), respectively. In zG, the consecutive 11β-hydroxylation, 18-hydroxylation, and 18-oxidation of deoxycorticosterone are catalyzed by one enzyme, CYP11B2. Expression of this isozyme is limited to zG, thus preventing production of aldosterone in the other adrenocortical zones (8, 9). As with aldosterone biosynthesis, glucocorticoid biosynthesis both in rodents and humans requires 11β-hydroxylation of their substrate (i.e. deoxycorticosterone in rodents and deoxycortisol in humans) that is accomplished by zF-specific CYP11B1. Other steroidogenic enzymes including cholesterol side-chain cleavage enzyme (CYP11A1), steroid 3β-hydroxysteroid dehydrogenase (HSD3B1), and steroid 21-hydroxylase (CYP21A1), as well as steroidogenic acute regulatory protein (StAR) are equally required for aldosterone and glucocorticoid biosynthesis and therefore are localized both in zG and zF (10–13).
However, beyond these enzymes, little is known regarding the differing phenotypes of zG and zF. A handful of genes have been defined to have a distinct expression patterns between the two zones (14–24). A physiological role for some of the genes in the functional zonation is clear as is illustrated by the higher expression of the angiotensin II receptor in zG (25). Angiotensin II represents the primary physiological regulator of aldosterone production, and the selective expression of angiotensin II receptor in the zG represents a clear link between the renin-angiotensin system and aldosterone biosynthesis. However, thus far, the genes that exhibit either zG- or zF-specific expression have not provided the clues needed to explain the steroidogenic phenotype of each zone.
A more global understanding of differences in transcript expression between zG and zF would provide new insights into the functional distinction between these two zones in development, physiology, and adrenal disease. In the present investigation, we sought to identify the transcripts that are differentially expressed in rat zG and zF using laser-capture microdissection (LCM), microarray, quantitative RT-PCR (qPCR), and immunohistochemistry. We have defined a series of novel transcript differences between zG and zF that should provide the basis for defining the molecular mechanisms leading to mineralocorticoid vs. glucocorticoid biosynthesis.
Materials and Methods
Animals
All animal procedures carried out were reviewed and approved by the Georgia Health Sciences University (GHSU) Institutional Animal Care and Use Committee. Nine-week-old male Sprague Dawley (SD) rats were purchased from Harlan Laboratorties, Inc. (Indianapolis, IN). Animals were housed in a temperature-controlled environment and maintained on a 12-hour light, 12-h dark cycle and given access to food/water ad libitum. Rats were provided regular rat chow that contained normal sodium content (0.49% sodium; diet no. TD.96208; Harlan Laboratories, Inc.). After 2 wk, rats were killed via rapid decapitation between 0800 and 1100 h. Adrenal glands were excised, cleaned of adherent tissues, and frozen in (optimum cutting temperature (O.C.T.) compound (Sakura Finetek U.S.A., Inc., Torrance, CA).
LCM, RNA isolation, amplification, labeling, and microarray
Frozen adrenal glands were cut in 10-μm sections and stained with cresyl violet using a modified protocol from the HistoGene LCM frozen section staining kit (Molecular Devices, Sunnyvale, CA) with ribonuclease-free methods. A PixCell II LCM system (Arcturus, Mountain View, CA) in the LCM core laboratory at the GHSU was used to capture zG and zF cells onto separate CapSure HS LCM caps (Molecular Devices, Sunnyvale, CA). RNA was isolated from the captured cells using the PicoPure RNA isolation kit (Molecular Devices). RNA quantity and quality were analyzed using bioanalysis (Experion; Bio-Rad Laboratories, Hercules, CA) and spectrophotometry (NanoDrop ND-1000; Thermo, Waltham, MA). Total RNA (450 pg) to be used for microarray was subjected to two-round antisense RNA (aRNA) amplification and biotin labeling using the TargetAmp 2-Round Biotin-aRNA amplification kit (EpiCentre Biotechnologies, Madison, WI). Biotin-labeled amplified aRNA (750 ng) was hybridized to Illumina chips (RatRef-12 BeadChip R3; Illumina Inc., San Diego, CA). Microarrays were performed by the Genomics Core Laboratory at GHSU. Of note, Cyp11b1 microarray transcript data were removed from the analysis because its 50-bp probe nucleotide sequence was 100% identical with the 3′ untranslated region of rat Cyp11b2 transcript, whereas the sequence was only 94% identical with that of rat Cyp11b1.
Quantitative RT-PCR
Total RNA obtained via LCM was subjected to linear amplification and conversion to cDNA using the MessageBOOSTER cDNA synthesis kit (EpiCentre Biotechnologies). For qPCR, 5 μl of prepared cDNA was mixed with Fast Universal MasterMix (Applied Biosystems, Foster City, CA) and TaqMan gene expression assays (Applied Biosystems) specific for the transcripts in Supplemental Table 1, published on The Endocrine Society's Journals Online web site at http://endo.endojournals.org. Peptidylprolyl isomerase A (Ppia; cyclophilin A) transcript was used for normalization of sample loading. The 2-ΔΔCt method was used to calculate fold changes (26).
Immunohistochemistry
Adrenal glands were excised from 11-wk-old male SD rats and separated into two groups. One group was fixed with 4% paraformaldehyde and paraffin embedded, whereas the other group was frozen in O.C.T. compound. Sections (4 μm) from 4% paraformaldehyde-fixed, paraffin-embedded specimens were deparaffinized and treated for antigen retrieval at pH 9 (Dako, Carpinteria, CA), whereas sections (10 μm) from frozen specimens were fixed in acetone. Details of primary antibodies, dilutions, and suppliers are listed in Supplemental Table 1. To localize CYP11B2 protein in adrenal sections, a previously reported monoclonal mouse anti-CYP11B2 antibody was used (27). Rabbit antirat 11β-hydroxysteroid dehydrogenase type 2 (11βHSD2; Hsd11b2) antibody was produced using a polypeptide containing amino acids corresponding to 113–400 as an antigen in a similar manner used by Náray-Fejes-Tóth and Fejes-Tóth (28). The immunohistochemical staining was performed using the EnVision (Dako) or ImmPress (Vector Laboratories, Burlingame, CA) peroxidase kits. Hematoxylin was used for counterstaining of nuclei.
Statistics
Microarray signal intensities were normalized by the percentile shift method (29) and were statistically analyzed using GeneSpring GX Software, version 11.0.1 (Agilent Technologies, Santa Clara, CA), in which the P values were calculated using a modified t test along with multiple testing corrections with the Benjamini and Hochberg false discovery rate. A P ≤ 0.05 was considered significant.
Results
Selective capture of rat zG and zF cells
To collect enriched populations of aldosterone-producing zG and corticosterone-producing zF cells, LCM was used on frozen adrenal gland tissue sections from four normal male SD rats that were fed standard rat chow. Based on their histological appearances, adrenal capsule, zG, zF, zR, and medulla were easily distinguished (Fig. 1A). Previous studies have demonstrated that the enzyme CYP11B2 that carries out the final reactions in aldosterone synthesis is mainly expressed in the outer portion of morphologic zG (30, 31). Therefore, zG cells were carefully captured from the three to five cell layers immediately beneath the capsule (Fig. 1B). On the other hand, pure zF cells were taken from lipid-rich cells in the middle of this zone to avoid contamination by zG or zR cells (Fig. 1C). Captured materials were pooled from multiple frozen sections of the same adrenal to obtain sufficient RNA from zG and zF for microarray and qPCR analyses.
Fig. 1.

Adrenal sections before and after LCM A, Hematoxylin-eosin staining of rat adrenal gland section showing capsule (c), zG (g), zF (f), zR (r), and medulla (m). B, Adrenal section after the capture of zG. A cresyl violet-stained section that had undergone the laser-capture was later stained with hematoxylin and eosin for clear presentation. C, Adrenal section after the capture of zF. A, B, and C were serial sections. Scale bar, 100 μm.
Differentially expressed transcripts in zG and zF
To evaluate the global difference of transcript expression between zG and zF, average transcript signal intensities from four independent rat adrenals were compared. Among the 22,523 array probes designed to cover all known rat transcripts and their splice variants, 661 and 700 transcripts were up-regulated by at least 2-fold in zG (Supplemental Table 2) and zF (Supplemental Table 3), respectively (Fig. 2). Among the up-regulated transcripts, 235 in zG (Supplemental Table 4) and 231 in zF (Supplemental Table 5) showed statistically significant differences (P < 0.05). Some of these up-regulated transcripts may be involved in control of zone-specific hormone production and/or zone formation.
Fig. 2.
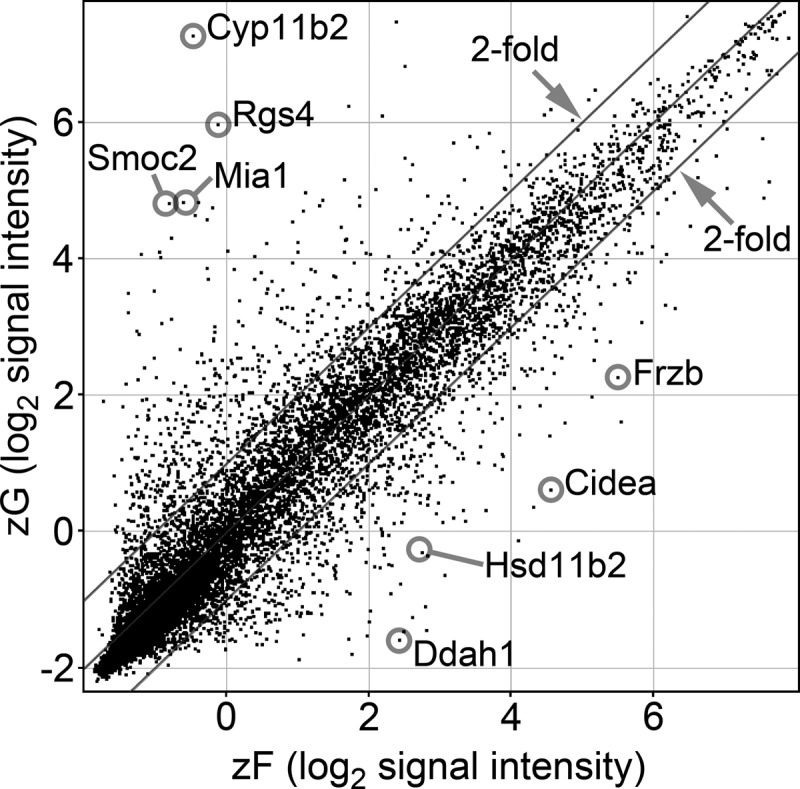
Microarray scatter plot showing pooled data from four zG and four zF samples. Each spot indicates a unique probe with a total of 22,523 independent transcripts based on normalized microarray data. Dots outside the parallel lines represent transcripts with greater than 2-fold differences in expression.
As expected, the signal intensities of transcripts that regulate both aldosterone and corticosterone synthesis, i.e. Star, Cyp11a1, Hsd3b1, and Cyp21a1, were highly and equally expressed in zG and zF. In contrast, those of steroid 17α-hydroxylase/17, 20 lyase (Cyp17a1), which is known to be expressed in human adrenals but not in rats, was considerably low both in zG and zF (Supplemental Fig. 1). Although there was not a specific Cyp11b1 probe on the microarray, its higher expression in zF than zG was confirmed by qPCR (fold change 26.5 ± 8.2).
Transcripts up-regulated in zG
The transcripts with the highest differential expression in zG vs. zF included numerous transcripts for proteins that have not been previously studied with regard to adrenal function (Fig. 3). Cyp11b2, regulator of G protein signaling 4 (Rgs4), δ-like 1 homolog precursor (Dlk1), and somatostatin receptor 2 (Sstr2) have been reported as zG specific (15, 16, 32). In our list, Cyp11b2 was by far the most up-regulated zG transcript compared with the zF. The relative signal intensities between the four rat adrenal samples were relatively uniform through 25 transcripts in the list, suggesting consistent LCM sampling. In addition, although it was not in Fig. 3, the angiotensin II type 1a and type 1b receptors (Agtr1a, Agtr1b) also showed significantly higher expression with fold changes of 11.1 and 11.7, respectively (Supplemental Table 4). Overall, these data indicated that the LCM and microarray analysis provided the clear transcriptional analysis of the aldosterone- vs. corticosterone-producing cells.
Fig. 3.

Heat map representation of microarray analysis for the 25 transcripts with the highest differential expression in zG vs. zF. Arbitrary signal intensity acquired from microarray analysis is represented by color (see color bar). Fold change was calculated as average of normalized zG signal intensities divided by that of normalized zF signal intensities. Predicted transcripts are indicated by an asterisk.
To confirm the zonal changes in transcript expression found using microarray data, we performed qPCR for the four most up-regulated transcripts. Cyp11b2 and secreted protein acidic cysteine-rich (also known as BM40/osteonectin)-related modular calcium binding 2 (Smoc2) mRNA were identified in all four zG samples, but were not detectable in any of zF samples. Therefore, their fold changes could not be calculated (Fig. 4A). However, qPCR amplifications for both Cyp11b2 and Smoc2 in zG were apparent from around 30 cycles, whereas those in zF remained undetectable at cycle 40, indicating that these transcripts were selectively expressed in the zG (Fig. 4, B and C). As for Rgs4, mRNA was detected in all zG samples; however, its mRNA level was below the detectable range in a half of the zF samples. Hence, the fold changes of zG vs. zF were calculated using adrenal samples from two rats, and the fold changes were 362 and 221 in rats 2 and 3, respectively (Fig. 4A). Melanoma inhibitory activity 1 (Mia1) mRNA was detected in all samples and the average fold change from rats 1–4 was 845 ± 204 (Fig. 4A). Although the relative fold changes found by qPCR were generally higher than those of microarray, both methods were in agreement that these transcripts were significantly elevated in zG compared with zF.
Fig. 4.
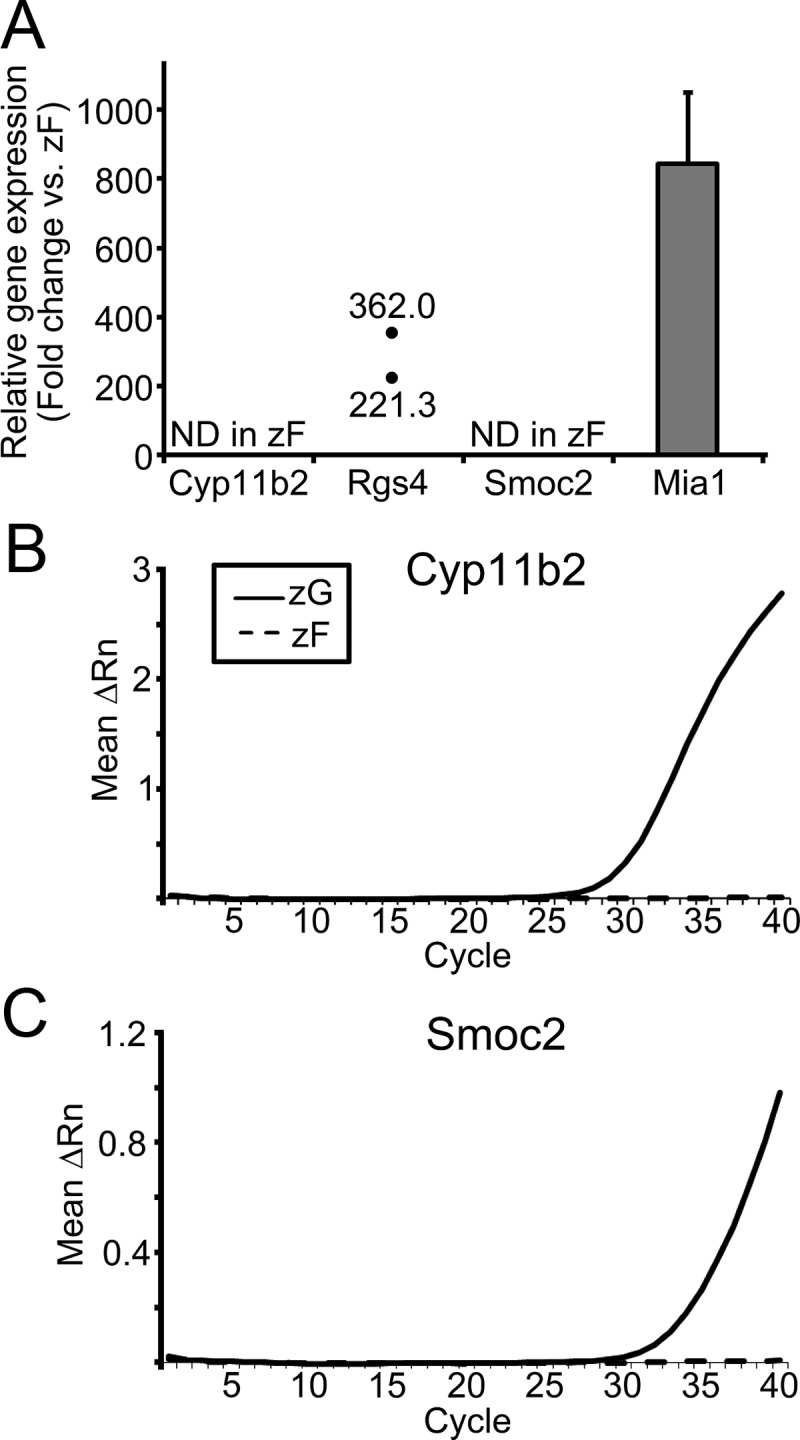
qPCR analysis for the transcripts with the highest differential expression in zG vs. zF. A, Fold change in each transcript. Cyp11b2 and Smoc2 were not detectable (ND) in all (rats 1–4) zF samples, preventing calculation of their fold differences. Rgs4 was detectable only in two zF samples (rats 2 and 3); therefore, the fold changes of the transcript were calculated from two pairs of zG/zF data. Results are shown as mean ± sem based on four independent experiments with duplicate wells in each experiment. B and C, qPCR curves illustrating mean ΔRn against PCR cycle number for transcripts of ND in zF (Cyp11b2 and Smoc2). ΔRn represents the normalized reporter signal (Rn) minus the baseline signal.
Subsequently, we investigated the protein expression of these four transcripts using immunohistochemistry. CYP11B2 was expressed only in the outer portion of zG and was not found in the other parts of adrenal in agreement with previous reports (30, 31). Rgs4 mRNA was previously reported to be expressed in zG using in situ hybridization (32). In our study, RGS4 protein was similarly found only in zG (Fig. 5B). SMOC2, which has not previously been studied in rat adrenal, was detected throughout zG (Fig. 5C). MIA1 was expressed mainly in zG, although some cells showed expression in the outer portion of zF (Fig. 5D). In summary, we confirmed the microarray data for selective transcripts by examining both mRNA and protein expression with qPCR and immunohistochemistry, respectively.
Fig. 5.

Immunohistochemistry for the four most highly up-regulated transcripts in zG. Each panel shows a representative image of immunohistochemistry for CYP11B2 (A), RGS4 (B), SMOC2 (C), and MIA1 (D). These figures show clear histological zonation of zG (g), zF (f), zona reticularis (r), and medulla (m) according to nuclear staining using hematoxylin. Arrowheads in D indicate a subset of fasciculata cells that are stained with MIA1. Scale bar, 100 μm.
Transcripts highly up-regulated in zF
The 25 transcripts with the highest differential expression in zF vs. zG included 21 transcripts encoding proteins and four hypothetical transcripts (Fig. 6). In the list, only frizzled-related protein precursor (Frzb; also known as Sfrp3) and Hsd11b2 have been studied in the adrenal, in which Frzb is expressed in chicken adrenal cortex (33) and Hsd11b2 in zF/zR layers of rat adrenal cortex (34).
Fig. 6.

Heat map representation of microarray analysis for the 25 transcripts with the highest differential expression in zF vs. zG. Arbitrary signal intensity acquired from microarray analysis is represented by color (see color bar). Fold change was calculated as average of normalized zF signal intensities divided by that of normalized zG signal intensities. Predicted transcripts are indicated by an asterisk. Hypothetical transcripts are indicated by two asterisks.
To confirm the zonal changes in transcript expression found in the microarray data, we performed qPCR for dimethylarginine dimethylaminohydrolase 1 (Ddah1); cell death-inducing DNA fragmentation factor, α-subunit-like effector (Cidea); Frzb; and Hsd11b2. These transcripts were selected based on the availability of antibodies for subsequent immunohistochemistry. Ddah1 transcript was detectable in all four zF samples by qPCR starting around 35 cycles, however, was not detectable in any of the zG samples, suggesting that the transcript was expressed in zF selectively but at a low level (Fig. 7, A and B). This result was consistent with the scatter plot and heat map with low zF signal intensities of Ddah1 (Fig. 2 and 6). Cidea and Frzb transcripts were detected in all zG and zF samples and the average fold changes were 571 ± 205 and 35.9 ± 7.7, respectively (Fig. 7A). As for Hsd11b2, the transcript was detected in all four zF samples but in only three zG samples (rats 1, 3, and 4). Therefore, the Hsd11b2 fold change of zF vs. zG was calculated from the three sets of zF/zG samples and was 47.5 ± 16.5 (Fig. 7A). Similar to the zG results, both microarray and qPCR methods demonstrated increased expression of the transcripts, and the relative fold changes found using qPCR were generally higher than those of microarray.
Fig. 7.

qPCR analysis for four transcripts with differential expression in zF vs. zG. Ddah1, Cidea, Frzb, and Hsd11b2 were selected based on the availability of antibodies for immunohistochemistry. A, Fold change in each transcript (zF vs. zG). Ddah1 was not detectable (ND) in any of the zG samples (rats 1–4). Hsd11b2 was detectable in only three zG samples (rats 1, 3, and 4); therefore, the fold change was calculated from three pairs of zF/zG data. B, qPCR curves illustrating ΔRn against PCR cycle number for transcripts of ND in all zG samples (Ddah1). ΔRn represents the normalized reporter signal (Rn) minus the baseline signal.
Using immunohistochemistry, we also confirmed that these transcripts were expressed preferentially in zF (Fig. 8). DDAH1 was expressed in a subset of zF cells and medulla (Fig. 8A). CIDEA, FRZB, and 11βHSD2 were expressed predominantly in zF and some of the zR cells (Fig. 8, B–D). All together we obtained consistent outcomes from the microarray, qPCR, and immunohistochemistry.
Fig. 8.

Immunohistochemistry for highly up-regulated transcripts in zF. Each panel shows a representative image of immunohistochemistry for DDAH1 (A), CIDEA (B), FRZB (C), and 11βHSD2 (D). These figures show clear histological zonation of zG (g), zF (f), zR (r), and medulla (m) according to nuclear staining using hematoxylin. Scale bar, 100 μm.
Discussion
In this study, we identified transcripts that are selectively expressed in either rat zG or zF using LCM and microarray analysis. The validity of the lists was confirmed with subsequent qPCR and immunohistochemistry for selected transcripts. Among them, Smoc2, Mia1, Ddah1, Cidea, and Frzb have not been studied with regard to adrenal function. Their differential expression within the adrenal makes them new candidate transcripts for regulators of zG/zF functional zonation.
The current study represents the first use of microarray to compare transcript expression patterns between zG and zF. Although there was a report published comparing expression of 6000 transcripts between RNA isolated from human zG/zF and zR, a focus of this study was on only one of the transcripts, dickkopf-3 (Dkk3), which the authors confirmed was selectively expressed in the zG (35). Interestingly, Dkk3 was not differentially expressed in our analysis of rat zG and zF. This may relate to differences among species. Transcriptome analysis of human purified zG and zF would expand our understanding of the evolutionary conserved genes that impact zonation. However, LCM of human adrenal zG has proven problematic due to the discontinuous nature of zG in human adrenals (36). The use of zG markers defined in the current study may help in future attempts to use LCM to capture aldosterone-producing cells in the human zG.
In addition, there have been several microarray analyses comparing human aldosterone-producing adenomas (APA) and normal adrenal tissues. The ability of APA and zG to produce aldosterone would suggest some similarities in transcript expression patterns. Indeed, the major transcript difference was the same as we found in comparing zG with zF, specifically Cyp11b2 (37–39). Another transcript that showed higher expression in both rat zG and human APA was visinin-like 1 (Vsnl1; rat zG/zF 3.0x, P < 0.05) (Supplemental Table 4) (38). Some other transcripts showed a trend of up-regulation were Purkinje cell protein 4 (Pcp4) (37); aldehyde dehydrogenase family 1, subfamily A2 (Aldh1a2) (37); 17β-hydroxysteroid dehydrogenase type 12 (Hsd17b12) (39); cytochrome B5 (Cyp5) (39); ATPase, Ca2+ transporter (Atp2a3) (38); calneuron 1 (Caln1) (38); and ectonucleotide pyrophosphatase/phosphodiesterase 2 (Enpp2) (38) (Supplemental Table 2). These data indicate that the aldosterone-producing phenotypes in the rat adrenal and the human APA share some genetic markers. However, the list of common transcripts was relatively short, possibly due to the species difference in these studies (rat vs. human) or the tissue comparison differences.
Our microarray, qPCR, and immunohistochemical analyses revealed zG-specific Smoc2 expression. Smoc2 belongs to a class of proteins termed matricellular proteins, which are extracellular proteins that do not contribute directly to the formation of structural elements but serve to modulate cell-matrix interactions and cell function. In particular, Smoc2 is a member of the secreted protein acidic cysteine-rich family proteins (40) and has been shown to modulate cell migration by interacting with integrin αvβ1 and αvβ6 in human keratinocytes (41). In mouse fibroblasts, Smoc2 is involved in cell cycle progression through maintaining integrin-linked kinase activity during cell cycle progression (42). Interestingly, during embryonic development, Smoc2 expression is tightly regulated spatiotemporally in mouse urogenital ridge and under the control of hedgehog signaling pathway (43). In later embryonic stages, fetal rat adrenal glands derived from urogenital ridge express sonic hedgehog (Shh) in adrenal cortex (44). In adult rat adrenal cortex, mRNA expression of both Shh and its receptor Patched-1 (Ptch1) has been localized in the cells adjacent to Cyp11b2-positive zG cells, the former in the cells just beneath the zG and the latter in the cells just above the zG (capsular cells) (44). These Smoc2, Shh, and Ptch1 expression patterns may suggest a possibility that Smoc2 expression in adult zG is also regulated by Shh signaling and it plays an important role in functional zonation of zG.
On the other hand, we identified zF-specific expression of secreted protein FRZB. The gene is initially identified through its sequence similarity with the Drosophila gene Frizzled (45) and shown to inhibit the Wnt signaling (46, 47). Although the function of Frzb in adrenal has not been explored, several genes related to the Wnt signaling cascade have been reported to influence adrenocortical zonation and/or aldosterone production. For example, Wnt4, which is one of the secreted WNT signaling factors, is expressed in mouse zG, and WNT4 gene mutations in mice and humans show reduced aldosterone production and adrenal dysgenesis, respectively (48, 49). β-Catenin, a downstream effector gene of Wnt signaling, is observed in the outer portion of mouse adrenal gland and its targeted deletion in mice exhibits depletion of developing adrenal cells (18). In our current study, β-catenin was not significantly different in zG vs. zF (data not shown), but Wnt4 transcripts showed a trend of up-regulation in zG with a fold change of 4.22 (P = 0.101, Supplemental Table 2). Together with previous reports and our data, it is possible that Frzb and Wnt4 may inversely modulate aldosterone production and/or zG/zF formation through Wnt signaling in rat adrenal cortex.
In summary, LCM proved to be suitable for selective capture of rat zG and zF. Our microarray analysis of zG and zF mRNA provided a clear indication of transcriptome differences between the two cortical zones. The subsequent qPCR and immunohistochemical analysis revealed zone-specific expression of the selected transcripts. In consequence, array data, qPCR and immunohistochemistry confirmed CYP11B2 as the most significant transcript difference between zG and zF. In addition, a number of up-regulated transcripts in each zone were uncovered. The array-derived candidate genes are currently being studied with regard to their impact on mineralocorticoid vs. glucocorticoid production. These transcript lists will be an essential tool for future adrenal research.
Supplementary Material
Acknowledgments
We thank the Integrated Genomics Core, LCM Core Laboratory and Georgia Research Pathology Services in Georgia Health Sciences University for excellent technical assistances.
This work was supported by Grant DK43140 from the National Institute of Diabetes and Digestive and Kidney Diseases (to T.S. and W.E.R.), Grant HL27255 from the National Heart, Lung, and Blood Institute (to C.E.G.-S.), and by fellowships from the Federation of National Public Service Personnel Mutual Aid Associations and the Tachikawa Hospital, Tokyo, Japan (to K.N.).
Disclosure Summary: The authors have nothing to disclose.
Footnotes
- APA
- Aldosterone-producing adenoma
- aRNA
- antisense RNA
- Cidea
- cell death-inducing DNA fragmentation factor, α-subunit-like effector
- Cyp11a1
- cholesterol side-chain cleavage enzyme
- Cyp21a1
- steroid 21-hydroxylase
- Cyp11b1
- steroid 11β-hydroxylase
- Cyp11b2
- aldosterone synthase
- Ddah1
- dimethylarginine dimethylaminohydrolase 1
- Frzb
- frizzled-related protein precursor
- GHSU
- Georgia Health Sciences University
- 11βHSD2
- 11β-hydroxysteroid dehydrogenase type 2
- Hsd3b1
- steroid 3β-hydroxysteroid dehydrogenase
- LCM
- laser-capture microdissection
- Mia1
- melanoma inhibitory activity 1
- O.C.T.
- optimum cutting temperature
- qPCR
- quantitative RT-PCR
- Rgs4
- regulator of G protein signaling 4
- SD
- Sprague Dawley
- Shh
- sonic hedgehog
- Smoc2
- secreted protein acidic cysteine-rich-related modular calcium binding 2
- Star
- steroidogenic acute regulatory protein
- zF
- zona fasciculata
- zG
- zona glomerulosa
- zR
- zona reticularis.
References
- 1. Arnold J. 1866. Ein Beitrag zu der feiner Struktur und dem Chemismus der Nebennieren. Virchows Arch 35:64–107 [Google Scholar]
- 2. Vinson GP, Ho MM. 1998. Origins of zonation: the adrenocortical model of tissue development and differentiation. Clin Exp Pharmacol Physiol 25:S91–S96 [DOI] [PubMed] [Google Scholar]
- 3. Mitani F, Mukai K, Miyamoto H, Suematsu M, Ishimura Y. 1999. Development of functional zonation in the rat adrenal cortex. Endocrinology 140:3342–3353 [DOI] [PubMed] [Google Scholar]
- 4. Vinson GP. 2003. Adrenocortical zonation and ACTH. Microsc Res Technique 61:227–239 [DOI] [PubMed] [Google Scholar]
- 5. Rainey WE, Carr BR, Sasano H, Suzuki T, Mason JI. 2002. Dissecting human adrenal androgen production. Trends Endocrinol Metab 13:234–239 [DOI] [PubMed] [Google Scholar]
- 6. Conley AJ, Pattison JC, Bird IM. 2004. Variations in adrenal androgen production among (nonhuman) primates. Semin Reprod Med 22:311–326 [DOI] [PubMed] [Google Scholar]
- 7. Nakamura Y, Gang HX, Suzuki T, Sasano H, Rainey WE. 2009. Adrenal changes associated with adrenarche. Rev Endocr Metab Disord 10:19–26 [DOI] [PMC free article] [PubMed] [Google Scholar]
- 8. Domalik LJ, Chaplin DD, Kirkman MS, Wu RC, Liu WW, Howard TA, Seldin MF, Parker KL. 1991. Different isozymes of mouse 11β-hydroxylase produce mineralocorticoids and glucocorticoids. Mol Endocrinol (Baltimore, Md) 5:1853–1861 [DOI] [PubMed] [Google Scholar]
- 9. Ogishima T, Suzuki H, Hata J, Mitani F, Ishimura Y. 1992. Zone-specific expression of aldosterone synthase cytochrome P-450 and cytochrome P-45011β in rat adrenal cortex: histochemical basis for the functional zonation. Endocrinology 130:2971–2977 [DOI] [PubMed] [Google Scholar]
- 10. Vinson GP. 2004. Glomerulosa function and aldosterone synthesis in the rat. Mol Cell Endocrinol 217:59–65 [DOI] [PubMed] [Google Scholar]
- 11. Shinzawa K, Ishibashi S, Murakoshi M, Watanabe K, Kominami S, Kawahara A, Takemori S. 1988. Relationship between zonal distribution of microsomal cytochrome P-450s (P-450(17)α, lyase and P-450C21) and steroidogenic activities in guinea-pig adrenal cortex. J Endocrinol 119:191–200 [DOI] [PubMed] [Google Scholar]
- 12. Le Goascogne C, Sananès N, Gouézou M, Takemori S, Kominami S, Baulieu EE, Robel P. 1991. Immunoreactive cytochrome P-450(17 alpha) in rat and guinea-pig gonads, adrenal glands and brain. Journal of reproduction and fertility 93:609–622 [DOI] [PubMed] [Google Scholar]
- 13. Lehoux JG, Hales DB, Fleury A, Brière N, Martel D, Ducharme L. 1999. The in vivo effects of adrenocorticotropin and sodium restriction on the formation of the different species of steroidogenic acute regulatory protein in rat adrenal. Endocrinology 140:5154–5164 [DOI] [PubMed] [Google Scholar]
- 14. Shen T, Suzuki Y, Poyard M, Best-Belpomme M, Defer N, Hanoune J. 1997. Localization and differential expression of adenylyl cyclase messenger ribonucleic acids in rat adrenal gland determined by in situ hybridization. Endocrinology 138:4591–4598 [DOI] [PubMed] [Google Scholar]
- 15. Halder SK, Takemori H, Hatano O, Nonaka Y, Wada A, Okamoto M. 1998. Cloning of a membrane-spanning protein with epidermal growth factor-like repeat motifs from adrenal glomerulosa cells. Endocrinology 139:3316–3328 [DOI] [PubMed] [Google Scholar]
- 16. O'Carroll AM. 2003. Localization of messenger ribonucleic acids for somatostatin receptor subtypes (sstr1–5) in the rat adrenal gland. J Histochem Cytochem 51:55–60 [DOI] [PubMed] [Google Scholar]
- 17. Romero DG, Yanes LL, de Rodriguez AF, Plonczynski MW, Welsh BL, Reckelhoff JF, Gomez-Sanchez EP, Gomez-Sanchez CE. 2007. Disabled-2 is expressed in adrenal zona glomerulosa and is involved in aldosterone secretion. Endocrinology 148:2644–2652 [DOI] [PubMed] [Google Scholar]
- 18. Kim AC, Reuter AL, Zubair M, Else T, Serecky K, Bingham NC, Lavery GG, Parker KL, Hammer GD. 2008. Targeted disruption of β-catenin in Sf1-expressing cells impairs development and maintenance of the adrenal cortex. Development (Cambridge, England) 135:2593–2602 [DOI] [PubMed] [Google Scholar]
- 19. Rucinski M, Ziolkowska A, Szyszka M, Malendowicz LK. 2009. Precerebellin-related genes and precerebellin 1 peptide in the adrenal gland of the rat: expression pattern, localization, developmental regulation and effects on corticosteroidogenesis. Int J Mol Med 23:363–371 [DOI] [PubMed] [Google Scholar]
- 20. Stephenson DT, Coskran TM, Wilhelms MB, Adamowicz WO, O'Donnell MM, Muravnick KB, Menniti FS, Kleiman RJ, Morton D. 2009. Immunohistochemical localization of phosphodiesterase 2A in multiple mammalian species. J Histochem Cytochem 57:933–949 [DOI] [PMC free article] [PubMed] [Google Scholar]
- 21. Davies LA, Hu C, Guagliardo NA, Sen N, Chen X, Talley EM, Carey RM, Bayliss DA, Barrett PQ. 2008. TASK channel deletion in mice causes primary hyperaldosteronism. Proc Natl Acad Sci USA 105:2203–2208 [DOI] [PMC free article] [PubMed] [Google Scholar]
- 22. Mukai K, Mitani F, Nagasawa H, Suzuki R, Suzuki T, Suematsu M, Ishimura Y. 2003. An inverse correlation between expression of a preprocathepsin B-related protein with cysteine-rich sequences and steroid 11β-hydroxylase in adrenocortical cells. J Biol Chem 278:17084–17092 [DOI] [PubMed] [Google Scholar]
- 23. Mukai K, Mitani F, Shimada H, Ishimura Y. 1995. Involvement of an AP-1 complex in zone-specific expression of the CYP11B1 gene in the rat adrenal cortex. Mol Cell Biol 15:6003–6012 [DOI] [PMC free article] [PubMed] [Google Scholar]
- 24. Kawabe K, Shikayama T, Tsuboi H, Oka S, Oba K, Yanase T, Nawata H, Morohashi K. 1999. Dax-1 as one of the target genes of Ad4BP/SF-1. Mol Endocrinol (Baltimore, Md) 13:1267–1284 [DOI] [PubMed] [Google Scholar]
- 25. Chai SY, Allen AM, Adam WR, Mendelsohn FA. 1986. Local actions of angiotensin II: quantitative in vitro autoradiographic localization of angiotensin II receptor binding and angiotensin converting enzyme in target tissues. J Cardiovasc Pharmacol 8(Suppl 10):S35–S39 [PubMed] [Google Scholar]
- 26. Livak KJ, Schmittgen TD. 2001. Analysis of relative gene expression data using real-time quantitative PCR and the 2(-ΔΔC(T)) method. Methods (San Diego, Calif) 25:402–408 [DOI] [PubMed] [Google Scholar]
- 27. MacKenzie SM, Clark CJ, Fraser R, Gómez-Sánchez CE, Connell JM, Davies E. 2000. Expression of 11β-hydroxylase and aldosterone synthase genes in the rat brain. J Mol Endocrinol 24:321–328 [DOI] [PubMed] [Google Scholar]
- 28. Náray-Fejes-Tóth A, Fejes-Tóth G. 1998. Extranuclear localization of endogenous 11beta-hydroxysteroid dehydrogenase-2 in aldosterone target cells. Endocrinology 139:2955–2959 [DOI] [PubMed] [Google Scholar]
- 29. Bolstad BM, Irizarry RA, Astrand M, Speed TP. 2003. A comparison of normalization methods for high density oligonucleotide array data based on variance and bias. Bioinformatics (Oxford, England) 19:185–193 [DOI] [PubMed] [Google Scholar]
- 30. Mitani F, Suzuki H, Hata J, Ogishima T, Shimada H, Ishimura Y. 1994. A novel cell layer without corticosteroid-synthesizing enzymes in rat adrenal cortex: histochemical detection and possible physiological role. Endocrinology 135:431–438 [DOI] [PubMed] [Google Scholar]
- 31. Wotus C, Levay-Young BK, Rogers LM, Gomez-Sanchez CE, Engeland WC. 1998. Development of adrenal zonation in fetal rats defined by expression of aldosterone synthase and 11β-hydroxylase. Endocrinology 139:4397–4403 [DOI] [PubMed] [Google Scholar]
- 32. Romero DG, Zhou MY, Yanes LL, Plonczynski MW, Washington TR, Gomez-Sanchez CE, Gomez-Sanchez EP. 2007. Regulators of G-protein signaling 4 in adrenal gland: localization, regulation, and role in aldosterone secretion. J Endocrinol 194:429–440 [DOI] [PubMed] [Google Scholar]
- 33. Duprez D, Leyns L, Bonnin MA, Lapointe F, Etchevers H, De Robertis EM, Le Douarin N. 1999. Expression of Frzb-1 during chick development. Mech Dev 89:179–183 [DOI] [PubMed] [Google Scholar]
- 34. Smith RE, Li KX, Andrews RK, Krozowski Z. 1997. Immunohistochemical and molecular characterization of the rat 11β-hydroxysteroid dehydrogenase type II enzyme. Endocrinology 138:540–547 [DOI] [PubMed] [Google Scholar]
- 35. Suwa T, Chen M, Hawks CL, Hornsby PJ. 2003. Zonal expression of dickkopf-3 and components of the Wnt signalling pathways in the human adrenal cortex. J Endocrinol 178:149–158 [DOI] [PubMed] [Google Scholar]
- 36. Nishimoto K, Nakagawa K, Li D, Kosaka T, Oya M, Mikami S, Shibata H, Itoh H, Mitani F, Yamazaki T, Ogishima T, Suematsu M, Mukai K. 2010. Adrenocortical zonation in humans under normal and pathological conditions. J Clin Endocrinol Metab 95:2296–2305 [DOI] [PubMed] [Google Scholar]
- 37. Wang T, Satoh F, Morimoto R, Nakamura Y, Sasano H, Auchus RJ, Edwards MA, Rainey WE. 2011. Gene expression profiles in aldosterone-producing adenomas and adjacent adrenal glands. Eur J Endocrinol 164:613–619 [DOI] [PMC free article] [PubMed] [Google Scholar]
- 38. Williams TA, Monticone S, Morello F, Liew CC, Mengozzi G, Pilon C, Asioli S, Sapino A, Veglio F, Mulatero P. 2010. Teratocarcinoma-derived growth factor-1 is upregulated in aldosterone-producing adenomas and increases aldosterone secretion and inhibits apoptosis in vitro. Hypertension 55:1468–1475 [DOI] [PubMed] [Google Scholar]
- 39. Bassett MH, Mayhew B, Rehman K, White PC, Mantero F, Arnaldi G, Stewart PM, Bujalska I, Rainey WE. 2005. Expression profiles for steroidogenic enzymes in adrenocortical disease. J Clin Endocrinol Metab 90:5446–5455 [DOI] [PubMed] [Google Scholar]
- 40. Vannahme C, Gösling S, Paulsson M, Maurer P, Hartmann U. 2003. Characterization of SMOC-2, a modular extracellular calcium-binding protein. Biochem J 373:805–814 [DOI] [PMC free article] [PubMed] [Google Scholar]
- 41. Maier S, Paulsson M, Hartmann U. 2008. The widely expressed extracellular matrix protein SMOC-2 promotes keratinocyte attachment and migration. Exp Cell Res 314:2477–2487 [DOI] [PubMed] [Google Scholar]
- 42. Liu P, Lu J, Cardoso WV, Vaziri C. 2008. The SPARC-related factor SMOC-2 promotes growth factor-induced cyclin D1 expression and DNA synthesis via integrin-linked kinase. Mol Biol Cell 19:248–261 [DOI] [PMC free article] [PubMed] [Google Scholar]
- 43. Pazin DE, Albrecht KH. 2009. Developmental expression of Smoc1 and Smoc2 suggests potential roles in fetal gonad and reproductive tract differentiation. Dev Dyn 238:2877–2890 [DOI] [PMC free article] [PubMed] [Google Scholar]
- 44. Guasti L, Paul A, Laufer E, King P. 2011. Localization of Sonic hedgehog secreting and receiving cells in the developing and adult rat adrenal cortex. Mol Cell Endocrinol 336:117–122 [DOI] [PMC free article] [PubMed] [Google Scholar]
- 45. Hoang B, Moos M, Jr, Vukicevic S, Luyten FP. 1996. Primary structure and tissue distribution of FRZB, a novel protein related to Drosophila frizzled, suggest a role in skeletal morphogenesis. J Biol Chem 271:26131–26137 [DOI] [PubMed] [Google Scholar]
- 46. Leyns L, Bouwmeester T, Kim SH, Piccolo S, De Robertis EM. 1997. Frzb-1 is a secreted antagonist of Wnt signaling expressed in the Spemann organizer. Cell 88:747–756 [DOI] [PMC free article] [PubMed] [Google Scholar]
- 47. Wang S, Krinks M, Lin K, Luyten FP, Moos M., Jr 1997. Frzb, a secreted protein expressed in the Spemann organizer, binds and inhibits Wnt-8. Cell 88:757–766 [DOI] [PubMed] [Google Scholar]
- 48. Heikkilä M, Peltoketo H, Leppäluoto J, Ilves M, Vuolteenaho O, Vainio S. 2002. Wnt-4 deficiency alters mouse adrenal cortex function, reducing aldosterone production. Endocrinology 143:4358–4365 [DOI] [PubMed] [Google Scholar]
- 49. Mandel H, Shemer R, Borochowitz ZU, Okopnik M, Knopf C, Indelman M, Drugan A, Tiosano D, Gershoni-Baruch R, Choder M, Sprecher E. 2008. SERKAL syndrome: an autosomal-recessive disorder caused by a loss-of-function mutation in WNT4. Am J Hum Genet 82:39–47 [DOI] [PMC free article] [PubMed] [Google Scholar]
Associated Data
This section collects any data citations, data availability statements, or supplementary materials included in this article.