

Abstract
This work reports the effects of the bioflavinoids genistein and daidzein on lipid bilayers as determined by volume measurements, X-ray scattering and molecular dynamics simulations. The experimental and simulated total molecular volumes were found to be in outstanding agreement with each other before the addition of genistein and daidzein and also after their addition. Both bioflavinoids inserted into the hydrocarbon region of both DOPC and DiphytanoylPC near the carbonyls of the lipids and both decreased the bilayer thicknesses. The long axes of both bioflavinoids were oriented nearly parallel to the plane of the bilayer with their carbonyl groups preferentially pointed towards the proximal surface. A difference is that daidzein had a solubility limit ~0.14 mole fraction in DOPC (~0.12 mole fraction in DiphytanoylPC) whereas genistein was soluble at least to 0.20 mole fraction in both lipid membranes. Measurements of bending modulus KC and simulation results for area compressibility modulus KA indicate that both bioflavinoids soften bilayers.
Keywords: hydrophobic mismatch, bending modulus, area compressibility modulus, gramicidin A, electron density profiles
Introduction
Ion-channel modifiers are generally thought to regulate protein phosphorylation and dephosphorylation. One class of modifiers, the bioflavinoids, includes the well-studied genistein1–2. For the cystic fibrosis transmembrane conductance regulator (CFTR) channel, genistein affects the wild-type channel, and activates a mutant channel due to a change in its specific binding site3. As a tyrosine kinase inhibitor, genistein could serve as an antitumor agent since kinase activity is strongly correlated with the ability of retroviruses to transform cells4–6. Another specific effect of genistein is to mimic the action of estrogen7–8. Most estrogen effects are mediated by estrogen receptors, which are transcriptional regulators, but some are mediated by membrane receptors linked to calcium metabolism9–10. The roles of estrogen, genistein and another bioflavinoid, daidzein, on murine osteoclasts were investigated; estrogen> genistein> daidzein all reduced osteoclast differentiation which may protect bone11.
In addition to these specific effects that require binding to proteins, bioflavinoids have also been reported to modulate ion-channel activity in a non-specific way, i.e., by altering the properties of the lipid membrane surrounding the channel12–13. By changing the length of a gramicidin A (gA) channel12 and by using lipid membranes of varying thickness13, the importance of hydrophobic mismatch in limiting both the onset and the lifetime of gA channel formation was demonstrated. It was suggested that genistein shifts the equilibrium from non-conducting monomers to conducting gA dimers by compensating for hydrophobic mismatch. This conclusion was reached since the magnitude of the effect of genistein increased with increasing hydrophobic mismatch between the channel length and the membrane thickness13. It was further hypothesized that genistein affects protein-lipid coupling by changing the elastic properties of the membrane, which involve the lipid area compressibility modulus KA and the bending modulus KC. An interesting contrast was that, in DPhyPC/n-decane black lipid membranes, daidzein did not increase gA channel lifetime13, although later it was determined that daidzein did increase gA channel lifetime, but only half as much as genistein14. Another reported difference between these two bioflavinoids is that daidzein, but not genistein, was reported to aggregate liposomes15.
In the present investigation, we use x-ray diffuse scattering to measure KC and to provide basic structural data for the effect of genistein and daidzein in DOPC and DPhyPC membranes. These data are used to validate molecular dynamics (MD) simulations which then provide the area/unit cell of DOPC with bioflavinoids at 20 and 14 mole%, and the bioflavinoid positions in the DOPC membrane. In addition, we measure the molecular volume and use a volume-conserving fit of our diffuse x-ray scattering data to a bilayer model for the component groups16 as an alternative way to determine the position of both bioflavinoids in membranes. These structural and elasticity results provide insight into the effects of bioflavinoids on lipid membranes.
Materials and Methods
Samples
Dioleoylphosphatidylcholine (DOPC) (Lot 18:1-228) and diphytanoyl-phosphatidylcholine (DPhyPC) (Lots 4Me160-118, 4Me160-121) were purchased from Avanti Polar Lipids in the lyophilized form. Bioflavinoids, genistein and daidzein, were purchased from Sigma/Aldrich (St. Louis, MO); their chemical structures are shown in Fig. 1. Lipid/bioflavinoid mixtures in the mole fractions 0.05, 0.10, 0.15 and 0.20 were prepared by mixing with lipids in organic solvent. Bioflavinoids are insoluble in most common organic solvents at room temperature, including chloroform, methanol, acetone, hexafluoroisopropanol and trifluoroethanol, but soluble in hot methanol and DMSO. Four mg DOPC/bioflavinoid mixtures (in duplicate) were dissolved in 200 μl HPLC hot methanol and plated onto 30mm × 15mm × 1mm silicon wafers in an oven at 50°C using the rock and roll technique17. For DPhyPC/bioflavinoid mixtures, evaporation from chloroform in the fume hood was more successful than hot methanol at producing well-oriented samples. After drying overnight in the hood, samples were trimmed to a 5 mm × 30 mm strip in the center of the wafer. Hydration of oriented samples from water vapor was then carried out in a thick-walled hydration chamber18. Unoriented multilamellar vesicles (MLV) in excess water were prepared by weighing 1–2 mg of dry lipid mixture with 40 μl milli-Q water and thoroughly mixing in small nalgene vials, then thermally cycling three times with vortexing between −20 °C and 50 °C before loading into 1mm diameter glass capillaries (Charles Supper, Cambridge, MA). Thin layer chromatography using chloroform:methanol:7N NH4OH (46:18:3, v/v) and a molybdic acid stain indicated negligible lysolipid before and 0.1–0.5 % lysolipid after X-ray exposure, with genistein samples showing slightly more degradation than daidzein samples.
Figure 1.
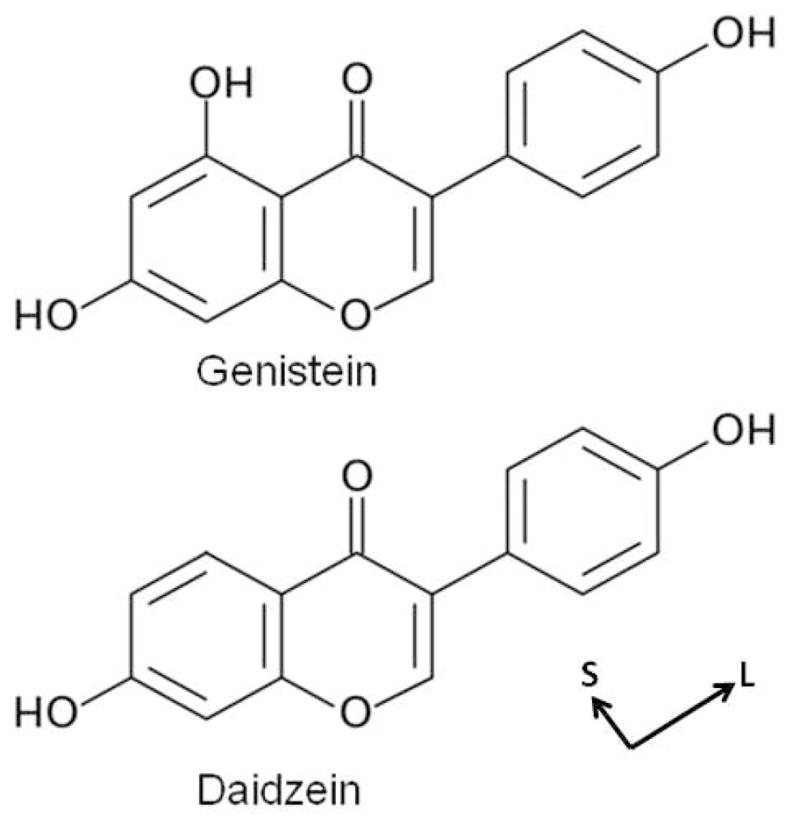
Chemical structures of the bioflavinoids, genistein and daidzein. The long (L) and short (S) axes of the bioflavinoids are shown.
Volume determination
Volumes in fully hydrated MLV were determined at 30±0.01 °C using an Anton-Paar USA DMA4500 (Ashland, VA) vibrating tube densimeter. Volume of the ‘unit cell’, V1, is defined to be the volume VL of one lipid plus the proportional bioflavinoid volume VBFf/(1−f) where the mole fraction f is the number of moles of bioflavinoid divided by the number of moles of lipid and bioflavinoid and VBF is the volulme of one bioflavinoid. V1 was calculated from
| (1) |
where ρS and ρW are the measured densities of the samples and pure water, respectively, mW is the mass of water and mM is the sum of the masses of the lipid and the bioflavinoid in the mixture. In accordance with the definition of V1, MW1 is the molecular weight of one lipid plus f/(1−f) times the molecular weight of the bioflavinoid.
X-ray scattering
X-ray data from oriented fluid phase lipid mixtures at 30 °C were obtained on two trips to the Cornell High Energy Synchrotron Source (CHESS) using the G1 station managed by Dr. Arthur Woll. The wavelength was set with a WB4/C multilayer monochromator to 1.1803 Å on trip 1 and to 1.1825 Å on trip 2, with a total beam intensity of 5×10¹¹ photons/sec/mm2. Beam width was 0.26 mm and the beam height was 0.9–1.2 mm. The samples were ~10 micron thick along the normal to the ~2000 bilayers. The angle of the flat samples was cycled uniformly from −3 to 7 and back to −3 degrees relative to the beam once a second during the 30–60 s exposures. Data were collected using a Flicam CCD (Finger Lakes Instrumentation, Lima, NY) with a 1024×1024 pixel array with average pixel size 71 μm/pixel. The sample-to-CCD distance was 371 or 354 mm, calibrated using a silver behenate standard with D-spacing 58.4 Å. Temperature was controlled with a Neslab Controller (Portsmouth, NH) and monitored using a Cole-Parmer thermistor (Vernon Hills, IL). To obtain fully hydrated D-spacings, MLV samples were X-rayed at CMU at 30 °C using a Rigaku RUH3R microfocus rotating anode (Woodlands, TX) equipped with Xenocs FOX2D (Sassenage, France) focusing collimation optics.
The analysis of diffuse data from oriented stacks of fluctuating fluid bilayers has been previously described 18–21 and will only briefly be summarized here. The scattering intensity for a stack of oriented bilayers is the product: I(q) = S(q)|F(qz)|2/qz, where q = (qr,qz), S(q) is the structure interference factor, F(qz) is the bilayer form factor and qz−1 is the usual low angle x-ray scattering (LAXS) approximation to the Lorentz factor for which all the sample remains in the beam for all relevant q. The first step of the analysis obtains the bilayer bending modulus KC and the compression modulus B by fitting to the qr dependence of the diffuse X-ray scattering. |F(qz)|2/qz is then determined by dividing I(q) by the S(q) derived from validated liquid crystal theory. A geometric undulation correction22 is used to multipy the qz axis of F(qz) by a factor slightly larger than 1, for example, 1.02.
Structural Analysis
The x-ray |F(qz)| data were fit using a recently devised modeling procedure abbreviated SDP for Scattering Density Profile16. This procedure satisfies the important principle of volume conservation which requires that the volume probabilities of all the components sum to one at all z along the bilayer normal. The SDP procedure guarantees an important relation between the area A1 and the zeroth order x-ray form factor F(0)23:
| (2) |
where V1 is the measured volume of the lipid/bioflavinoid mixture in Eq. (1), n1 = nL+nBFf/(1−f) is the number of electrons, nL is 434 for DOPC and 470 for DPhyPC, and nBF is 140 for genistein and 132 for daidzein, ρW = 0.333e/Å3 is the electron density of water at 30 °C, and A1 is the area of the unit cell, similar to the above definition of V1. The original SDP application parsed the lipid molecule into components, called the SDP model, that were especially appropriate for simultaneous analysis of x-ray and neutron scattering data16. For x-ray only data in this paper we have parsed the system differently, combining some of the features of the older H224 and HB models25. We represented the phosphatidylcholine part of the headgroup with a PC Gaussian, the carbonyl/glycerol part of the headgroup with a CG Gaussian, and the hydrocarbon chains with a combination of error functions and a Gaussian for the terminal methyls as previously described16. The bioflavinoid was represented by an additional Gaussian. The fitting procedure allows the use of outside information to impose constraints on the model parameters. Informed by our volume measurements, we constrained the ratio of bioflavinoid volume to lipid volume, and the chain terminal methyl to the chain methylene volume ratio to 1.96. Consistent with the MD simulations, we constrained the widths of the lipid headgroup peaks to 2.5 Å, the bioflavinoid width to 3.0 Å, the methyl trough width to 3.0 Å and the width of the hydrocarbon interface to 2.4 Å. We also constrained DH1, the difference in distance between the maximum in the electron density profile and the Gibbs dividing surface for the hydrocarbon region, to 4.95 Å, and ΔDH, the difference in distance between the PC and CG Gaussians to 4.6 Å. Otherwise, the locations of the components remained free to provide estimates for DHH and the position of the bioflavinoid in the membrane.
MD Simulations
Release version c35b4 of the CHARMM program26 was used for all molecular dynamics simulations, model building, and either analysis of the simulation data, or extraction of data for further analysis with other programs. Distributed CHARMM force field parameters were utilized for DOPC27 and water28; CHARMM compatible parameters for genistein were obtained from Burendahl et al.29, and parameters for daidzein were derived by analogy from them. A force switched Lennard-Jones method was used for the van der Waals term of the potential, with a cutoff of 12 Å, and the switching function starting at 10 Å. Electrostatics were computed with the particle-mesh Ewald method using a 12 Å real space cutoff, κ=0.32, a 5th order spline interpolation for the complementary error function, and a grid density of about 1 Å. All MD simulations used the Verlet leapfrog integrator and the extended pressure system implemented in CHARMM.
Pure DOPC systems were either an extension to 105 ns of an NPT ensemble simulation from Klauda et al.27, or derived from that system and simulated via the NPAT ensemble (fixed area/lipid) for 35 ns. Starting with the NPT system (<area/lipid> = 69.0 Å2), the number density z profiles for each uniquely labeled atom of a molecule were first extracted from the simulation trajectories, and then combined and formatted with a Fortran program for subsequent use as input to the SIMtoEXP program30. The SIMtoEXP program compares x-ray structure factors calculated from scattering data with those calculated from the simulation number density profiles. In this case, the comparison indicated the area cross section (69 Å2/lipid) was too small, and that simulations at larger area/lipid were required to provide atomic level insight to the experimental results. Two additional DOPC simulations were generated in the NPAT ensemble, with fixed area/lipid values of 72.4 and 75 Å2. The last 25 ns of these two simulations were used for data analysis, while the last 90 ns of the NPT simulation were included for the calculation of KA. For further model building, a library of individual DOPC conformations was derived from the latter part of the NPT simulation coordinate trajectory; random selection from this library was used to pack the mixtures described below.
Systems containing 20% bioflavinoids were constructed de novo, by placing an oriented lipid or bioflavinoid at grid points in a hexagonal lattice via random selection of the molecule type. Using a spacing derived from initial area estimates from the scattering experiments, a 7×7 grid was used for each leaflet, placing 36 lipids and 9 bioflavinoids, with 4 unoccupied lattice points, giving a total of 72 lipids and 18 bioflavinoids. After successful packing, the systems were hydrated with TIP3P water, energy minimized, adjusted to give a total water count of 2400 molecules (based on estimates of hydration for the experiments), and more extensively minimized. Replicate models for each bioflavinoid were built in this fashion, and three were chosen for NPT ensemble simulations. After heating from 203 K, the Hoover thermostat at 303 K was employed for NPT simulations for a total run time of 45 ns. Analogous to the case for DOPC, comparison of the experimental x-ray structure factor curves with those from the last 35 ns of the NPT simulations indicated that the simulation area cross sections (73–75 Å2/lipid) were too small to match the experiments, and that NPAT simulations at larger areas were required. Systems containing 14% daidzein were obtained by removing 3 bioflavinoids from each leaflet, energy minimizing, adjusting the area cross section via NPγT simulations, and running for an additional 35 ns.
A genistein coordinate set from the 45 ns point of one of the NPT simulations was chosen as a starting point for further simulations at fixed areas of 80, 83, and 86 Å2/lipid. In order to expand the area cross section, short NPγT simulations were used, with γ = 15 dyn/cm/leaflet sufficient to attain the target areas. Three matching daidzein conformations were created by modification of the genistein molecules (converting –OH to –H). Six NPAT simulations were started, with each bioflavinoid simulated at each of the three areas given above. Based on a preliminary comparison to experimental x-ray structure factors, additional daidzein simulations were done at A=78 Å2/lipid for mole fraction f=0.20 and at A= 79 and 82 Å2/lipid for f=0.14, as well as a genistein simulation with A=84.5 Å2/lipid at f=0.20. These 10 NPAT simulations were run for 35 ns, and the final 25 ns of each used for all data analysis.
Results
Volumes
Table 1 shows our measured unit cell volume V1(exp), consisting of one lipid plus the fraction f/(1−f) of a bioflavinoid. Addition of mole fraction f=0.2 bioflavinoids increased V1(exp) compared to the molecular volumes of pure DOPC and DPhyPC measured previously31–33. Table I also shows that our MD simulations for DOPC give values V1(sim) that agree very well with V1(exp). If we assume that the volume of the lipid does not change upon addition of bioflavinoids, then we obtain the volumes VBF(calc) of genistein and daidzein listed in Table I. Another way to estimate the volumes VBF employs a volumetric analysis of components in simulations 34. This gives the larger volumes VBF(sim) for the bioflavinoids in DOPC shown in Table I, and requires a corresponding condensation of the lipid volumes (not shown).
Table 1.
Tabulated Results*
| lipid | DOPC | DPhyPC | ||||
|---|---|---|---|---|---|---|
| bioflavinoid | none | Gen | Daid | none | Gen | Daid |
| f | 0 | 0.20 | 0.14 | 0 | 0.20 | 0.12 |
| V1(exp) | 1303 | 1385 | 1380a | 1427 | 1518 | 1513a |
| V1(sim) | 1304 | 1384 | 1380a | |||
| VBF(calc) | 328 | 308a | 363 | 343a | ||
| VBF(sim) | 437 | 352a | ||||
| A1(exp) | 72 | 82 | 79 | 83 | 93 | 88 |
| A1(sim) | 75 | 83 | 80 | |||
| DHH(exp) | 36.1 | 33.8 | 34.6 | 36.4 | 35.0 | 35.5 |
| DHH(sim) | 36 | 33.9 | 34.5 | |||
| ZBF(exp) | 11.8 | 12.3 | 13.0 | 13.4 | ||
| ZBF(sim) | 11.8 | 12.3 | ||||
| KA(sim) | 250 | 160 | 190 | |||
| KC(exp) | 6.5 | 5.7 | 4.8 | 5.3 | 5.4 | 5.5 |
Units are appropriate powers of Å, mN/m for KA, 10–20 J for KC, f is mole fraction of bioflavinoid, Gen is genistein and Daid is daidzein, and subscript 1 signifies a unit cell consisting of 1 lipid and f/(1−f) bioflavinoid.
indicates results for f = 0.20.
Structural x-ray Data
The lobes of diffuse scattering from oriented samples are shown numbered in Fig. 2. The diffuse scattering for DOPC at 30 °C extends beyond 0.8 Å−1 with three strong lobes (1–3) and two lobes of weaker scattering not visible in Fig. 2A. The two weaker lobes (4 and 5) are barely visible for DPhyPC in Fig. 2D. It is important to emphasize that accurate measurement of weak or zero intensity increases the spatial resolution of structural data. Our diffuse data contain information equivalent to about 8 orders of Bragg diffraction from rather dry samples and more than the usual 2–4 orders obtained in many investigations of more hydrated samples. There are also sharp peaks corresponding to orders h=1 and 2 from which the lamellar D-spacing was obtained; these peaks are barely visible in Fig. 2 because their intensities were reduced by a factor of ~1700 by a 0.1mm thick molybdenum attenuator. As the relative humidity in the sample chamber was increased, the measured D-spacing increased towards the fully hydrated D-spacing determined from MLV samples in excess water in capillaries. These D-spacings did not change significantly with addition of bioflavinoids; their values are shown in Fig. S1. The diffuse x-ray data were collected within 5 Å of the fully hydrated D-spacing. At the highest concentration (f=0.20) of daidzein, Fig. 2C and Fig. 2F show several sharp reflections, presumably due to the presence of daidzein crystals. The measured D-spacing of the strongest sharp reflection was 8.4 Å, comparable to the length of a tilted daidzein molecule. These reflections were removed for the structural analysis, but this crystallization limited the concentration of bioflavinoid in this study. The ratio of the intensity of the sharp reflections to the intensity of the diffuse scattering was larger for our nominal f=0.2 daidzein samples than for our nominal f=0.15 daidzein samples. By extrapolating to zero intensity of the sharp rings (data not shown), we estimate that the solubility limit of daidzein in DOPC is f=0.14 and in DPhyPC it is f=0.12 in these oriented samples. Crystal rings did not appear in any of the genistein samples.
Figure 2.
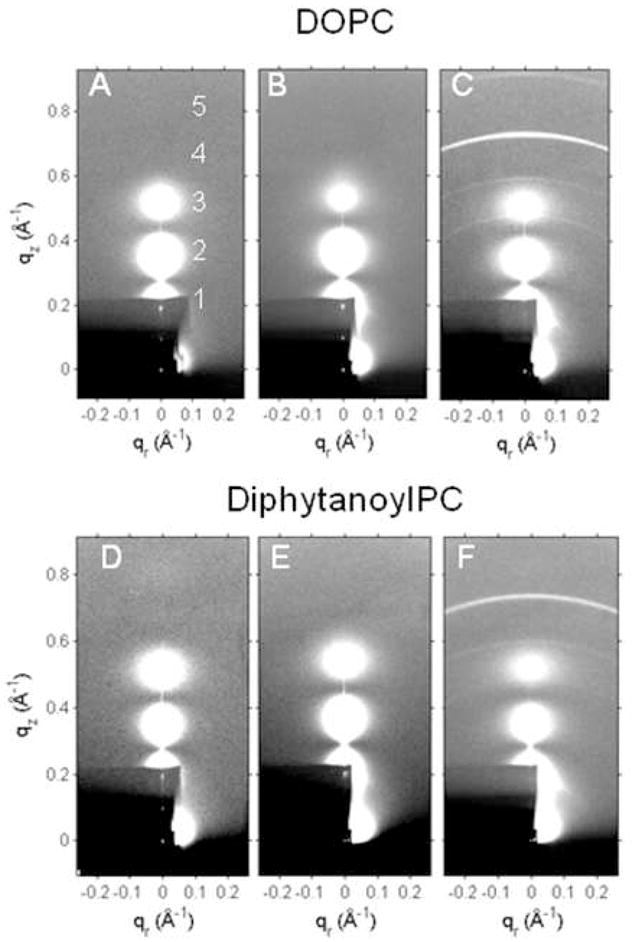
2D CCD images of LAXS diffuse scattering, white is highest intensity. A. DOPC, B. DOPC/20% genistein, C. DOPC/20% daidzein, D. DPhyPC, E. DPhyPC/20% genistein, F. DPhyPC/20% daidzein. The dark shadows are caused by attenuators through which the beam and orders 1 and 2 can be seen.
Structural Results
Figure 3 compares the X-ray form factors obtained from MD simulations of 20 mole% genistein in DOPC at three different unit cell areas A1. As A1 increases and the thickness of the bilayer decreases, the simulated lobes of |F(qz)| move to larger qz. Comparison to the experimental |F(qz)| obtained from the data in Fig. 2B indicates that the best simulated value of A1 is closer to 83 Å2 than to 80 Å2 or 86 Å2.. Similar comparisons of simulations and experiment were performed for DOPC and 20% (14%) daidzein in DOPC to obtain the simulated values of A1 shown in Table I. Figure 3 also shows |F(qz)| obtained from modeling. Of course, with a sufficiently complex model with many unconstrained parameters, it is possible to fit the experimental |F(qz)| quite well, but this yields component distributions in real space that are not realistic. It is therefore important that the model be constrained to be realistic and the simulations are valuable for that, as we show next.
Figure 3.

Experimental form factor |F(qz)| data for 20 mole% genistein in DOPC (grey circles) compared to the form factors resulting from three MD NPAT simulations fixed to areas A1 of 80 Å2 (green), 83 Å2 (red) and 86 Å2 (blue). Also shown is the model fit (black) that yielded A1 = 82 Å2. The inset shows more detail in the second lobe.
Figure 4 compares the real space electron density distributions of the DOPC lipid components and 20% genistein as obtained from the simulation at A1=83 Å2 with those obtained from modeling of the experimental |F(qz)|. Although the widths of the model distributions have been constrained, it is important to emphasize that the unconstrained positions zBF of the modeled genistein and the headgroups are nearly the same as those of the simulations. This strongly supports the validity of the simulations. Table I shows the good agreement between the values of the simulated and experimental head-head spacing DHH in the electron density profiles and the average position of both bioflavinoids.
Figure 4.

Electron density profiles for DOPC with 20% genistein resulting from MD simulation at A1=83 Å2 (solid lines) and model fitting to experimental data (dashed lines). Component groups are identified by colors shown in the legend.
Figure 5 shows the X-ray form factors |F(qz)| from oriented samples of DOPC and bioflavinoids, and Fig. 6 shows the X-ray form factors from oriented samples of DPhyPC and bioflavinoids that came from the CCD images shown in Fig. 2. The solid curves in Figures 5 and 6 result from the model fits. The vertical dotted lines help compare the effects of the bioflavinoids on the positions of the zero between lobes 1 and 2. The data for 20% genistein in both DOPC and DPhyPC shifts to higher qz which is an indication of a thinning of the bilayers.
Figure 5.
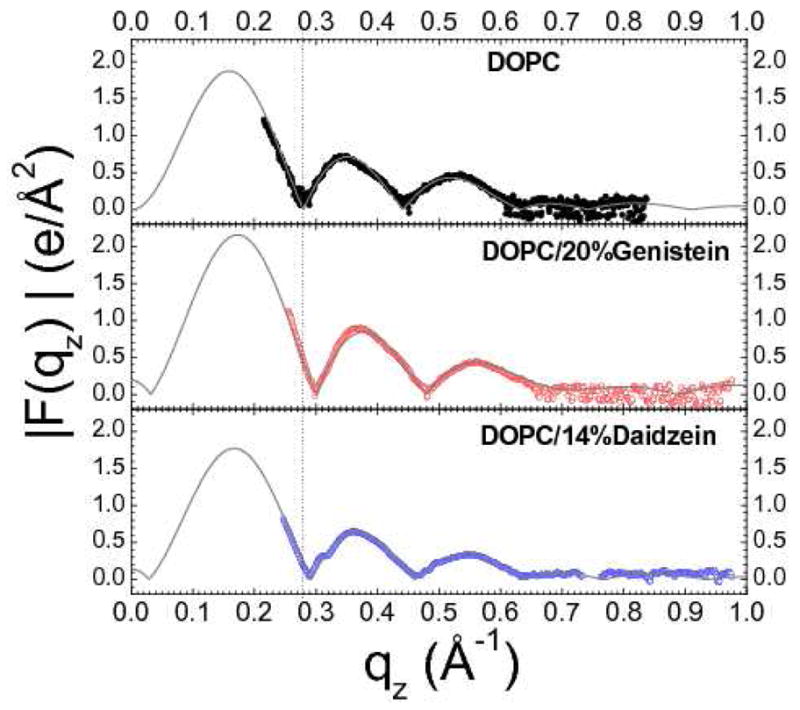
(left) |F(qz)| data for DOPC (black), DOPC/20%genistein (red) and DOPC/14%daidzein (blue). Lobes are numbered for DOPC.
Figure 6.
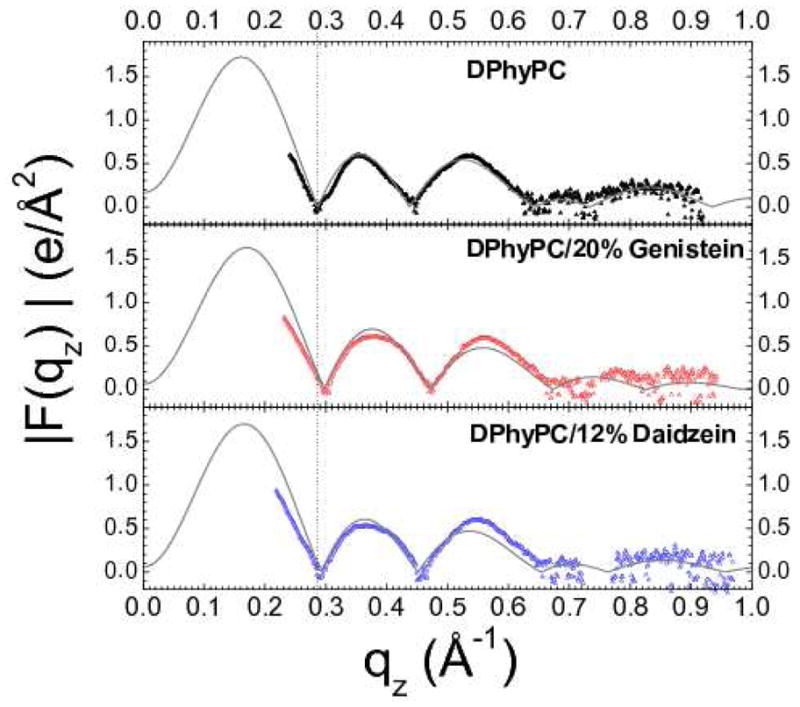
(right) |F(qz)| data for DPhyPC (black), DPhyPC/20%genistein (red) and DPhyPC/12%daidzein (blue).
Figures 7 and 8 show electron density profiles obtained from modeling experimental data. The most robustly determined quantity is the head-to-head thickness, DHH, which is defined as the distance between the maxima in the total electron density profiles. The vertical dotted lines help compare the effects of the bioflavinoids on DHH of DOPC. Results for the highest concentrations of bioflavinoid are given in Table I. Genistein decreased the thickness of DOPC somewhat more than daidzein as shown in Figs. 7 and 8 and quantified in Table 1. With increasing concentration, genistein moved slightly towards the bilayer center, while daidzein moved slightly outwards from the bilayer center. Similar but smaller thinnings were observed when these bioflavinoids were added to DPhyPC as shown in Figs.S2, S3 in SI and quantified in Table 1. Figs S2 and S3 also note slight movements in the bioflavinoids in DPhyPC with increasing concentration.
Figure 7.
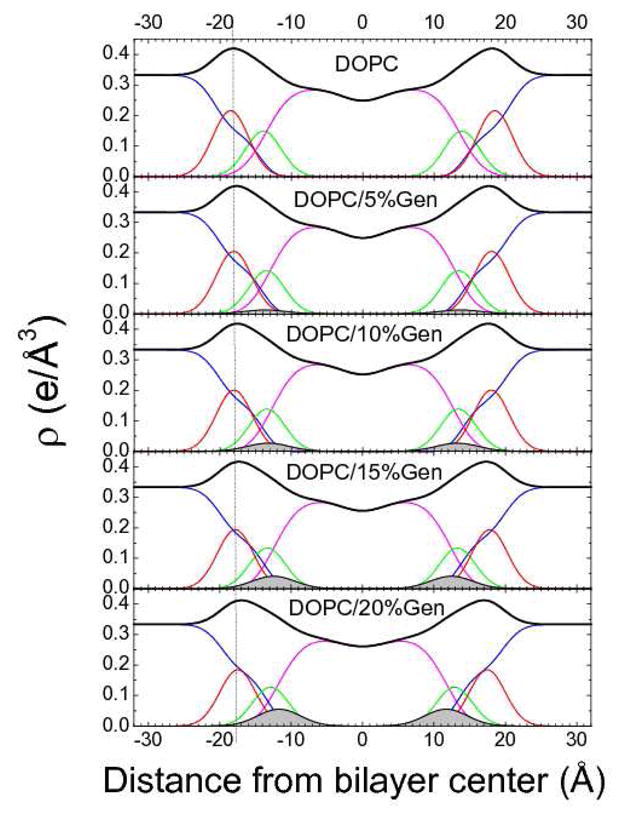
(left). Electron density profiles of DOPC with increasing concentration of genistein obtained using the SDP procedure. Component groups are phosphate (red), carbonyl-glycerol (green), methylenes and terminal methyl group (magenta), water (blue), bioflavinoid (filled grey) and total (black).
Figure 8.
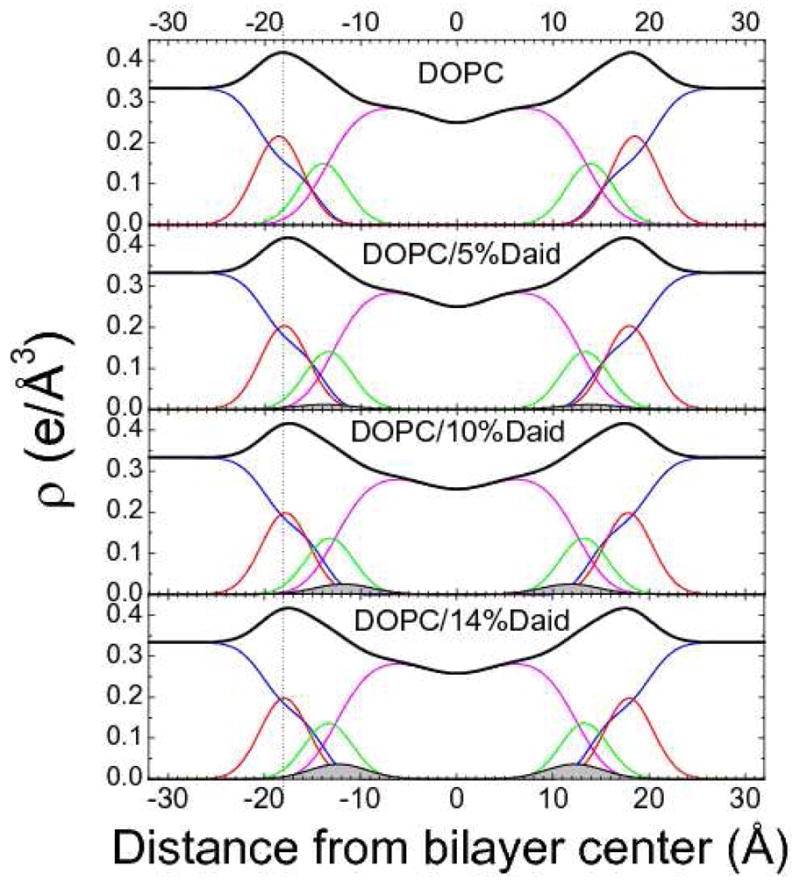
(right). Electron density profiles of DOPC with increasing concentration of daidzein obtained using the SDP procedure. Line colors as for Figure 7.
Elasticity
Results for the bending modulus KC are shown in Figure 9. The KC values were averaged from data at different D spacings from the same sample as well as from different samples. For any one sample, KC did not vary systematically with D-spacing, consistent with it being a property of single bilayers. As shown in Fig. 9, the effect of either bioflavinoid on KC was relatively small, especially in the case of genistein.
Figure 9.
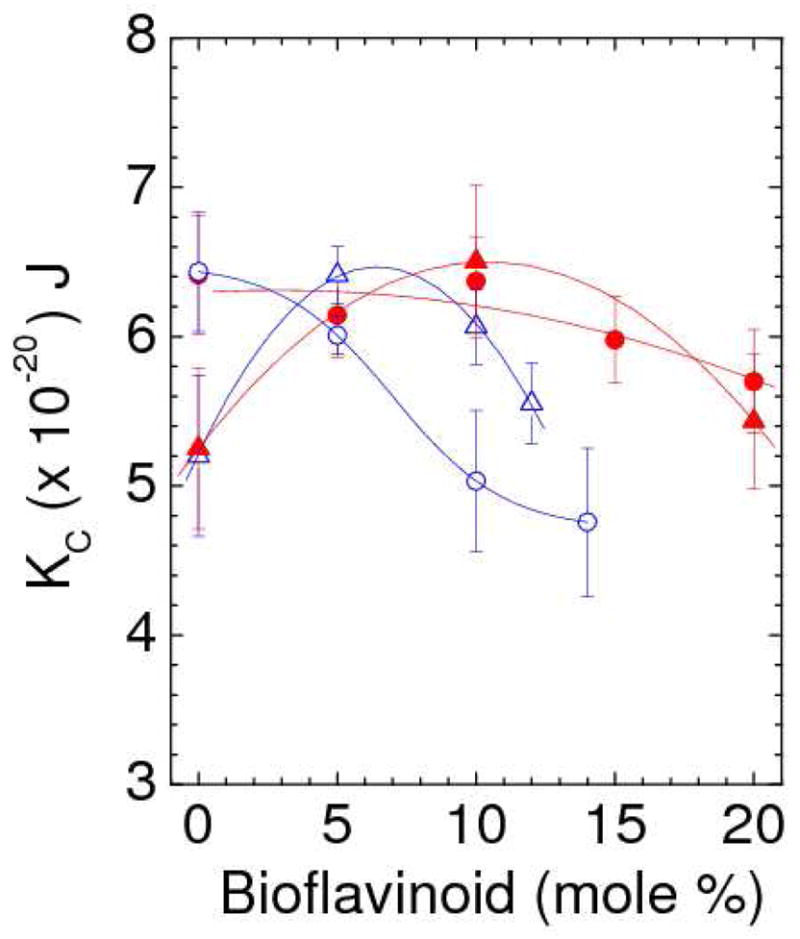
Bending modulus, KC, vs. concentration of genistein (solid symbols) and daidzein (open symbols) in DOPC (circles) and DPhyPC (triangles).
The values of the area compressibility modulus, KA = 2A1(∂γ/∂A1), given in Table I were obtained from the simulated results for the leaflet surface tension γ in Fig. 10. KA was clearly smaller with either bioflavinoid than for the DOPC control. As determined from the slopes in Fig. 10, KA for f=0.14 daidzein (190 mN/m) was closer to the control value (240 mN/m) than the KA for f=0.20 genistein (160 mN/m).
Figure 10.
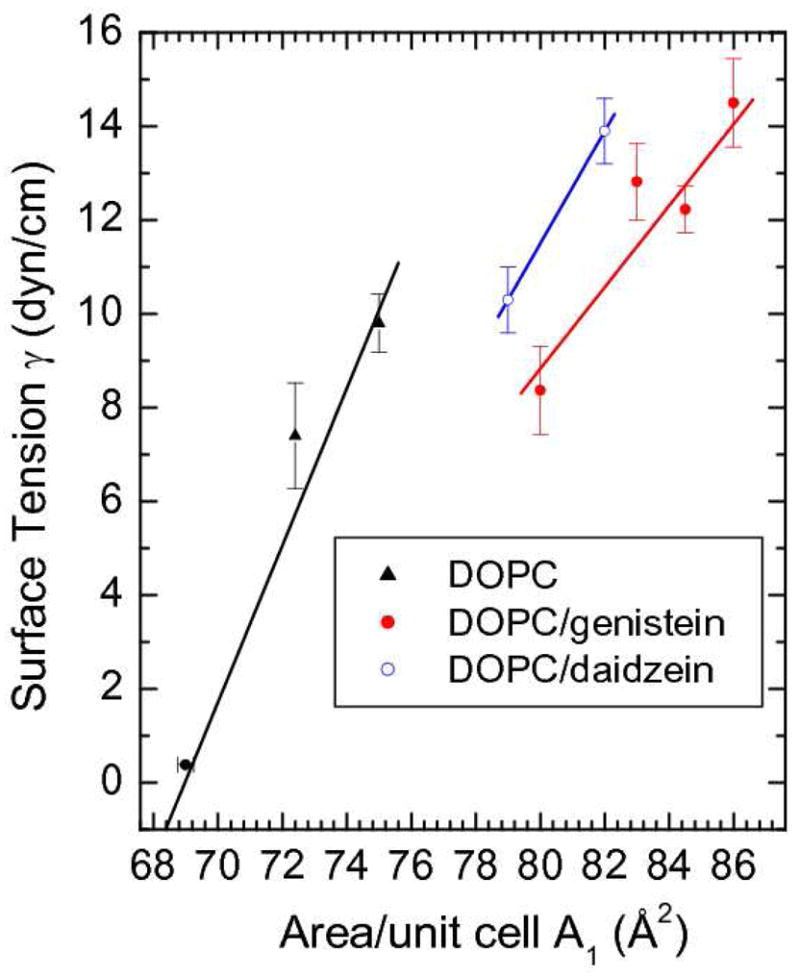
Surface tension, γ, vs. A1 for DOPC with and without 20 mole% genistein and 14 mole% daidzein from NPAT simulations except the γ=0 point for pure DOPC which was an NPT simulation.
Figure 11 shows two snapshots from the final 30 nsec point of the NPAT simulations. Electron density profiles resulting from the simulations at three fixed areas are shown in Fig. S4 in SI.
Figure 11.

Snapshots of the MD simulations for A) DOPC/20 mole% genistein at A1 = 83 Å2, and for B) DOPC/14 mole% daidzein at A1 = 79 Å2. Each snapshot is 1 out of 25,000 coordinate sets that comprise the ensemble; A) collected at 30 nsecs (5 nsecs before the end of the simulation) and B) 35 nsecs. Color coding is: hydrocarbon chains (grey), bioflavinoids (gold and with yellow oxygen atoms), lipid carbonyl oxygens (red), phosphate group (green), choline group (purple) and water (blue). The scale bar marks 20 Å.
Discussion
This study emphasizes the synergy between experiments and MD simulations. While the x-ray method provides firm structural data to the highest resolution possible in fully fluid lipid bilayer systems, the extraction of meaningful structural results becomes difficult upon the incorporation of additives that require more modeling parameters. On the other hand, simulations involve uncertainties in the force fields of the additives, and there are concerns that simulation times may not be long enough for additives to equilibrate to their experimental locations. The main test of the simulations in this paper is that the Fourier transforms of the real space electron density profiles agree with the x-ray |F(qz)| data. Best agreement was obtained by adjusting the unit cell areas A1 in NPAT simulations and this then provides estimates of A1, the head-head thickness DHH, and the positions zBF of the bioflavinoids within the bilayer. The thickness DHH was obtained from the experimental data with a minimal amount of modeling. The good agreement of the simulations for DHH is an important test of our procedure for obtaining A1 from the simulations. Importantly, for direct modeling of the experimental data, the simulations provide the widths of the distributions of the bioflavinoids and the lipid component groups; this means that the modeling does not require so many totally free parameters. Without imposing simulation results for A1 or zBP, the modeling of the experimental |F(qz)| data gives good agreement with the simulations for those quantities.
We find both genistein and daidzein located closer to the headgroup than to the center of the bilayer as qualitatively shown in Fig. 11. For quantitative evaluation of differences, we use our values of DHH/2 as a measure for the surface of the bilayer. Then, the depth of insertion DHH/2 – zBF from Table 1 is only ~0.1 Å greater for genistein than for daidzein in DOPC although it is ~ 1.1 Å greater in DPhyPC. These small differences in depth of penetration are consistent with genistein being more hydrophobic than daidzein. At first, this seems contrary to genistein having an additional OH group. However, that extra OH group can participate in intra-molecular hydrogen bonding with the adjacent carbonyl (Fig. 1), thereby decreasing the hydrophilicity of the carbonyl on genistein relative to that of daidzein. Our simulation indicates this intramolecular hydrogen bond is formed 95% of the time. Intramolecular hydrogen bonding in genistein is supported by 1H NMR linewidth experiments of these bioflavinoids in SDS micelles35 and the relative hydrophobicities are supported by the partitioning of genistein into octanol (logP = 3.04) being greater than for daidzein (logP = 2.51)36. Consistently, the C=O was associated with a water hydrogen 50% of the time for daidzein and only 25% of the time for genistein. Histograms of the bioflavinoid center of mass |z| coordinate (Fig. S5 in SI) also suggest genistein is slightly more hydrophobic; the distribution outliers, shown by enlarging the baseline in the inset, are inward for genistein and outward for daidzein.
It is also especially encouraging that the difference between the volumes VBF(calc) of the two bioflavinoids shown in Table I are the same in DOPC and DPhyPC and that these differences are reasonable given the replacement of COH in genistein by CH in daidzein. However, it seems unlikely that the volume of either bioflavinoid is so much different, as given in Table I, in DPhyPC compared to DOPC. More likely is that either bioflavinoid alters the volume of different lipids by different amounts. For example, if genistein condensed DOPC to 1294 Å3 and did not condense DPhyPC at all, then its volume would be 363 Å3 in both lipids. We attempted to obtain some perspective on this from our simulations. The fact that the simulations agreed so well with the experimental ‘unit cell’ volumes in Table I is another important test of the simulations. This success suggested trying to obtain the bioflavinoid volume using a well established component volume method. However, as noted in the original paper34, high accuracy cannot be expected from this method when there are closely overlapping distributions; indeed the results for VBF(sim) listed in Table I yield the unlikely result that genistein is much larger than daidzein. Nevertheless, these results are consistent with the bioflavinoids condensing rather than expanding DOPC. We propose that the values for VBF(calc) shown in Table I for DPhyPC are likely to be good estimates when bioflavinoids are added to most lipid bilayers.
Experimental validation of the simulation allows us to extract additional structural information that cannot be obtained from our experimental data. The narrow distributions of the bioflavinoids along the z direction (Fig. S5) are consistent with their long axes being preferentially parallel to the bilayer surface (see Figure 1 for definition of axes). This is further confirmed in the simulation by the two hydroxyl oxygens at opposite ends of the bioflavinoids having nearly equal average distances from the center of the bilayer and by directly obtaining the angle β of the long axes relative to the bilayer normal, shown in Fig. 12B. Hydrogen bonding of these two hydroxyls to water or phosphate in the interfacial region is the likely interaction responsible for this orientation, as well as for maintaining the location of the bioflavinoids close to the bilayer surface. The simulation also provides the angle α of the short axes of the bioflavinoids around their long axes. The distribution of α, shown in Fig. 12A, is peaked about α=0 which we define to be the value of α at which the plane of the rings is perpendicular to the bilayer surface and the C=O points towards the proximal bilayer surface.
Figure 12.


Probability histograms of bioflavinoids in DOPC membranes from the MD simulations for (A) the angle α of the short axis about the long axis and (B) the angle β of the long axis with respect to the bilayer normal. Colors are 20 mole% genistein (red) and 14 mole % daidzein (blue). The insets show α and β with respect to the long (L) and short (S) axes of the bioflavinoids, depicted in Figure 1.
Study of the elastic properties also benefits from the synergy of experiment and simulation in that our experiments provide the bending modulus KC and our simulations provide the area compressibility modulus KA. These two moduli are often related by
| (3) |
where 2DC is the hydrocarbon thickness. The value N=24 from the polymer brush theory fits experimental data for pure lipid bilayers quite well37, although the relation breaks down as cholesterol is added38. We observed that, within uncertainty, both bioflavinoids decreased KA relative to the control DOPC by about the same 40% when either bioflavinoid concentration was 20% and proportionately less with 14% daidzein. In contrast, KC remained nearly constant for genistein and decreased only about 20% for daidzein, so satisfying Eq. (3) would require DC to increase considerably. However, if we define DC to include only the hydrocarbons of the lipid, then our simulated DC decreases from 13.0 Å for DOPC alone to 11.8 Å with 20% genistein and to 12.6 Å with 14% daidzein. Even if we define DC to include the largely hydrophobic bioflavinoids, DC remains at 13.0 Å with 20% genistein and increases to 13.6 Å with 20% daidzein, so we conclude that Eq. (3) breaks down. Interestingly, Eq. (3) breaks down in the opposite way as for addition of cholesterol38. For DOPC, cholesterol increases KA and 2DC while keeping KC the same, so the right hand side of Eq. (3) becomes larger than the left hand side for cholesterol, rather than smaller as we find for bioflavinoids. This contrasting elastic behavior appears to be correlated with the structural difference that the long axis of cholesterol is preferentially oriented parallel to the bilayer normal whereas the long axis of the bioflavinoids is preferentially oriented parallel to the bilayer surface.
The largest difference that we observe between the effects of genistein and daidzein on the DOPC bilayer, both in modeling of experimental data and in our simulations, is in the area of the unit cell A1. The average increase of A1(exp) and A1(sim) for 20 mole% genistein is ~12% increase and ~8% for daidzein at its solubility limit of 14 mole%. In DPhyPC the increase of A1(exp) is also ~12% increase for 20 mole% genistein and ~8% for 12% daidzein at its solubility limit. Therefore, the area increase is proportional to the concentration of either bioflavinoid in either lipid. These increases may be compared to the 6% increase reported for 20 mole% of another bioflavinoid, curcumin, added to DOPC39.
One motivation for this work was to test the attractive hypothesis that the increased gA ion-channel lifetimes induced by bioflavinoids could be due to genistein reducing the energy of hydrophobic mismatch of the gA channel to the lipid bilayer by reducing the appropriate elastic moduli, thereby making the bilayer softer and more easily deformable. By consideration of the details of deformations, the appropriate elasticity moduli have been proposed to be KC40 and both KC and KA41. A simpler expression has been given14, 42–44 as
| (4) |
where L is hydrophobic channel length, d0 is bilayer hydrocarbon thickness and HB is a phenomenological spring constant to mimic the effects of both KC and KA. Decreasing KC and/or KA would decrease HB and ΔGbilayer, which, according to the hypothesis, would then increase channel lifetimes, as was observed. The hypothesis is therefore broadly consistent, for either bioflavinoid, with our results for KA and KC. One might also consider that bioflavinoids could induce monolayer intrinsic curvature, but Lundbaek et al. reported that monolayer intrinsic curvature does not play a major role12.
Another important hypothesis that explains how bioflavinoids could increase gA channel lifetimes follows from our result for DHH in Table 1 that bioflavinoids thin lipid bilayers. The hydrocarbon thickness d0 has been given as 2DC=27.1 Å for DOPC22 and 27.2 Å for DPhyPC45 and the hydrophobic channel length L of wild-type gA has been given as 22 Å13, so bioflavinoids would reduce the hydrophobic mismatch free energy in Eq. (4) by reducing L-d0. Of course, the average thinning will be smaller for the lower concentrations used in gA experiments14, but local thinning near a bioflavinoid could be comparable to the results in Table 1. Such thin local regions would then provide an effectively attractive interaction between the bioflavinoids and gA dimers. Once formed, gA dimers with neighboring bioflavinoids would be relatively more stable with respect to breaking into gA monomers and this would increase channel lifetimes.
However, neither of the preceding hypotheses is consistent with the reported experimental result that genistein is twice as effective as daidzein for increasing gA channel lifetimes14. Regarding the first hypothesis, our results are that the decrease in KA is nearly the same for both bioflavinoids up to the solubility limit of daidzein and that there is an even larger decrease in KC for daidzein on a per mole basis, so daidzein would be expected to be even more effective than genistein for increasing channel lifetimes. Regarding the second hypothesis, we find that thinning is nearly the same for daidzein and genistein on a per mole basis. As the concentration of daidzein in the gA lifetime experiments was about four times smaller than the limiting mole fraction f=0.14 (calculation given in supplementary material), the solubility limit does not account for the difference in lifetime results. Instead, the reason that genistein has a greater effect than daidzein on channel lifetimes is much simpler. The bioflavinoid concentrations reported in the gA channel lifetime experiments were based on the total amount of gA added to the system consisting of a black lipid membrane with its associated decane annulus and approximately 1000 times as much water by volume. Because genistein is more hydrophobic than daidzein, more of it partitioned into the bilayer when the overall reported concentrations were equal. From reported values of the partition coefficient, the log P of 3.04 for genistein and 2.51 for daidzein36 would give three times as much genistein as daidzein in the bilayer for equal aqueous concentrations. However, the finite ratio of aqueous to bilayer volume in the gA experiments14 alters the relative concentrations in the bilayer from a factor of 3 to a factor of 2 when equal overall amounts of bioflavinoid are added (see supporting material for the calculation). This alone accounts for the differences in the effect of the bioflavinoids genistein and daidzein on gA channel lifetimes.
Summary and Conclusions
This work combines X-ray diffuse scattering, volume measurements, and MD simulations to determine structural and elastic properties of DOPC and DPhyPC bilayers with the bioflavinoids genistein and daidzein. The unit cell volume, V1, obtained by direct measurements of lipid/bioflavinoid mixtures is in excellent agreement with V1 obtained from the MD simulations. There is good agreement between the electron density profiles and bioflavinoid positions obtained by MD simulations and model fits to the experimental form factor data. Both genistein and daidzein are located at the surface of the hydrocarbon region near the glycerol/carbonyl with the long axis parallel to the bilayer and the C=O preferentially pointing towards the bilayer surface. Genistein thins DOPC by ~2.3 Å at 20 mole %, while daidzein thins DOPC by ~1.5 Å at 14 mole %. Consistent with a theory for the effect of bioflavinoids on gramicidin lifetimes, both bioflavinoids generally softened bilayers. However, since the bending modulus KC decreased more with daidzein than with genistein and KA decreased the same for both on a per mole basis, softening of the membrane is not the reason that genistein increases gA channel lifetimes twice as much as daidzein. Similarly, our result that both bioflavinoids thin the bilayer is consistent with the other hypothesis that bioflavinoids alleviate the hydrophobic free energy penalty for forming gA channels, but our result that the thinning is the same on a per mole basis is inconsistent with the larger reported effect of genistein. That factor of two is quantitatively explained by the relative water/hydrocarbon partition coefficients36. Our simulation results and our experimental solubility limit results for daidzein are consistent with the partition coefficient result that genistein is more hydrophobic than daidzein.
Supplementary Material
Acknowledgments
This research was supported in part by Grant Number GM 44976 from NIGMS/NIH (STN,JN), the Howard Hughes Medical Institute (MR, YZ) and the Charles E. Kaufman Foundation (STN). It was supported in part (RV, RP) by the Intramural Research Program of the NIH, National Heart, Lung and Blood Institute, and utilized the high-performance computational capabilities at the National Institutes of Health, Bethesda, MD (NHLBI LoBoS cluster). X-ray scattering data were taken at the Cornell High Energy Synchrotron Source (CHESS), which is supported by the National Science Foundation and the National Institutes of Health/National Institute of General Medical Sciences under National Science Foundation award DMR-0225180. We especially thank Dr. Arthur Woll for obtaining our beam and for general support during our data collection at the G1 station. We thank Dr. Jianjun Pan for help with sample preparation and x-ray data collection at CHESS, Prof. Olaf Andersen for helpful discussions, and especially Dr. Gilman Toombes for very insightful criticism of a first draft.
Footnotes
Supporting information description: The supporting information (SI) section contains five figures that have been described in the main paper and calculations for the concentration of bioflavinoids in lipid membranes. This information is available free of charge via the Internet at http://pubs.acs.org.
Bibliography
- 1.Dixon RA, Ferreira D. Phytochemistry. 2002;60:205–211. doi: 10.1016/s0031-9422(02)00116-4. [DOI] [PubMed] [Google Scholar]
- 2.Birt DF, Hendrich S, Wang WQ. Pharmacol Therapeut. 2001;90:157–177. doi: 10.1016/s0163-7258(01)00137-1. [DOI] [PubMed] [Google Scholar]
- 3.Derand R, Bulteau-Pignoux L, Becq F. J Biol Chem. 2002;277:35999–36004. doi: 10.1074/jbc.M206121200. [DOI] [PubMed] [Google Scholar]
- 4.Akiyama T, Ishida J, Nakagawa S, Ogawara H, Watanabe S, Itoh N, Shibuya M, Fukami Y. J Biol Chem. 1987;262:5592–5595. [PubMed] [Google Scholar]
- 5.Bishop JM. Annu Rev Biochem. 1983;52:301–354. doi: 10.1146/annurev.bi.52.070183.001505. [DOI] [PubMed] [Google Scholar]
- 6.Coward L, Barnes NC, Setchell KDR, Barnes S. J Agr Food Chem. 1993;41:1961–1967. [Google Scholar]
- 7.Kuiper GGJM, Carlsson B, Grandien K, Enmark E, Haggblad J, Nilsson S, Gustafsson JA. Endocrinology. 1997;138:863–870. doi: 10.1210/endo.138.3.4979. [DOI] [PubMed] [Google Scholar]
- 8.Kuiper GGJM, Lemmen JG, Carlsson B, Corton JC, Safe SH, van der Saag PT, van der Burg P, Gustafsson JA. Endocrinology. 1998;139:4252–4263. doi: 10.1210/endo.139.10.6216. [DOI] [PubMed] [Google Scholar]
- 9.Rickard DJ, Subramaniam M, Spelsberg TC. J Cell Biochem. 1999:123–132. doi: 10.1002/(sici)1097-4644(1999)75:32+<123::aid-jcb15>3.0.co;2-k. [DOI] [PubMed] [Google Scholar]
- 10.Fanti P, Monier-Faugere MC, Geng Z, Schmidt J, Morris PE, Cohen D, Malluche HH. Osteoporosis Int. 1998;8:274–281. doi: 10.1007/s001980050065. [DOI] [PubMed] [Google Scholar]
- 11.Palacios VG, Robinson LJ, Borysenko CW, Lehmann T, Kalla SE, Blair HC. J Biol Chem. 2005;280:13720–13727. doi: 10.1074/jbc.M410995200. [DOI] [PubMed] [Google Scholar]
- 12.Lundbaek JA, Birn P, Tape SE, Toombes GES, Sogaard R, Koeppe RE, Gruner SM, Hansen AJ, Andersen OS. Mol Pharmacol. 2005;68:680–689. doi: 10.1124/mol.105.013573. [DOI] [PubMed] [Google Scholar]
- 13.Hwang TC, Koeppe RE, Andersen OS. Biochemistry-Us. 2003;42:13646–13658. doi: 10.1021/bi034887y. [DOI] [PubMed] [Google Scholar]
- 14.Lundbaek JA, Koeppe RE, Andersen OSP. Natl Acad Sci USA. 2010;107:15427–15430. doi: 10.1073/pnas.1007455107. [DOI] [PMC free article] [PubMed] [Google Scholar]
- 15.Lehtonen JYA, Adlercreutz H, Kinnunen PKJ. Biochimica Et Biophysica Acta-Biomembranes. 1996;1285:91–100. doi: 10.1016/s0005-2736(96)00154-x. [DOI] [PubMed] [Google Scholar]
- 16.Kučerka N, Nagle JF, Sachs JN, Feller SE, Pencer J, Jackson A, Katsaras J. Biophys J. 2008;95:2356–2367. doi: 10.1529/biophysj.108.132662. [DOI] [PMC free article] [PubMed] [Google Scholar]
- 17.Tristram-Nagle SA. Methods Mol Biol. 2007;400:63–75. doi: 10.1007/978-1-59745-519-0_5. [DOI] [PMC free article] [PubMed] [Google Scholar]
- 18.Kučerka N, Liu YF, Chu NJ, Petrache HI, Tristram-Nagle ST, Nagle JF. Biophys J. 2005;88:2626–2637. doi: 10.1529/biophysj.104.056606. [DOI] [PMC free article] [PubMed] [Google Scholar]
- 19.Lyatskaya Y, Liu YF, Tristram-Nagle S, Katsaras J, Nagle JF. Phys Rev E. 2001;63:0119071–0119079. doi: 10.1103/PhysRevE.63.011907. [DOI] [PMC free article] [PubMed] [Google Scholar]
- 20.Liu YF, Nagle JF. Phys Rev E. 2004;69:040901–040904(R). doi: 10.1103/PhysRevE.69.040901. [DOI] [PMC free article] [PubMed] [Google Scholar]
- 21.Kučerka N, Tristram-Nagle S, Nagle JF. Biophys J. 2006;90:L83–L85. doi: 10.1529/biophysj.106.086017. [DOI] [PMC free article] [PubMed] [Google Scholar]
- 22.Nagle JF, Tristram-Nagle S. Biochim Biophys Acta-Reviews on Biomembranes. 2000;1469:159–195. doi: 10.1016/s0304-4157(00)00016-2. [DOI] [PMC free article] [PubMed] [Google Scholar]
- 23.Nagle JF, Wiener MC. Biophys J. 1989;55:309–313. doi: 10.1016/S0006-3495(89)82806-1. [DOI] [PMC free article] [PubMed] [Google Scholar]
- 24.Klauda JB, Kučerka N, Brooks BR, Pastor RW, Nagle JF. Biophys J. 2006;90:2796–2807. doi: 10.1529/biophysj.105.075697. [DOI] [PMC free article] [PubMed] [Google Scholar]
- 25.Wiener MC, Suter RM, Nagle JF. Biophys J. 1989;55:315–325. doi: 10.1016/S0006-3495(89)82807-3. [DOI] [PMC free article] [PubMed] [Google Scholar]
- 26.Brooks BR, Brooks CL, 3rd, Mackerell AD, Jr, Nilsson L, Petrella RJ, Roux B, Won Y, Archontis G, Bartels C, Boresch S, et al. J Comput Chem. 2009;30:1545–1614. doi: 10.1002/jcc.21287. [DOI] [PMC free article] [PubMed] [Google Scholar]
- 27.Klauda JB, Venable RM, Freites JA, O’Connor JW, Tobias DJ, Mondragon-Ramirez C, Vorobyov I, MacKerell AD, Jr, Pastor RW. J Phys Chem B. 2010;114:7830–7843. doi: 10.1021/jp101759q. [DOI] [PMC free article] [PubMed] [Google Scholar]
- 28.Jorgensen WL, Chandrasekhar J, Madura JD, Impey RW, Klein ML. J Chem Phys. 1983;79:926–935. [Google Scholar]
- 29.Burendahl S, Danciulescu C, Nilsson L. Proteins. 2009;77:842–856. doi: 10.1002/prot.22503. [DOI] [PubMed] [Google Scholar]
- 30.Kučerka N, Katsaras J, Nagle JF. J Membr Biol. 2010;235:43–50. doi: 10.1007/s00232-010-9254-5. [DOI] [PMC free article] [PubMed] [Google Scholar]
- 31.Greenwood AI, Tristram-Nagle S, Nagle JF. Chem Phys Lipids. 2006;143:1–10. doi: 10.1016/j.chemphyslip.2006.04.002. [DOI] [PMC free article] [PubMed] [Google Scholar]
- 32.Tristram-Nagle S, Petrache HI, Nagle JF. Biophys J. 1998;75:917–925. doi: 10.1016/S0006-3495(98)77580-0. [DOI] [PMC free article] [PubMed] [Google Scholar]
- 33.Tristram-Nagle S, Kim DJ, Akhunzada N, Kucerka N, Mathai JC, Katsaras J, Zeidel M, Nagle JF. Chem Phys Lipids. 2010;163:630–637. doi: 10.1016/j.chemphyslip.2010.04.011. [DOI] [PMC free article] [PubMed] [Google Scholar]
- 34.Petrache HI, Feller SE, Nagle JF. Biophys J. 1997;72:2237–2242. doi: 10.1016/S0006-3495(97)78867-2. [DOI] [PMC free article] [PubMed] [Google Scholar]
- 35.Whaley WL, Rummel JD, Kastrapeli N. Langmuir. 2006;22:7175–7184. doi: 10.1021/la0606502. [DOI] [PubMed] [Google Scholar]
- 36.Rothwell JA, Day AJ, Morgan MRA. J Agr Food Chem. 2005;53:4355–4360. doi: 10.1021/jf0483669. [DOI] [PubMed] [Google Scholar]
- 37.Rawicz W, Olbrich KC, McIntosh T, Needham D, Evans E. Biophys J. 2000;79:328–339. doi: 10.1016/S0006-3495(00)76295-3. [DOI] [PMC free article] [PubMed] [Google Scholar]
- 38.Pan JJ, Tristram-Nagle S, Nagle JF. Phys Rev E. 2009;80:021931 (021931–021912). doi: 10.1103/PhysRevE.80.021931. [DOI] [PMC free article] [PubMed] [Google Scholar]
- 39.Sun Y, Lee CC, Hung WC, Chen FY, Lee MT, Huang HW. Biophys J. 2008;95:2318–2324. doi: 10.1529/biophysj.108.133736. [DOI] [PMC free article] [PubMed] [Google Scholar]
- 40.Huang HW. Biophys J. 1986;50:1061–1070. doi: 10.1016/S0006-3495(86)83550-0. [DOI] [PMC free article] [PubMed] [Google Scholar]
- 41.Harroun TA, Heller WT, Weiss TM, Yang L, Huang HW. Biophys J. 1999;76:3176–3185. doi: 10.1016/S0006-3495(99)77469-2. [DOI] [PMC free article] [PubMed] [Google Scholar]
- 42.Lundbaek JA. J Gen Physiol. 2008;131:421–429. doi: 10.1085/jgp.200709948. [DOI] [PMC free article] [PubMed] [Google Scholar]
- 43.Lundbaek JA. J Phys-Condens Mat. 2006;18:S1305–S1344. doi: 10.1088/0953-8984/18/28/S13. [DOI] [PubMed] [Google Scholar]
- 44.Lundbaek JA, Collingwood SA, Ingolfsson HI, Kapoor R, Andersen OS. J R Soc Interface. 2010;7:373–395. doi: 10.1098/rsif.2009.0443. [DOI] [PMC free article] [PubMed] [Google Scholar]
- 45.Tristram-Nagle S, Kim DJ, Akhunzada N, Kucerka N, Mathai JC, Katsaras J, Zeidel M, Nagle JF. Chem Phys Lipids. 2010;163:630–637. doi: 10.1016/j.chemphyslip.2010.04.011. [DOI] [PMC free article] [PubMed] [Google Scholar]
Associated Data
This section collects any data citations, data availability statements, or supplementary materials included in this article.