Abstract
Background
Objective assessment of wall motion (M) and thickening (T) will aid in diagnosis of Coronary Artery Disease (CAD) from myocardial perfusion SPECT (MPS). We aimed to develop and validate an improved fully automated M/T segmental scoring system for MPS.
Methods
100 normal gated stress/rest Tc-99m sestamibi MPS scans from patients with low-likelihood of CAD (LLk) were used to derive the regional normal M/T ranges. A new automatic algorithm incorporated regional dependence on the global contractility in polar map coordinates by linear regression analysis and automatically derived 17-segment M (scale 0–5) and T (scale 0–3) scores. We validated this new method in 630 consecutive Tc-99m stress MPS studies in patients with suspected CAD and available correlating angiography, and an additional 241 LLk studies. Two independent observers with 12 and 30 years of experience in nuclear cardiology, blinded to clinical and angiographic data, scored M/T in 17-segments for all 971 studies.
Results
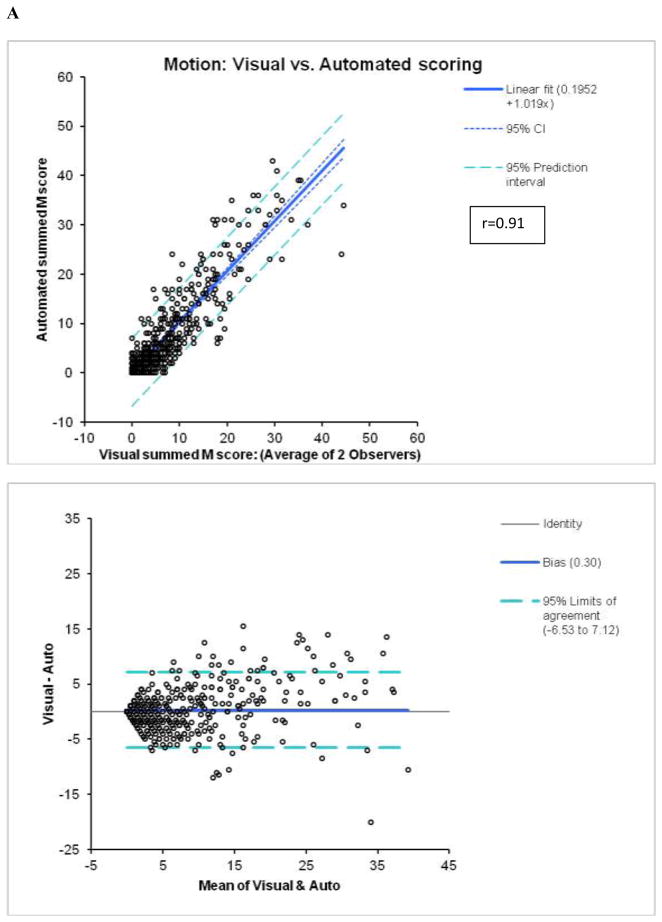
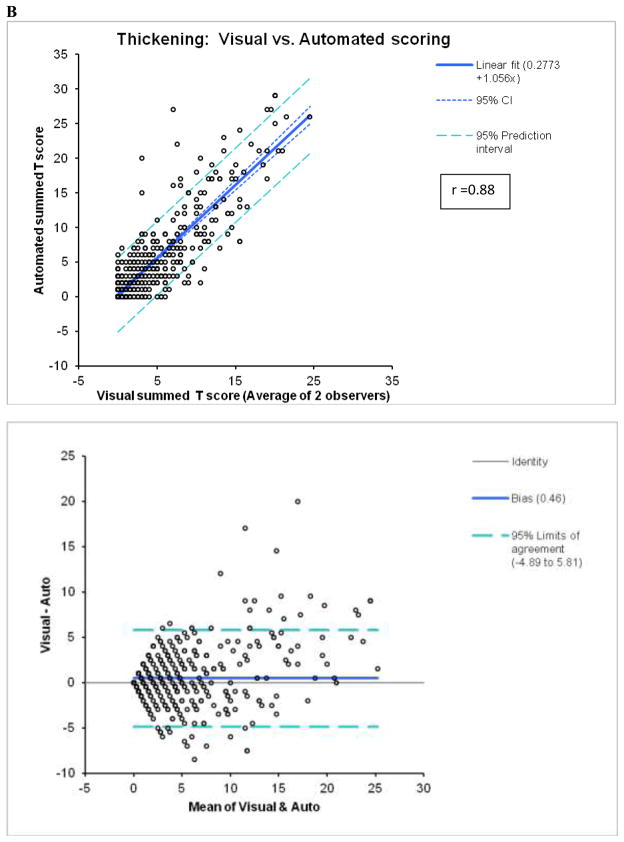
Computation time was < 1 sec per case. In the angiography group, there was a high correlation between the summed scores (averaged for 2 observers) and automatic scores with r=0.91 (slope=1.02, offset=0.2; p < 0.0001) for M and r=0.88 (slope=1.06, offset=0.28 for T; p < 0.0001). Weighted kappa was 0.63 for M and 0.57 for T, with expected agreement of 89% (M) and 91% (T) in individual segments (n=10710). Weighted kappa between 2 experts was 0.45 for M and 0.52 for T. The normalcy rate in LLk cases was 96% for automated M and 99% for T (summed score < 3). Detection of the angiographically significant disease by automated motion or thickening scoring was better than or equivalent to individual expert observer scoring, and better than the previous automated system.
Conclusions
Fully automated scoring of MPS regional ventricular function can be performed rapidly, is highly correlated with expert visual scoring, can outperform individual experienced observers in the detection of CAD by wall thickening from MPS, and avoids inter-observer variability.
INTRODUCTION
Myocardial perfusion SPECT (MPS) provide valuable information about both perfusion and function of the left ventricle (LV). We have previously developed optimized methods for automated perfusion scoring, which have high performance in detection of coronary artery disease (CAD) (1). Accurate regional assessment of contractile function is also of great importance since it could further enhance the detection of CAD (2) and provide additional prognostic information (3). Automated assessment of regional three-dimensional left ventricular function can provide highly reproducible objective and rapid assessment of regional parameters. In contrast, visual segmental scoring is laborious and is associated with significant inter- and intra-operator variability. We aimed to develop and validate an improved fully automated motion (M) and thickening (T) segmental (AHA 17-segment) scoring system for MPS, which is based on analysis of normal values in patients with low-likelihood of disease and quantitative deviations from normal thresholds without training the system by subjective expert observer scoring in abnormal patients (4). Such a method allows us to compare the automated performance to the expert scoring in a large population and potentially demonstrates advantages over visual scoring. Furthermore, by this approach we remove the subjective aspect associated with training the system with a particular visual perception of functional abnormalities.
MATERIALS AND METHODS
Patients
In brief, the subjects were consecutively selected from the patients who were referred to the Nuclear Medicine Department, Sacred Heart Medical Center, Eugene, Oregon, from March 1, 2003, to December 31, 2006, for rest and stress electrocardiography (ECG) gated MPS. The low likelihood (LLk) studies were obtained from patients who performed an adequate treadmill stress test, did not have correlating coronary angiography available, but had < 5% likelihood of CAD using the Diamond and Forrester criteria based on age, sex, symptoms, and ECG response to adequate treadmill stress testing (5). In the group with angiographic correlation, all patients with a prior history of CAD, cardiomyopathy, significant valve disease, left bundle branch block, and paced rhythm were excluded. Gated MPS and coronary angiography had to be performed within 60 days without a significant intervening event.
With these selection criteria, a total 971 studies were identified for the purpose of this study. This population consisted of 2 sub-groups of patients: 630 patients with gated stress MPS and correlative angiography as described above and 341 patients with gated MPS and LLk of CAD who were classified as normal. The clinical characteristics for all patients in this study are summarized in Table 1. For the normal limit development, the first 100 LLk cases have been used and the rest of the LLk studies (241) were used during the evaluation of the program. All angiographic patient characteristics are given in Table 2.
Table 1.
Patient characteristics
| Variables | Angiography group n=630 (100%) | LLk group (n=341) (100%) |
|---|---|---|
| Age, years | 64.1 ± 11.7 | 52.4 ± 11.4 |
| Gender, males | 357 (57%) | 133 (39%) |
| BMI | 30.5 ± 6.4 | 29.1 ± 6.4 |
| Myocardial infarction | 0 (0%) | 0 (0%) |
| Family History | 264 (42%) | 184 (54%) |
| Hypertension | 399 (63%) | 137 (40%) |
| Smoking | 121 (19%) | 80 (23%) |
| Diabetes | 173 (27%) | 0 (0%) |
| HLD | 324 (51%) | 134 (39%) |
| Symptoms | ||
| None | 174 (28%) | 201 (59%) |
| Atypical or non-anginal | 145 (23%) | 19 (6%) |
| chest pain | ||
| Typical angina | 187 (30%) | 113 (33%) |
| MPS Protocol | ||
| Rest/Stress-99mTc-sestamibi | 100% | 100% |
| Treadmill | 208 (33%) | 341 (100%) |
| Adenosine | 179 (28%) | 0 |
| Adenosine + Walk | 240 (38%) | 0 |
Table 2.
Angiographic patient characteristics
| Disease | Number of patients 630 (100%) |
|---|---|
| No stenosis ≥ 70% | 178 (28%) |
| Stenosis ≥ 70% | 452 (72%) |
| 1 Vessel disease ≥ 70% | 199 (32%) |
| 2 vessel disease ≥ 70% | 142 (23%) |
| 3 Vessel Disease ≥ 70% | 111 (18%) |
Image Acquisition and Reconstruction Protocol
The details of image acquisition and tomographic reconstruction have been previously described (6). In brief, studies were performed by using standard 99mTc-sestamibi rest/stress protocols. Data were acquired on Vertex, dual-detector scintillation camera with low energy high-resolution collimators (Philips Medical Systems, Milpitas, CA). Vantage Pro attenuation correction transmission images were also collected, but were not used for the reconstruction of the gated data or any analysis in this study. The system SPECT resolution for this type of camera with high resolution collimators and FBP reconstruction is approximately 10 mm.
Only gated stress images were used in this analysis. All subjects were imaged at 60 minutes following the administration of Tc-99m sestamibi at rest, followed by stress images taken at 15 to 45 minutes after radiopharmaceutical injection during stress protocol (exercise, adenosine or adeno-walk).
Tomographic reconstruction was performed by use of the AutoSPECT software (7). Emission images were automatically corrected for non-uniformity, radioactive decay, and motion during acquisition, and subjected to 3-point spatial smoothing. The alignment of the projection data to the reconstruction matrix was applied to determine the mechanical center of rotation. Data was reconstructed by the filtered back projection method using Butterworth post-filters with an order of 10 and a cutoff of 0.66 for stresses MPS. Time binning was performed both into 8-bin (71%) and 16-bin (29%) datasets. 31 out of 341 LLk cases were acquired into 8-bin datasets. Attenuation correction was not performed on gated images.
Coronary Angiography
Coronary angiography was performed using the standard Judkins method. All coronary angiograms were visually interpreted by experienced cardiologists. All data has been divided into significant and insignificant stenosis based on coronary angiography interpretation (4). Significant stenosis is classified as ≥70% stenosis in any vessel or ≥50% in Left Main. The number of vessels diseased were defined as the number of vessels with ≥70% stenosis (Left Main ≥50% was considered as 2 vessels).
Computational Methods
100 normal 8-bin gated stress/rest Tc-99m sestamibi MPS scans from patients with LLk of CAD were used to derive the regional normal M/T ranges. We analyzed the normal distribution of the polar map motion and thickening parameters in polar map coordinates obtained after automated detection of the LV by the QGS algorithm (8). Regional motion in millimeters (mm) was defined as the distance between end-diastolic (ED) and end-systolic (ES) mid-myocardial surface in the direction normal to the mid-myocardial surface for each polar map location. Thickening at each polar map point in % was defined as the increase of myocardial thickness (distance between the endocardial and epicardial surface) at the ES phase as compared to the ED phase, and also in the direction of the mid-myocardial surface normal (9). In previous study, our group has noted significant heterogeneity of normal limits (9), and attempted the development of abnormality criteria by maximizing agreement with a visual reader (4). In this work, we approach this problem differently. Instead of maximizing the agreement with the reader, we analyze the LLk population alone to determine the normal distribution of motion both regionally and in relation to the apparent global motion of the LV. Such an approach has the advantage of being independent of subjective visual scoring, which is highly variable. In a normal population, there is significant variation of the apparent left ventricular motion and thickening manifested by variable ejection fractions (EF) above normal range primarily due to the partial volume effects(10). In our normal LLk patients, that range was 45–87%. Furthermore, there are significant regional variations of the normal distribution in motion (11) and thickening (9, 12). Normal limits can be established regionally in a traditional method mean ±standard deviations; however, variations would be very wide since global motion and thickening is highly correlated with EF, which is influenced by partial volume limitations(9). In order to circumvent this problem, we have redesigned the approach to the development of normal limits. This new approach is detailed below.
We have analyzed the normal regional segmental motion and thickening dependencies of the EF in the group of LLk patients. We have found that for all segments, there is a strong linear correlation of local motion and thickening parameters with the global EF values even if the EF values were all normal. The regional-to-global correlations were positive as expected, and significant for all segments. Therefore, the linear regression analysis (13) was performed for each of the 17 AHA segments for motion and separately for thickening. The average expected segmental motion (Mi) and thickening (Ti) in a given patient was estimated for each segment (i) as follows:
| (1) |
where ITi and IMi are the linear regression intercepts for motion and thickening and SMi and STi are the respective motion and thickening slopes for each segment derived from the regression analysis. Consequently, the standard deviations of the residuals of the motion and thickening estimates for the fitted regression lines are defined as (14):
where N is the number of subjects (N=100) and EFn is the EF for each subject. Subsequently, we estimated the expected lower normal limits for motion and thickening (LLMi, LLTi) for each segment (i) as the 95% linear confidence limits below the regression line as follows.
| (3) |
Therefore, the normal motion and thickening limits obtained in such a manner were decreasing with lower normal EF. From our LLk data, we determined that normal EF values were ≥50% and therefore this was assumed to be the minimum value in the equations 1 and 2. This approach ensured that lower normal limits for a given patient match patient EF, otherwise high EFs in normal LLk population would be skewing upward the average normal limit values.
A new automatic scoring algorithm, which incorporated these linear regression relationships locally in polar map coordinates, has been implemented. The severity of motion and thickening for each polar map location is calculated in SEMi, SETi units below the regression line, linearly normalized between the lower normal limit values (LLMi, LLTi) and the maximal abnormality (≤ 1 mm motion corresponding to motion score 4 and ≤ 5% thickening corresponding to motion score 3). In addition, any negative motion was assigned a score of 5. Note that this method does not require any training or input of the expert visual observer (4) and it is based purely on the analysis of the normal characteristics of the Llk cases with normal motion and thickening. The software automatically derives 17-segment M scores based on the severity number of SE units (scale 0–5): 0 Normal, 1 Mildly hypokinetic, 2 Moderately hypokinetic, 3 severely hypokinetic, 4 akinetic, 5 dyskinetic, and T scores (scale 0–3), 0 normal, 1-mildly/equivocally abnormal, 2-moderately to severely/definitely abnormal, 3-no systolic wall thickening, (15).
Visual scoring and analysis with previous quantitative system
To validate this new automated scoring method by comparison to expert visual scoring, we performed independent manual 17-segment M and T scoring by two independent observers with 12 and 30 years of experience in nuclear cardiology, both board certified in nuclear cardiology, blinded to clinical and angiographic data and to any software analysis. These 2 experts (SD, MF) scored M/T visually in 17-segments for all 971 studies on the 0–3 scale for thickening and 0–5 scale for motion as previously described (15). This process took several months.
For comparison, we also analyzed all the data with a previously developed regional M/T scoring system, which was based on training by a visual observer. This development is described in detail in previous publications from our group (4, 9).
Automatic processing
All cases were processed with QGS software, which automatically detects the left ventricular endocardial and epicardial contours as previously described (8). Subsequently, these contours were used to provide the input for the new M/T scoring system as described above. Two experienced technologists blinded to any clinical or software results verified the placement of the contours by the automated algorithm in two separate sessions. In the first session, adjustment was judged to be necessary in 161/630 angiographic cases (25.5%) of the cases and in 42/341 LLk cases (12.4%). Majority of these were subjective minor adjustments at the valve plane and not necessitated by algorithmic failure. Repeated verification of contour placement was performed by a different technologist to test the reproducibility of the system in the angiographic group with 78/630 contours adjusted (12.3%). All other processing was fully automated.
Statistical analysis
Analyze-It software within Microsoft Office Excel (version 2.10) was used for all statistical computations. Receiver-operator-characteristic (ROC) curves were analyzed to evaluate the diagnostic performance of summed M and T scores. The differences between the receiver-operator-characteristic areas under the curves (ROC-AUC) were compared by Analyze-It statistical package using the Delong-Delong method (19). One sample proportion test in STATA 10.1 was utilized to compare proportions of abnormal scores. Linear regression, Bland–Altman and Kappa analysis was performed with linear weights by Analyze-It statistical package.
RESULTS
Computation time was < 1 sec per case on the 64-bit PC computer with Intel Xeon X5450 processor operating at 3GHZ. The process was fully automated and performed in batch mode for all 971 cases simultaneously with automatic dump of the results to the Microsoft Excel spreadsheet. The processing time of the entire cohort was approximately 20 minutes.
Agreement with visual scoring
In the angiography group, there was a high correlation between the summed scores (averaged for 2 observers) and automatic scores with r=0.91 (slope=1.02, offset=0.20; p < 0.0001, standard error =3.5) for M and r=0.88 (slope=1.056, offset=0.28, standard error =2.7; p < 0.0001) for T (Figure 1). When these correlations were assessed separately for 8-bin and 16-bin cases, the 8-bin correlations were slightly higher for M (r=0.92 for 8-bin vs. r=0.89 for 16-bin, p =0.043) and for T (0.89 for 8-bin vs. 0.85 for 16-bin), p=0.044 probably reflecting the fact that the LLK data used in the development of normal limits were 8-bin. However, 8-bin or 16-bin r-values for M or T were not significantly different from respective r-values for the whole population. Correlations between the average users’ scores and the previous automatic method for M (r=0.88, slope =0.99, offset =0.8, standard error =3.9; p < 0.0001) and T (r=0.83, slope =1.13, offset =0.73, standard error=3.6; p < 0.0001) scoring were lower with higher offsets. The lower offsets reflect better specificity of the new system in normal studies. Weighted kappa was 0.63±0.01 for M and 0.57±0.01 for T scoring in individual segments (n=10710) as compared to the average of two expert observers (Tables 3 and 4). For the previous implementation of the system (4), weighted kappa values of 0.58±0.01 for M and 0.55±0.01 for T were lower than for the new system, especially for motion.
Figure 1.
Agreement between automated and visual summed M (A) and T (B) scores.
Table 3.
Kappa agreement for 17-segment scoring between the automated system and the average of 2 observers for motion (A) and thickening (B)
| A | |||||||
|---|---|---|---|---|---|---|---|
| 2 Observers combined | |||||||
| Automated system | 0 | 1 | 2 | 3 | 4 | 5 | Total |
| 0 | 8054 | 433 | 143 | 28 | 0 | 0 | 8658 |
| 1 | 432 | 522 | 156 | 111 | 2 | 0 | 1223 |
| 2 | 40 | 180 | 118 | 147 | 15 | 0 | 500 |
| 3 | 3 | 19 | 58 | 106 | 53 | 0 | 239 |
| 4 | 0 | 1 | 17 | 21 | 40 | 8 | 87 |
| 5 | 0 | 0 | 0 | 1 | 0 | 2 | 3 |
|
| |||||||
| Total | 8529 | 1155 | 492 | 414 | 110 | 10 | 10710 |
| B | |||||||
|---|---|---|---|---|---|---|---|
| 2 Observers combined | |||||||
| Automated system | 0 | 1 | 2 | 3 | Total | ||
| 0 | 8529 | 462 | 85 | 14 | 9090 | ||
| 1 | 500 | 377 | 175 | 33 | 1085 | ||
| 2 | 58 | 111 | 174 | 57 | 400 | ||
| 3 | 4 | 18 | 36 | 77 | 135 | ||
|
| |||||||
| Total | 9091 | 968 | 470 | 181 | 10710 | ||
Table 4.
Agreement between 2 observers for 17-segment motion (A) and thickening (B) scoring
| A | |||||||
|---|---|---|---|---|---|---|---|
| Observer 2 | |||||||
| Observer1 | 0 | 1 | 2 | 3 | 4 | 5 | Total |
| 0 | 8529 | 473 | 542 | 120 | 13 | 4 | 9681 |
| 1 | 34 | 7 | 14 | 4 | 1 | 1 | 61 |
| 2 | 99 | 49 | 97 | 44 | 3 | 1 | 293 |
| 3 | 109 | 71 | 189 | 120 | 26 | 8 | 523 |
| 4 | 15 | 12 | 40 | 45 | 30 | 9 | 151 |
| 5 | 0 | 0 | 0 | 1 | 0 | 0 | 1 |
|
| |||||||
| Total | 8786 | 612 | 882 | 334 | 73 | 23 | 10710 |
| B | |||||
|---|---|---|---|---|---|
| Observer 2 | |||||
| Observer 1 | 0 | 1 | 2 | 3 | Total |
| 0 | 9091 | 384 | 230 | 24 | 9729 |
| 1 | 171 | 61 | 58 | 10 | 300 |
| 2 | 122 | 116 | 215 | 45 | 498 |
| 3 | 17 | 30 | 82 | 54 | 183 |
|
| |||||
| Total | 9401 | 591 | 585 | 133 | 10710 |
Reproducibility of visual and automated scoring
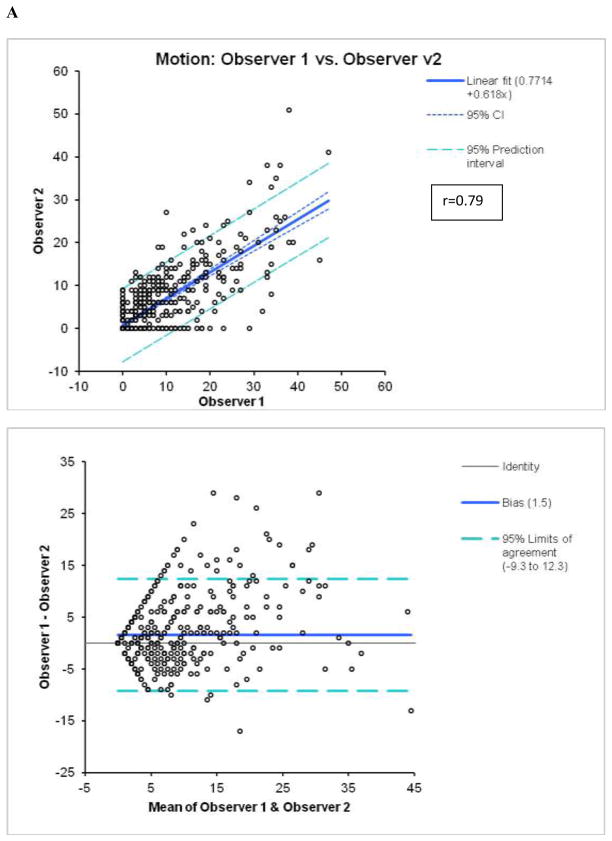
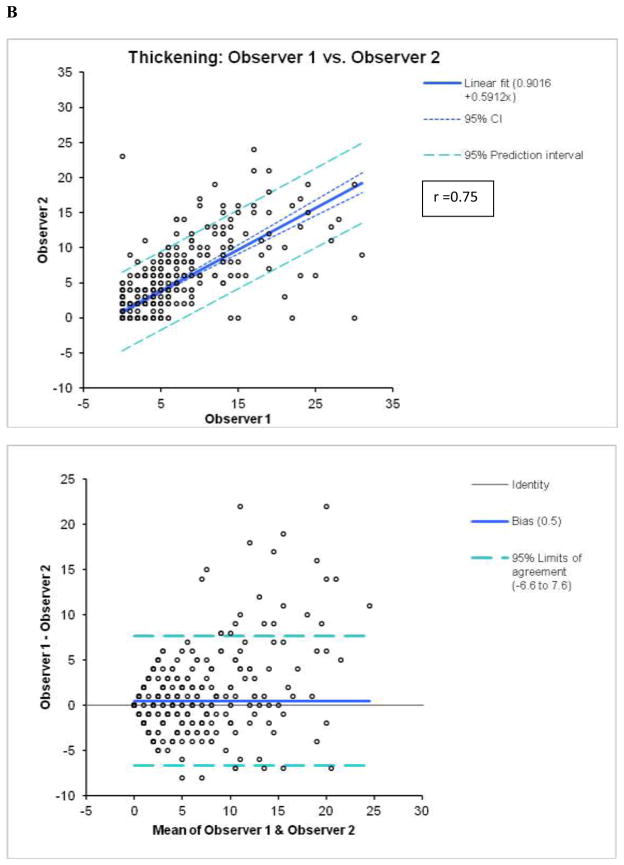
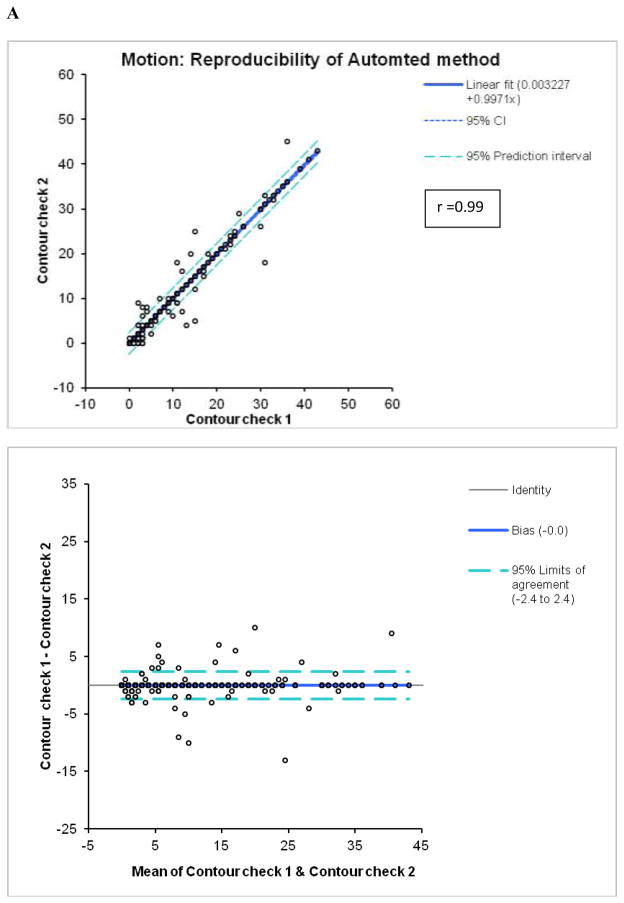
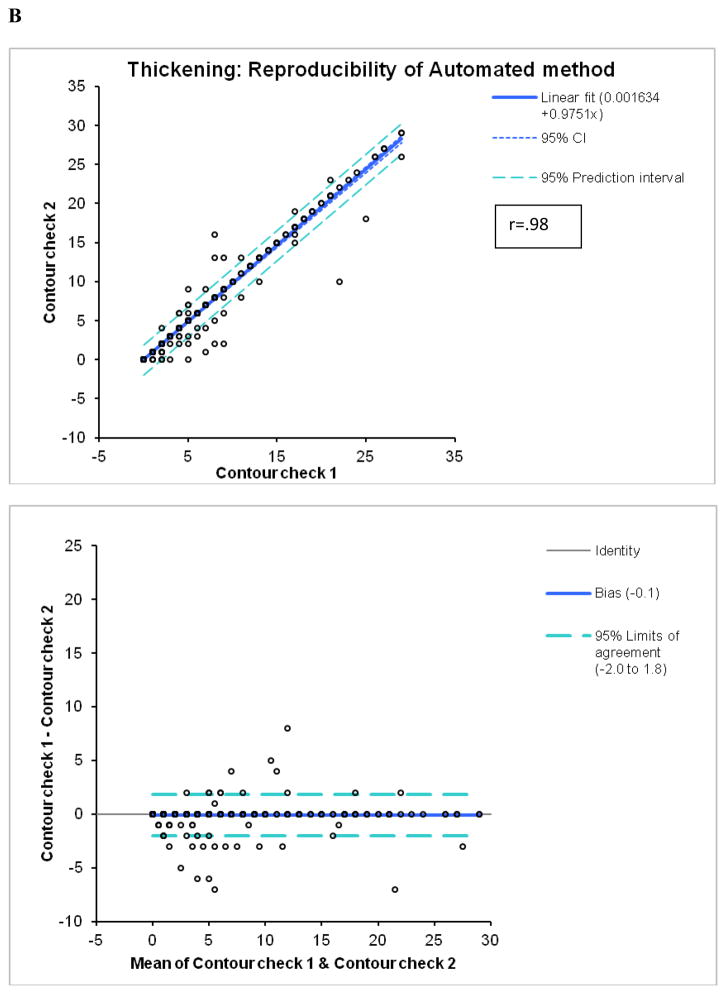
By Bland-Altman analysis of the scores from the 2 observers, the 95% confidence intervals (CI) for summed M (−9.3 to 12.3, bias=1.5) and T (−6.6 to 7.6, bias =0.5), visual scores were significantly wider than CI for the software (M:−2.4 to 2.4, bias=0; T:−2.0 to 1.8, bias =−0.1). The correlations of summed visual scores between 2 observers for M and T scores (Figure 2) were lower than the correlations between two tests for automated software with two different technologists performing contour check (Figure 3). Furthermore, visual correlation between two observers for both M and T (Figure 2) were lower than the correlation of averaged reader scores with the software (Figure 1). In addition, the readers’ correlations, unlike software correlations had slopes significantly different from unity (slopes 0.68 for M and 0.59 for T), reflecting the individual subjectivity of abnormal motion and thickening scoring.
Figure 2.
Reproducibility of M (A) and T (B) scores between 2 visual observers.
Figure 3.
Reproducibility of M (A) and T (B) scores for the automatic software with two expert technologists checking independently left ventricular contours.
By kappa analysis, weighted kappa between two experts was 0.45±0.01 for M, with expected agreement of 89%, and 0.52±0.01 for T with expected agreement of 89% (Tables 3 and 4), which was lower than the kappa for the agreement between the system and two observers. The linear kappa and agreement between two contour checks for the automated software were significantly higher for both M (0.96) and T (0.95) scoring.
The normalcy rate (summed M or T score < 3) in LLk in the remaining 241 cases was 98% (236/241) with a maximal score of 12 for automated M and 99% (238/241) with a maximal score of 4 for T. The normalcy rate of the visual scores for the average of two observer scores were (234/241) 97% for M and 98% (236/241) for T, which was not significantly different from the automated normalcy rates. The normalcy rates of the previous system were 205/241 (85%) with maximal score 18 for M and 210/241 (87%) with maximal score of 13 for T. Both M and T normalcy rates for the old system were significantly lower than the respective normalcy rates for the new system and for the visual scores.
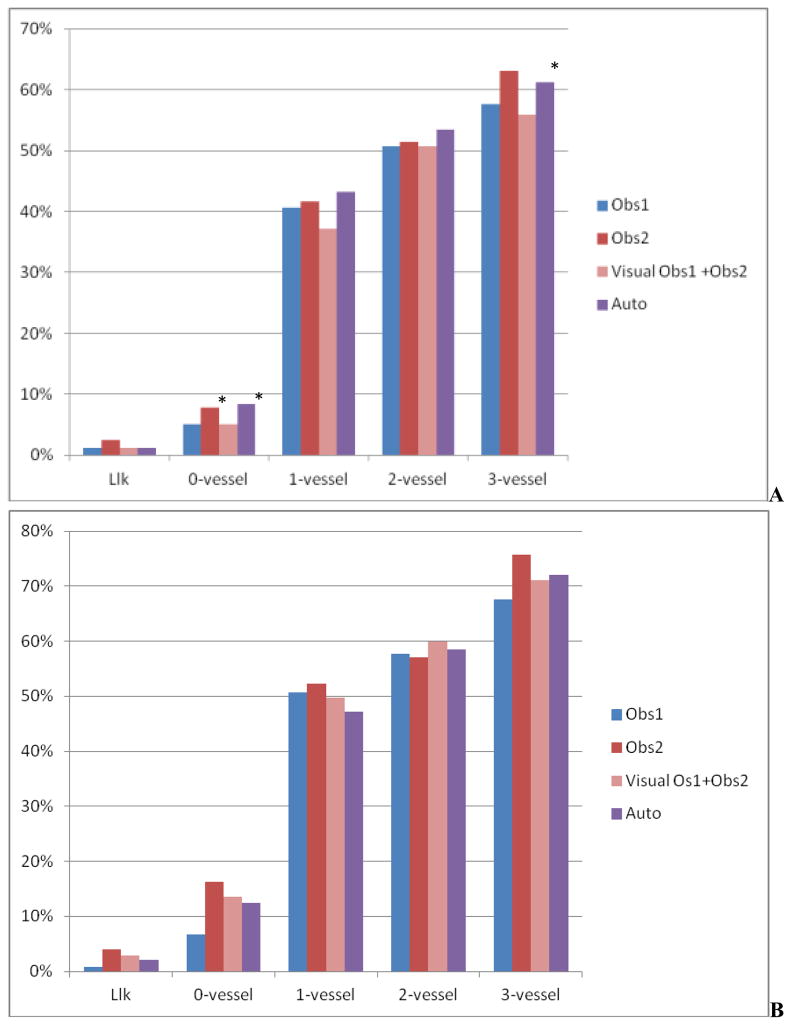
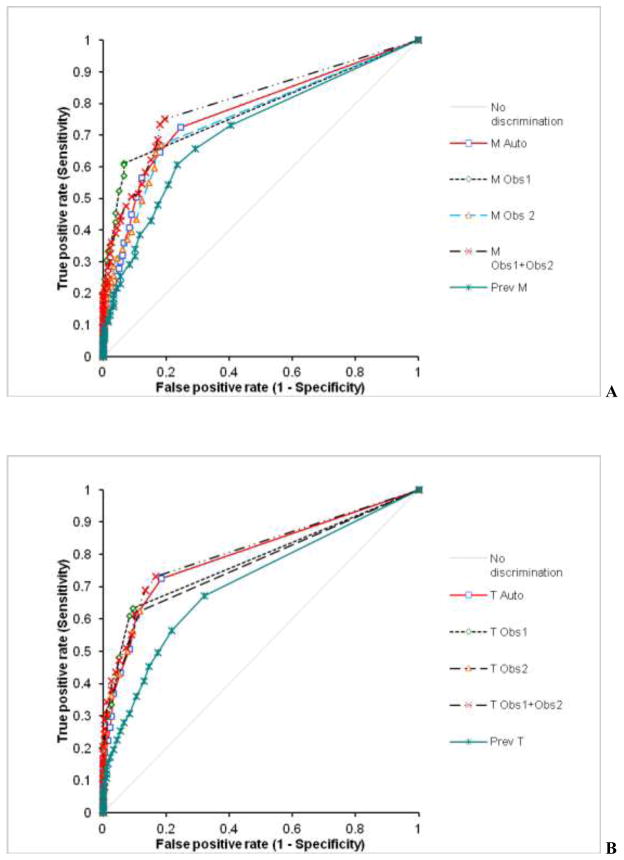
The percentage of abnormal summed M and T scores for LLk cases, cases with stenosis ≤ 70% stenosis, and 1 to 3-vessel disease cases is shown in Figure 4. When compared to the previous system, the number of abnormal M and T scores were significantly reduced in cases with no disease (12%, vs. 24%, p < 0.001 for M and 8% vs. 17%, p < 0.05) and in cases with disease (57% vs. 60% for M and 51% vs. 50% for T scores, P=NS). A comparison of the receiver operator characteristics (ROC) curves for the detection of angiographically significant disease in 630 cases by summed M/T scores for the new algorithm, the observers, and the previous method is shown in Figure 5. Corresponding areas under the ROC curve (ROC-AUC) are listed in Table 5. The automated system had diagnostic performance similar to individual experts in M scoring and outperformed one expert when T scores were used. A combination of two visual expert readings outperformed the automatic system for M, but not for T scoring. The M/T ROC-AUC for the previous method were significantly lower than for any of the visual observers, combined visual scoring or the new system.
Figure 4.
Percentage of abnormal summed scores for Motion (A) and Thickening (B) for individual observers (Obs1, Obs2), combined observers (Obs1+Obs2) and automatic reading in patients with LLk of disease and 0, 1, 2, and 3-vessel disease by angiography. * P < 0.05 vs. Obs. 1 and automatic system (Auto)
Figure 5.
ROC curves for the detection of angiographically significant CAD disease by M (A) and T (B) for individual observers (Obs1, Obs2), combined Observers (Obs1+Obs2), and automatic system (Auto) and previous system (Prev). ROC-AUC are given in Table 5
Table 5.
ROC areas under curves (see Figure 5) for the detection of angiographically significant CAD disease by M (A) and T (B) for individual observers (Obs1, Obs2), combined Observers (Obs1+Obs2), and automatic system (Auto)
| ROC-AUC | Obs1 | Obs2 | Obs1+Obs2 | Prev | Auto |
|---|---|---|---|---|---|
| Motion | 0.78# | 0.76# | 0.80¥ | 0.71 | 0.77# |
| Thickening | 0.78# | 0.77# | 0.81¥ | 0.71 | 0.80*# |
P< 0.05, vs. Obs1 and Obs2
P < 0.05 vs. Obs2,
P < 0.05 vs. Prev
DISCUSSION
In this study, we have presented the design and validation of the improved scoring system for regional left ventricular motion and thickening derived from MPS. In particular, we have designed a new method for the establishment of lower normal limits for the motion and thickening based on the relationship between the global left ventricular EF with regional segmental values. We found both regional and global heterogeneity of the normal limits, and applied linear regression analysis to remove the regional dependence on the apparent variable global contractility in normal subjects. This approach does not require training by the visual reading of scores and is purely algorithmic in design. The normal limits are established only from the LLk normal data. It should be noted that high normal EF may often occur due to partial volume effect for smaller hearts (10), and the correction of the normal limits for the global apparent contractility addresses this problem. The scoring of M and T is assumed to be linear between lower limits (at score 1) and upper scores bounded by the physical limits (no evidence of motion or thickening).
Despite the fact that no specific training by observers’ visual scoring has been performed, the agreement with visual scoring has been improved over the existing method, which explicitly maximized the agreement with the visual observer during the system training. In particular, the specificity and normalcy rate of the new system is significantly improved as compared to the previous algorithm. One of several explanations for this is that the visual observers in this study were different and were experienced nuclear cardiology practitioners. Furthermore, in the previous approach, normal thresholds were established by adjusting the number of standard deviations (from 1.0 to 3.4) based on abnormal visual scores. However, fundamentally the standard deviation of motion or thickening values in normal subjects reflects the actual variability of the normal images. The adjustments of the threshold values were most likely caused by an insufficient number of normal scans in the lower range of normal EFs used in previous development. In addition, previous work was optimized for 20-segment scoring, and subsequently the algorithm for conversion from 20-segment to 17-segment was used (16). However, since this conversion method can be used for both manual and automatic scores, and was shown to have high accuracy previously, this is likely a minor factor.
We have compared the developed system to the expert visual observer scoring –currently the only available gold standard for the regional magnitude of M/T abnormalities. We have obtained visual scores from two experienced observers both practicing nuclear cardiology in a large group (n=971) group of patients. These scores were obtained over a period of a few months and involved significant time effort from these physicians. Physicians were blinded to the clinical, angiographic and computer analysis information; therefore, the scoring is based on the images alone. Despite the considerable experience of the observers, we have found a significant inter-observer variability especially in the magnitude of the abnormal scores. We have previously found similar levels of the intra-observer variability for the wall motion and lower intra-observer variability for the thickening scoring (17). In that previous study, scoring was performed by one experienced observer and the percentage of normal studies was higher in that work. Others have found lower variability in a smaller study (18), but the user in that work was already aided by the quantitative system. This underlines the high subjectivity of the abnormal visual score assignment process and the need for the automation of this process, independent of the visual judgment. Due to the significant inter-observer variability, we have averaged scores from two observers for the comparison to the automated system. By kappa analysis, we have found that agreement between the averaged visual scores and automated system is higher than the agreement between the two observers.
To provide another validation standard, which is independent of visual scoring, we have utilized the angiographic information available in 630 cases. Post-stress regional wall motion abnormalities are significant predictors of coronary disease, as shown by exercise stress Tc-99m– gated SPECT MPI (2) and the association between wall motion and perfusion defects has been previously demonstrated (19). Severe disease has also been identified by visual analysis of wall motion abnormalities by consensus of two observers (20). We have compared the visual and automated methods with respect to detection of significant CAD. The ROC-AUC for CAD detection by the new automated T scoring was higher than the ROC-AUCs for one the observers and the previous method. Otherwise, it was not statistically different from the other observer or combined scores from both observers. The ROC-AUC for the average of two observers for M was slightly higher for M scoring than for the new automated system. It should be noted that the average reading of two experienced observers is not practical in clinical routine. In addition, when compared to individual observers, the automated system performed better or equivalent in CAD detection for M scoring. These findings illustrate the fact that independent observers perceive motion and thickening differently and apparently in a complementary fashion. When compared to the previous system, the ROC-AUCs were significantly higher due to the increased specificity of the new approach, and reduced false positive scores in cases with no disease. We have also found, as expected, that the automated average summed M and T score values were increasing with an increasing number of vessels involved. In addition, the results were not statistically different from the average of the two observers, or the previous system in the cases with disease.
The automated system demonstrated very high reproducibility (r ≥ 0.98) for both M and T scoring. Variability of the automated system occurs due to the subjectivity of contour placement in the minority of the cases and is significantly lower than variability of the visual scoring for both motion and thickening. This is primarily because the detection of the epi- and endo-cardial contours is highly reproducible (21). The 95% confidence limits are over 3–4 times lower for the automated method for the summed scores when compared with manual scoring (Figure 3). This is despite the fact that the number of cases identified as requiring manual adjustment was significantly different for the 2 technologists (78 vs. 161). Such high reproducibility is the primary advantage of the automated system as compared to the visual scoring.
The principal implication of this development is that the improved motion and thickening quantification system allows reliable, highly reproducible scoring, which equivalent to expert visual is scoring for the detection of regional wall motion and thickening abnormalities. Such automated scoring can be performed in a fraction of the time required for the visual scoring. The only manual step required is the visual contour check, which can be performed rapidly by an experienced technologist. This step is highly reproducible. Presumably, the visual contour check workload and overall reproducibility can be further reduced by the use of the quality control flag (22). In view of these results, the use of the automated scoring system can be recommended for clinical trials and routine clinical practice.
This work has several limitations. We have focused on the development and validation of improved M/T scores, and we compared this new development to the current practice (visual scoring). We did not evaluate the incremental value of the new scoring in addition to quantitative perfusion measurements. Further work could evaluate the combination of the improved automated motion and perfusion analysis for the optimal detection of CAD (23). We have not evaluated the use of the new fully automated scoring system in combination with expert observer scoring –it is conceivable that such a combination would result in enhanced accuracy in detection of CAD- similar to what we observed when the scores from 2 different observers were averaged. This, however, would require additional time-consuming reading sessions in which the user would be provided with the results of the new automated scoring system. In addition, our training dataset consisted of 8-bin data and slightly higher correlations were observed for 8-bin data than for 16-bin data. It is conceivable that separate LLk limits for 8-bin and 16-bin data could result in further improvement of this method for 16-bin datasets. We did not perform external direct validation by other modality of wall motion and thickening (e.g., echo (24), CT (25) or MRI (26); however, it would be unrealistic to obtain such data in a large population. Furthermore, these other modalities may also be affected by subjective reading, have their own limitations and the direct comparison may be compromised especially if two separate stress scans are performed. Therefore, we believe that the reference standard used here-segmental scoring by two experienced board certified observers and angiography results- realistically represent the best possible validation for this study. Only stress studies were considered in this analysis since the study population excluded patients with known CAD and infarcts. We have trained the data on the normal LLK cases obtained on the standard dual head SPECT camera with filtered backprojection, and considered the fact that normal ranges need to be correlated with normal EF which is highly variable. This assumption needs to be verified for the new high resolution SPECT cameras, for data reconstructed with new resolution-recovery techniques and for PET/CT data in further studies. Furthermore, we have used data from a single center only; however, algorithmic approach as opposed to visual training is unlikely produce significantly different results in population from other centers.
CONCLUSION
We demonstrated that improved fully automated scoring of MPS regional ventricular function is highly correlated with expert visual scoring, and can outperform an experienced observer in the detection of significant CAD by wall thickening. 17-segment visual motion and thickening scoring from MPS is associated with significant inter-observer variability, and we therefore recommend automated scoring of these features.
Acknowledgments
This research was supported in part by grant R0HL089765-01 from the National Heart, Lung, and Blood Institute/National Institutes of Health (NHLBI/NIH).
We would like to acknowledge Jim Gerlach and Mark Hyun for quality control of all the data. We would like to thank Arpine Oganyan for editing and proof-reading the text.
References
- 1.Slomka PJ, Nishina H, Berman DS, et al. Automated Quantification Of Myocardial Perfusion SPECT Using Simplified Normal Limits. J Nucl Cardiol. 2005;12(1):66–77. doi: 10.1016/j.nuclcard.2004.10.006. [DOI] [PubMed] [Google Scholar]
- 2.Emmett L, Iwanochko RM, Freeman MR, Barolet A, Lee DS, Husain M. Reversible regional wall motion abnormalities on exercise technetium-99m-gated cardiac single photon emission computed tomography predict high-grade angiographic stenoses. J Am Coll Cardiol. 2002 Mar 20;39(6):991–998. doi: 10.1016/s0735-1097(02)01707-2. [DOI] [PubMed] [Google Scholar]
- 3.Kapetanopoulos A, Ahlberg AW, Taub CC, Katten DM, Heller GV. Regional wall-motion abnormalities on post-stress electrocardiographic-gated technetium-99m sestamibi single-photon emission computed tomography imaging predict cardiac events. J Nucl Cardiol. 2007 Nov–Dec;14(6):810–817. doi: 10.1016/j.nuclcard.2007.07.014. [DOI] [PubMed] [Google Scholar]
- 4.Sharir T, Berman DS, Waechter PB, et al. Quantitative analysis of regional motion and thickening by gated myocardial perfusion SPECT: normal heterogeneity and criteria for abnormality. J Nucl Med. 2001;42(11):1630–1638. [PubMed] [Google Scholar]
- 5.Diamond GA, Forrester JS. Analysis of probability as an aid in the clinical diagnosis of coronary-artery disease. N Engl J Med. 1979 Jun 14;300(24):1350–1358. doi: 10.1056/NEJM197906143002402. [DOI] [PubMed] [Google Scholar]
- 6.Xu YA, Fish M, Gerlach J, et al. Combined quantitative analysis of attenuation corrected and non-corrected myocadial perfusion SPECT: Method development and clinical validation. J Nucl Cardiol. 2010 Aug;17(4):591–599. doi: 10.1007/s12350-010-9220-8. [DOI] [PMC free article] [PubMed] [Google Scholar]
- 7.Germano G, Kavanagh PB, Slomka PJ, Van Kriekinge SD, Pollard G, Berman DS. Quantitation in gated perfusion SPECT imaging: The Cedars-Sinai approach. J Nucl Cardiol. 2007;14(4):433–454. doi: 10.1016/j.nuclcard.2007.06.008. [DOI] [PubMed] [Google Scholar]
- 8.Germano G, Kiat H, Kavanagh PB, et al. Automatic quantification of ejection fraction from gated myocardial perfusion SPECT. J Nucl Med. 1995;36(11):2138–2147. [PubMed] [Google Scholar]
- 9.Germano G, Erel J, Lewin H, Kavanagh PB, Berman DS. Automatic quantitation of regional myocardial wall motion and thickening from gated technetium-99m sestamibi myocardial perfusion single-photon emission computed tomography. J Am Coll Cardiol. 1997;30(5):1360–1367. doi: 10.1016/s0735-1097(97)00276-3. [DOI] [PubMed] [Google Scholar]
- 10.Ford PV, Chatziioannou SN, Moore WH, Dhekne RD. Overestimation of the LVEF by quantitative gated SPECT in simulated left ventricles. J Nucl Med. 2001 Mar;42(3):454–459. [PubMed] [Google Scholar]
- 11.Greenbaum RA, Gibson DG. Regional non-uniformity of left ventricular wall movement in man. Br Heart J. 1981 Jan;45(1):29–34. doi: 10.1136/hrt.45.1.29. [DOI] [PMC free article] [PubMed] [Google Scholar]
- 12.Pandian NG, Skorton DJ, Collins SM, Falsetti HL, Burke ER, Kerber RE. Heterogeneity of left ventricular segmental wall thickening and excursion in 2-dimensional echocardiograms of normal human subjects. Am J Cardiol. 1983 Jun;51(10):1667–1673. doi: 10.1016/0002-9149(83)90207-2. [DOI] [PubMed] [Google Scholar]
- 13.Draper N, Smith H. Applied Regression Analysis. 3. John Wiley and Sons; 1998. [Google Scholar]
- 14.Sullivan M. Fundamentals of Statistics. 3. Pearson Prentice Hall; 2011. [Google Scholar]
- 15.Berman DS, Kiat H, Friedman JD, et al. Separate acquisition rest thallium-201/stress technetium-99m sestamibi dual-isotope myocardial perfusion single-photon emission computed tomography: a clinical validation study. J Am Coll Cardiol. 1993;22(5):1455–1464. doi: 10.1016/0735-1097(93)90557-h. [DOI] [PubMed] [Google Scholar]
- 16.Berman DS, Abidov A, Kang X, et al. Prognostic validation of a 17-segment score derived from a 20-segment score for myocardial perfusion SPECT interpretation. J Nucl Cardiol. 2004;11(4):414–423. doi: 10.1016/j.nuclcard.2004.03.033. [DOI] [PubMed] [Google Scholar]
- 17.Xu Y, Hayes S, Ali I, et al. Automatic and visual reproducibility of perfusion and function measures for myocardial perfusion SPECT. J Nucl Cardiol. 2010 Dec;17(6):1050–1057. doi: 10.1007/s12350-010-9297-0. [DOI] [PMC free article] [PubMed] [Google Scholar]
- 18.Adachi I, Morita K, Imran MB, et al. Heterogeneity of myocardial wall motion and thickening in the left ventricle evaluated with quantitative gated SPECT. J Nucl Cardiol. 2000 Jul–Aug;7(4):296–300. doi: 10.1067/mnc.2000.104958. [DOI] [PubMed] [Google Scholar]
- 19.Johnson LL, Verdesca SA, Aude WY, et al. Postischemic stunning can affect left ventricular ejection fraction and regional wall motion on post-stress gated sestamibi tomograms. J Am Coll Cardiol. 1997 Dec;30(7):1641–1648. doi: 10.1016/s0735-1097(97)00388-4. [DOI] [PubMed] [Google Scholar]
- 20.Sharir T, Bacher-Stier C, Dhar S, et al. Identification of severe and extensive coronary artery disease by postexercise regional wall motion abnormalities in Tc-99m sestamibi gated single-photon emission computed tomography. Am J Cardiol. 2000;86(11):1171–1175. doi: 10.1016/s0002-9149(00)01206-6. [DOI] [PubMed] [Google Scholar]
- 21.Paeng JC, Lee DS, Cheon GJ, Lee MM, Chung JK, Lee MC. Reproducibility of an automatic quantitation of regional myocardial wall motion and systolic thickening on gated 99mTc-sestamibi myocardial SPECT. J Nucl Med. 2001 May;42(5):695–700. [PubMed] [Google Scholar]
- 22.Xu Y, Kavanagh P, Fish M, et al. Automated quality control for segmentation of myocardial perfusion SPECT. J Nucl Med. 2009 Sep;50(9):1418–1426. doi: 10.2967/jnumed.108.061333. [DOI] [PMC free article] [PubMed] [Google Scholar]
- 23.Lima RS, Watson DD, Goode AR, et al. Incremental value of combined perfusion and function over perfusion alone by gated SPECT myocardial perfusion imaging for detection of severe three-vessel coronary artery disease. J Am Coll Cardiol. 2003 Jul 2;42(1):64–70. doi: 10.1016/s0735-1097(03)00562-x. [DOI] [PubMed] [Google Scholar]
- 24.Bacher-Stier C, Muller S, Pachinger O, et al. Thallium-201 gated single-photon emission tomography for the assessment of left ventricular ejection fraction and regional wall motion abnormalities in comparison with two-dimensional echocardiography. Eur J Nucl Med. 1999 Dec;26(12):1533–1540. doi: 10.1007/s002590050491. [DOI] [PubMed] [Google Scholar]
- 25.Bax JJ, Henneman MM, Schuijf JD, et al. Global and regional left ventricular function: a comparison between gated SPECT, 2D echocardiography and multi-slice computed tomography. Eur J Nucl Med Mol I. 2006 Dec;33(12):1452–1460. doi: 10.1007/s00259-006-0158-7. [DOI] [PubMed] [Google Scholar]
- 26.Anagnostopoulos C, Gunning MG, Pennell DJ, Laney R, Proukakis H, Underwood SR. Regional myocardial motion and thickening assessed at rest by ECG-gated 99mTc-MIBI emission tomography and by magnetic resonance imaging. Eur J Nucl Med. 1996 Aug;23(8):909–916. doi: 10.1007/BF01084364. [DOI] [PubMed] [Google Scholar]


