Background: MicroRNA-203 is down-regulated, and its exogenous expression inhibits cell growth in human melanoma cells.
Results: MicroRNA-203 induced senescence by cell cycle arrest through targeting E2F3.
Conclusion: MicroRNA-203 is a novel senescence-associated microRNA in melanoma cells.
Significance: This study has revealed the relationship between senescence and carcinogenesis in melanoma cells with respect to dysregulation of anti-oncogenic microRNA-203.
Keywords: E2F Transcription Factor, Melanoma, MicroRNA, Senescence, Tumor Suppressor Gene, MicroRNA-203, E2F3
Abstract
MicroRNAs regulate gene expression by repressing translation or directing sequence-specific degradation of their complementary mRNA. We recently reported that miR-203 is down-regulated, and its exogenous expression inhibits cell growth in canine oral malignant melanoma tissue specimens as well as in canine and human malignant melanoma cells. A microRNA target database predicted E2F3 and ZBP-89 as putative targets of microRNA-203 (miR-203). The expression levels of E2F3a, E2F3b, and ZBP-89 were markedly up-regulated in human malignant melanoma Mewo cells compared with those in human epidermal melanocytes. miR-203 significantly suppressed the luciferase activity of reporter plasmids containing the 3′-UTR sequence of either E2F3 or ZBP-89 complementary to miR-203. The ectopic expression of miR-203 in melanoma cells reduced the levels of E2F3a, E2F3b, and ZBP-89 protein expression. At the same time, miR-203 induced cell cycle arrest and senescence phenotypes, such as elevated expression of hypophosphorylated retinoblastoma and other markers for senescence. Silencing of E2F3, but not of ZBP-89, inhibited cell growth and induced cell cycle arrest and senescence. These results demonstrate a novel role for miR-203 as a tumor suppressor acting by inducing senescence in melanoma cells.
Introduction
Malignant melanoma is one of the most common skin cancers in humans (1). The incidence of malignant melanoma continues to rise more rapidly than that of all other malignancies except for lung cancer (2). Malignant melanoma is a spontaneous, highly aggressive neoplasm that can readily metastasize to other organs. In recent studies on malignant melanoma, both MAPK and PI3K/Akt signaling pathways have been a matter of focus, and their signalings are known to be constitutively activated through multiple mechanisms (3). BRAF (v-Raf murine sarcoma viral oncogene homolog B1) inhibitors, MEK inhibitors, and ipilimumab (an anti-CTLA-4 (cytotoxic T-lymphocyte antigen 4) monoclonal antibody) are promising new therapies for human malignant melanoma (4). However, safer and more effective therapies are to be desired.
MicroRNAs (miRNA or miR)2 have emerged recently as a large group of short (18–25 nucleotides), noncoding, small RNA molecules that negatively regulate gene expression (5–7). Over 1300 miRNAs are predicted to exist in humans (miRBase; available on the World Wide Web). Nevertheless, the latest study indicates that these previous estimates of conserved miRNAs might be inflated (8). Although the specific biological functions of most miRNAs remain largely unknown, these molecules are believed to constitute a large gene regulatory network that can modulate the expression of up to 30% of total cellular proteins. There is increasing experimental evidence supporting the role of miRNAs in the regulation of a range of physiological responses, including development (9), cellular apoptosis (10), differentiation (11), proliferation (12), and cancer (13).
The irreversible cell cycle arrest known as senescence can be induced by a number of factors, including telomere attrition, known as replicative senescence; oxidative stress; oncogene expression; and DNA damage signaling (14). Generally, senescence can be divided into two subsets (i.e. replicative senescence termed telomere-initiated senescence and senescence resulting from various stresses, which is known as stress-induced premature senescence) (14). Replicative senescence can be triggered by p53 and its transcriptional target p21Clip1 (p53/p21 pathway) and/or by the retinoblastoma (Rb) tumor suppressor and its main upstream inducer, the Cdk inhibitor p16INK4a (p16/Rb pathway). On the other hand, premature cellular senescence can be triggered by several harmful stimuli, such as a lack of optimal culture conditions, the exposure of supraphysiologic oxygen, or oncoproteins without an apparent loss of telomere function. Cells reaching senescence in culture, whether via replicative or premature senescence, can be identified by the presence of shorter telomeres and markers, such as senescence-associated β-galactosidase (SA-β-Gal) activity and DNA damage response proteins (14).
Several miRNAs have been shown to be involved in the regulation of pathways involved in cellular senescence, and they exert negative effects on cell cycle progression (14–16). The main senescence pathways associated with miRNAs are the p53/p21 and p16/Rb pathways (15). Especially, many studies have focused on the miR-34a/SIRT1/p53 interaction (17). Overexpression of sirtuin 1 (SIRT1), the mammalian homolog of Sir2, can delay cellular senescence and extend the cellular life span (18, 19). Therefore, down-regulation of SIRT1 leads to cellular senescence. Also, it has been suggested that ZBP-89, a Krüppel-type zinc finger transcription factor that binds to GC-rich sequences, induces senescence by inhibiting p16 expression in human lung cancer (20). Recently, it was reported that miR-205 in human melanoma cells induces senescence by targeting E2F1 (21). The E2F family of transcription factors controls cell cycle progression (16). E2F3 of the E2F family encodes two protein products (E2F3a and E2F3b) that are alternative splicing variants (22). E2F1, -2, and -3a facilitate cell cycle progression. On the contrary, E2F3b is classified as a repressor E2F, and it negatively controls the cell cycle (23). Recent studies reported that E2F1 to -3 are targets of several miRNAs, such as miR-34a (24). Therefore, senescence associated with miRNA/E2F interaction is also important.
Recently, we reported that miR-203 and -205 are down-regulated in human and canine melanoma cells and that the ectopic expression of miR-203 and -205 inhibits their cell growth (25). Here, we show that miR-203 induced senescence in human melanoma Mewo and A2058 cells and discuss the mechanism of senescence induced by ectopic miR-203 expression. Our data suggest anti-oncogenic miR-203 to be a newly recognized senescence-associated miRNA.
EXPERIMENTAL PROCEDURES
Cell Culture and Cell Viability
Human malignant melanoma cell lines Mewo and A2058 were purchased from the Health Science Research Resources Bank (Osaka, Japan), and the cells were maintained according to the manufacturer's protocol. The number of viable cells was determined by performing the trypan blue dye exclusion test. Normal human primary epidermal melanocytes (HEMs), which were purchased from ScienCell Research Laboratories (Carlsbad, CA), were cultured as recommended by the manufacturer.
Cell Transfection with miRNA or siRNA
Mewo or A2058 cells were seeded into 6-well plates at a concentration of 0.5 × 10⁵ cells/well the day before transfection. The mature type of miR-203 (Applied Biosystems, Foster City, CA) was used for the transfection of the cells, which was achieved by using cationic liposomes, Lipofectamine RNAiMAX (Invitrogen), at a concentration of 5, 10, or 20 nm, according to the manufacturer's Lipofection protocol. Short interfering RNA (siRNA) for both E2F3a and E2F3b or ZBP-89 (1, 5, or 10 nm) was also used for transfection of Mewo cells. The sequences of these siRNAs were 5′-UAACCUUUGAUUCUCUGAAUCCUCG-3′ (siR-E2F3; Invitrogen) and 5′-UUCACAAUGGAGCUGAAGUCACCUC-3′ (siR-ZBP-89; Invitrogen). The sequence of the nonspecific control miRNA used (Hokkaido System Science, Hokkaido, Japan) was 5′-GUAGGAGUAGUGAAAGGCC-3′.
Quantitative RT-PCR Using Real-time PCR
Total RNA was isolated from cells by the phenol/guanidium thiocyanate method with DNase I treatment. For determination of mRNA expression levels, total RNA was reverse transcribed with a PrimeScript® RT reagent kit (TaKaRa, Otsu, Japan). Real-time PCR was then performed with primers specific for E2F3 or ZBP-89 by using SYBR® Premix Ex TaqTM (TaKaRa). The sequences of the primers used in this study were as follows: E2F3-sense-1996, TGTGCAATCAGGTGTCTCTC; E2F3-antisense-2350, TTCATCCAGAAGGCTGTGGA; ZBP-89-sense-4129, CAGCTAGATGAGTGATCGGA; ZBP-89-antisense-4325, CCCAACGCATAACTCAAACC. The primer for E2F3 used in this study can amplify both E2F3a and E2F3b. GAPDH was used as an internal control. The relative expression level of mRNA was calculated by the ΔΔCt method.
Western Blotting
Total protein was extracted from whole cells by the procedure described previously (26). Protein contents were measured with a DC Protein Assay Kit (Bio-Rad). Ten micrograms of lysate protein for Western blotting was separated by SDS-PAGE using polyacrylamide gels and electroblotted onto a PVDF membrane (PerkinElmer Life Sciences). Details of the method used after blotting were described earlier (26). The antibodies used in this study were anti-human E2F3 rabbit polyclonal antibody (sc-878), which can detect both E2F3a and E2F3b (23), anti-human ZBP-89 mouse monoclonal antibody, anti-human E2F1 mouse monoclonal antibody, and anti-human PARP-1 mouse monoclonal antibody (Santa Cruz Biotechnology, Inc., Santa Cruz, CA); anti-human SIRT1 rabbit monoclonal antibody (Epitomics, Burlingame, CA); and anti-human IRS2 (insulin receptor substrate 2) rabbit polyclonal antibody, anti-human hyperphosphorylated Rb (Ser-795) rabbit polyclonal antibody, anti-human total Rb rabbit monoclonal antibody, anti-human c-MYC rabbit monoclonal antibody, anti-human phosphorylated p38 rabbit monoclonal antibody, anti-human p38 rabbit monoclonal antibody, anti-human phosphorylated ERK1/2 rabbit monoclonal antibody, anti-human ERK1/2 rabbit monoclonal antibody, anti-human phosphorylated Akt rabbit polyclonal antibody, and anti-human Akt rabbit polyclonal antibody (Cell Signaling Technology, Danvers, MA), all of which were properly diluted with TBS-T containing 2% bovine serum albumin and 0.01% sodium azide. The loading control was prepared by reincubating the same membrane with anti-human β-actin antibody (Sigma).
Staining for Senescence-associated β-Galactosidase
The cells were seeded into 6-well plates at a concentration of 0.5 × 10⁵ cells/well the day before transfection. After the transfection with miR-203, siR-E2F3 or siR-ZBP-89, Mewo cells were incubated for 120 h (for miR-203) or 96 h (for siR-E2F3 and siR-ZBP-89), and A2058 cells were incubated for 96 h after the transfection with miR-203. SA-β-Gal staining was performed by using the Senescence β-galactosidase staining kit (Cell Signaling Technology) according to the manufacturer's protocol.
Flow Cytometric Analysis
Mewo cells were seeded into 6-well plates at a concentration of 0.5 × 10⁵ cells/well the day before transfection. After the transfection with miR-203, siR-E2F3, or siR-ZBP-89, the cells were incubated for 96 h. For flow cytometric analysis (FACSCalibur, BD Biosciences), the cells were prepared by using the BD CycletestTM Plus-DNA reagent kit (BD Biosciences) according to manufacturer's protocol. The G0/G1 and G2/M ratios were calculated by using analysis software (CellQuest, BD Biosciences).
Assay for Luciferase Activity
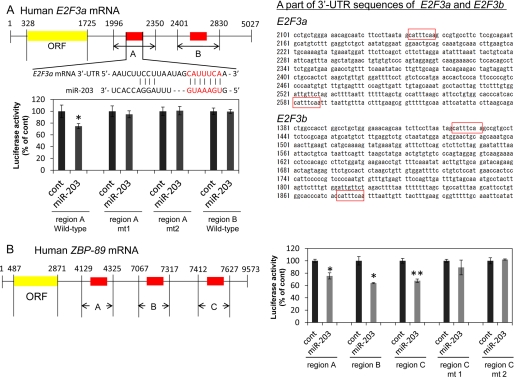
We constructed the sensor vector by joining the regions with a possible binding site from the 3′-UTR of human E2F3 or ZBP-89 to a luciferase reporter pMIR-control vector (Ambion, Foster City, CA) to examine the target sequence recognized by miR-203 (Fig. 3). Based on the NCBI database, the sequences of the 3′-UTR of human E2F3a and E2F3b are the same (Fig. 3). Also, to generate the sensor vectors with one or two mutations in the binding site for miR-203, we mutated seed regions from CATTTCA to CATGTCA (mt1) or CATGACA (mt2, for E2F3 3′-UTR) and from CATTTCA to CATTACA (mt1) or CATTAGA (mt2, for ZBP-89 3′-UTR; PrimeSTAR® mutagenesis basal kit, TaKaRa). The sensor vectors with mutations were submitted to the Life Science Research Center (Gifu University) for DNA sequencing. The cells were seeded in 12-well plates at a concentration of 0.5 × 10⁵ cells/well the day before the transfection. The sensor vector (concentration 0.5 μg/well) and 40 nm miR-203 or nonspecific control miRNA (Dharmacon, Tokyo, Japan) was used for the co-transfection of the cells by using cationic liposomes Lipofectamine RNAiMAX. Forty-eight hours after the co-transfection, luciferase activities were measured by using the Dual-GloTM luciferase assay system (Promega, Madison, WI) according to the manufacturer's protocol. Firefly luciferase activity was normalized to Renilla luciferase activity.
FIGURE 3.
Analysis of the target regions for miR-203 in E2F3 and ZBP-89 mRNAs. A, homology in the 3′-UTR of human E2F3 mRNA and mature miR-203. The region including miR-203 binding sites (red box) in E2F3a and E2F3b mRNAs completely matched (middle panel). B, regions of the 3′-UTR of human ZBP-89 mRNA complementary to mature miR-203. The red boxes indicate the predicted binding sites for miR-203. The bar graph shows luciferase activities after co-transfection with control or miR-203 and each of the sensor vectors having the indicated 3′-UTR of ZBP-89. *, p < 0.05; **, p < 0.01. A p value was determined for the difference in luciferase activity between the cells transfected with nonspecific control siRNA (Dharmacon) and those transfected with miR-203. Error bars, S.D.
Assay for E2F3a Overexpression
Eukaryote pIRES-E2F3a expression vector was generated by inserting the open reading frame of E2F3a cDNA into the ClaI/EcoRI site of the pIRES1 neo vector (Clontech). Mewo cells were seeded into 6-well plates at a concentration of 0.5 × 10⁵/well and transfected with 0.5 μg/well of pIRES1 neo as a control vector or pIRES-E2F3a expression vector by using Lipofectamine RNAiMAX at 2 days after the transfection with 20 nm miR-203. The effects manifested by E2F3 overexpression were assayed at 5 days after the transfection with plasmids.
Statistics
Each examination was performed in triplicate. The cell count analysis and the expression levels of mRNAs in the cells transfected with miR-203 and those transfected with nonspecific control miRNA were compared by using Student's t test. A p value less than 0.05 was considered to be statistically significant.
RESULTS
Ectopic Expression of miR-203 Induced Senescence in Mewo and A2058 Cells
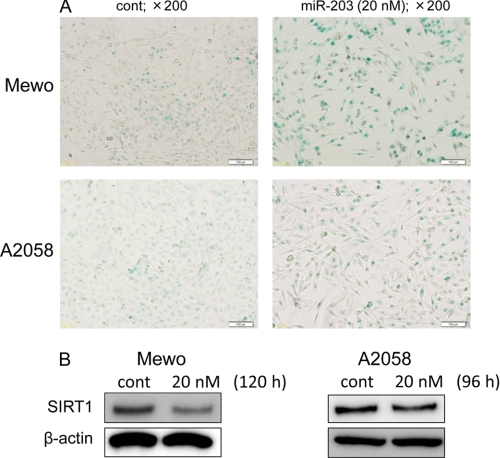
As shown in Fig. 1A, the number of cells positive for SA-β-Gal activity, indicating senescence, was markedly greater in Mewo and A2058 cells transfected with miR-203 than in those transfected with the control miRNA. Additionally, the expression level of SIRT1 was significantly decreased in Mewo cells and slightly decreased in A2058 cells by the ectopic expression of miR-203 compared with that of the control (Fig. 1B).
FIGURE 1.
A, photographs illustrating the effect of the ectopic expression of miR-203. Cells were evaluated for SA-β-Gal activity at 120 h (Mewo) or at 96 h (A2058) after the transfection with miR-203 at 20 nm (magnification, ×200). B, SIRT1 expression levels following the ectopic expression of miR-203 at the concentration of 20 nm. Total protein from the cells was obtained at 120 h (Mewo) or at 96 h (A2058) after the transfection. Error bars, S.D.
E2F3 and ZBP-89 Are Targets of miR-203
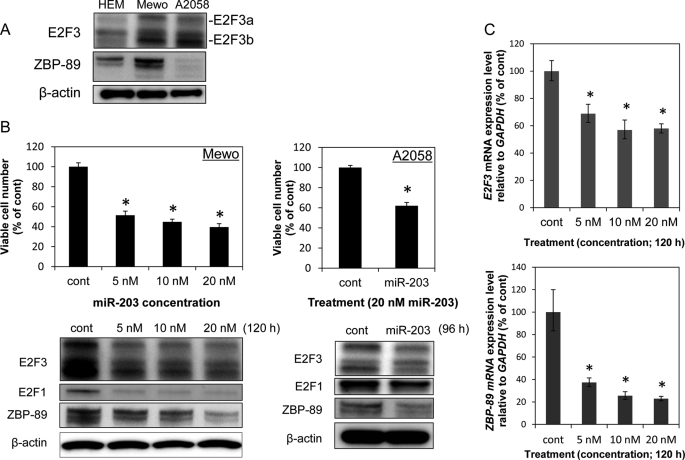
We hypothesized that the target involved in the senescence was E2F3 or ZBP-89 mRNA based on the database (TargetScan) results. Therefore, we examined the expression levels of E2F3a, E2F3b, and ZBP-89 in Mewo, A2058, and HEM cells. As a result, the expression levels of those proteins in Mewo cells were markedly up-regulated compared with those in HEM cells (Fig. 2A). The expression level of E2F3a and E2F3b in A2058 cells was also markedly up-regulated compared with that in HEM cells. On the other hand, the ZBP-89 expression level in A2058 cells was down-regulated compared with that in HEM cells. Furthermore, the ectopic expression of miR-203 in Mewo cells significantly and dose-dependently decreased the expression levels of E2F3a, E2F3b, and ZBP-89 proteins (Fig. 2B) and those of their mRNAs (Fig. 2C), as well as resulting in a significant decrease in the number of viable cells (Fig. 2B). Likewise, the expression levels of E2F3 and ZBP-89 proteins in A2058 cells were decreased by the transfection with miR-203 (Fig. 2B). And also, the cell growth of A2058 cells was suppressed by the treatment (Fig. 2B). Additionally, the expression level of E2F1 in Mewo and A2058 cells was also slightly decreased (Fig. 2B).
FIGURE 2.
A, comparison of E2F3a, E2F3b, and ZBP-89 expression levels between HEM and Mewo cells or A2058 cells. B, effects on cell viability and the expression levels of E2F3 and ZBP-89 by miR-203 introduced at a concentration of 5, 10, or 20 nm for Mewo cells and 20 nm for A2058 cells. Viable cell counting and protein extraction were performed at 120 h (Mewo) or at 96 h (A2058) after the transfection. C, effects of the transfection of Mewo cells with miR-203 at 5, 10, or 20 nm on the expression levels of E2F3 (top graph) and ZBP-89 (bottom graph) mRNAs in the cells, as assessed by using real-time PCR at 120 h post transfection. The expression levels of mRNAs were calculated by the ΔΔCt method and normalized to the level of GAPDH mRNA. *, p < 0.01. A p value was determined for the difference between the cells transfected with nonspecific control miRNA (HSS) and those transfected with various concentrations of miR-203. Error bars, S.D.
Next, we sought to confirm that E2F3 and ZBP-89 were target genes of miR-203 by using Mewo cells. There are two and three predicted binding sites for miR-203 in the 3′-UTR region of human E2F3 and ZBP-89 mRNA, respectively (Fig. 3, A and B). As expected, compared with those of the control, the luciferase activities of the wild-type pMIR-E2F3 region A and pMIR-ZBP-89 regions A, B, and C were significantly inhibited after the introduction of miR-203 into the Mewo cells (Fig. 3, A and B). However, the luciferase activity of the wild-type pMIR-E2F3 region B was not inhibited by the ectopic expression of miR-203 (Fig. 3A). Mutations of the E2F3 3′-UTR-binding site in region A and the ZBP-89 3′-UTR-binding site in region C abolished the ability of miR-203 to regulate luciferase expression (Fig. 3, A and B). These results demonstrate that E2F3 and ZBP-89 were potential targets of miR-203.
Down-regulation of E2F3, Not ZBP-89, Resulted in Senescence
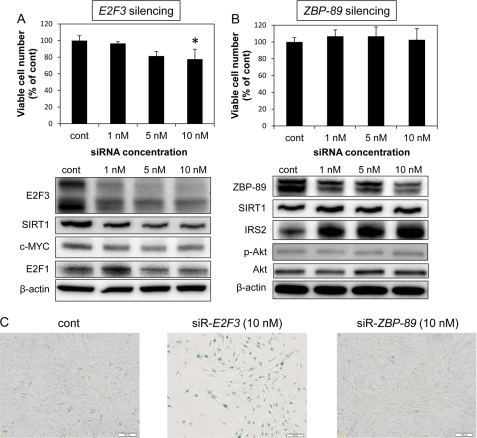
We examined the effects of siRNA-mediated E2F3 or ZBP-89 knockdown on cell viability and senescence to validate the role of E2F3 or ZBP-89 in Mewo cells. As shown in Fig. 4A, E2F3 silencing significantly inhibited cell growth in a dose-dependent manner. However, the effect of E2F3 silencing on the cell growth was smaller than that of miR-203 transfection. On the other hand, ZBP-89 silencing did not inhibit cell growth (Fig. 4B). Also, E2F3 silencing induced senescence, because SIRT1 expression was reduced and SA-β-Gal activity was markedly increased (Fig. 4, A and C, respectively). Furthermore, the expression levels of c-MYC and E2F1 were also decreased by E2F3 silencing. However, ZBP-89 silencing did not result in senescence, because the SIRT1 expression level was not decreased and the SA-β-Gal activity was not increased (Fig. 4, B and C). Additionally, the expression level of IRS2, which is an activator of insulin/IGF-1 signaling, and that of phospho-Akt were slightly up-regulated by ZBP-89 silencing (10 nm; Fig. 4B).
FIGURE 4.
A, bar graph shows the effects of transfection of Mewo cells with siR-E2F3 at a concentration of 1, 5, or 10 nm on cell growth. The bottom panels show the expression levels of E2F3 and the target genes of E2F3 after E2F3 silencing. *, p < 0.05. A p value was determined for the difference between the cells transfected with nonspecific control miRNA (HSS) and those transfected with siRNA at the indicated concentration. B, bar graph shows the effects of transfection of Mewo cells with siR-ZBP-89 at a concentration of 1, 5, or 10 nm on cell growth. The bottom panels show the expression levels of ZBP-89 and SIRT1, a marker of senescence. In A and B, viable cell counting and protein extraction were performed at 96 h after the transfection. C, photographs illustrating the effect of the ectopic expression of 10 nm siRNAs. Cells were evaluated for SA-β-Gal activity (magnification, ×200). Error bars, S.D.
Effect of miR-203 on Regulators of Cell Cycle and Cell Proliferation
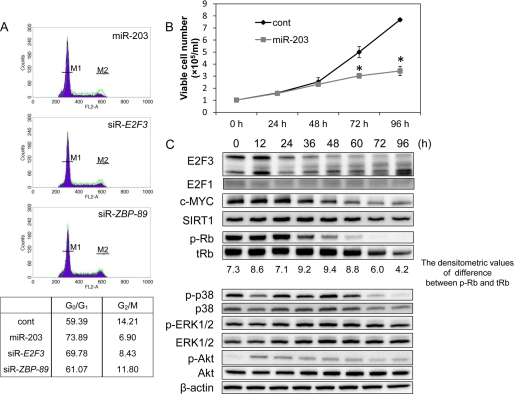
As shown in Fig. 5A, flow cytometric analysis revealed that the G0/G1 ratio was increased and the G2/M ratio was decreased by the induction of miR-203 or siR-E2F3 into the Mewo cells. These findings indicate that cell cycle arrest was induced by either of the RNAs. However, ZBP-89 silencing did not lead to cell cycle arrest.
FIGURE 5.
A, flow cytometric detection of G0/G1 and G2/M ratios of Mewo cells transfected with nonspecific control miRNA (HSS), miR-203, siR-E2F3, or siR-ZBP-89 at a concentration of 20 nm. The assay was performed at 96 h after the transfection. M1 and M2 on the histograms show the spike of G0/G1 and G2/M, respectively. The green line in the histograms indicates the control. The values in the lower table are shown as percentages of gated events. B, cell growth curve of Mewo cells transfected with nonspecific control miRNA (HSS) or miR-203 (20 nm). The number of viable cells was counted every 24 h. The transfection was done at 0 h. *, p < 0.01. The p value was determined for the difference between the cells transfected with nonspecific control miRNA and those transfected with miR-203. C, protein expression levels of E2F3 and its target genes (SIRT1 and c-MYC), senescence-associated genes (hyperphosphorylated Rb (p-Rb) and total Rb (tRb)), and cell proliferation associated genes (phosphorylated p38 (p-p38), p38, phospho-ERK1/2 (p-ERK1/2), and ERK1/2) in Mewo cells transfected with miR-203 (20 nm). Protein extraction was performed every 12 h after the transfection. Error bars, S.D.
The cell growth was significantly inhibited at 72 h after the transfection with miR-203 (Fig. 5B). Consistent with the results of the flow cytometric analysis and cell growth inhibition, the expression levels of cell cycle regulators, such as E2F3 and c-MYC, which interact with each other, were down-regulated starting at 36 h after the transfection with miR-203 and gradually decreased more after that (Fig. 5C). Inversely, the expression level of hypophosphorylated Rb, which was expressed as the difference between hyperphosphorylated Rb and total Rb, was increased at 36 and 48 h after the transfection. On the other hand, the expression levels of SIRT1 and phospho-p38 were significantly reduced at 72 h. However, phospho-ERK1/2 expression remained almost unchanged. Although the phospho-Akt expression level was up-regulated at 12 h, it gradually decreased thereafter.
E2F3a Overexpression Rescued Cells from Senescence Induced by miR-203
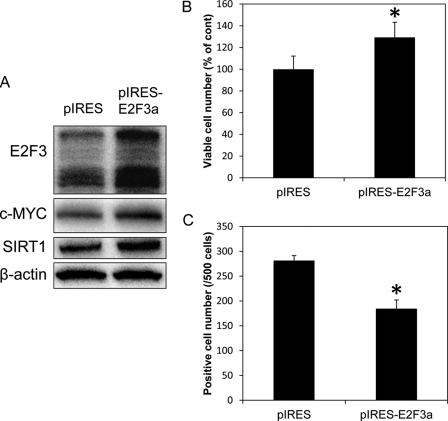
Overexpression of E2F3a in Mewo cells transfected with miR-203 resulted in up-regulation of c-MYC and SIRT1, significantly increased the number of viable cells, and significantly decreased the number of SA-β-Gal-positive cells (Fig. 6, A–C).
FIGURE 6.
A, expression levels of E2F3, c-MYC, and SIRT1 after introducing pIRES-E2F3a vector or pIRES1 neo control vector into Mewo cells. B, number of viable cells among miR-203-transfected Mewo cells incubated with pIRES1 neo control vector or pIRES-E2F3a vector. C, number of cells positive for SA-β-Gal staining after the introduction of pIRES1 neo control or pIRES-E2F3a vector into Mewo cells. pIRES indicates pIRES1 neo control vector. *, p < 0.05. The p value was determined for the difference between the cells transfected with the pIRES1 neo control vector and those transfected with the pIRES-E2F3a vector. Error bars, S.D.
DISCUSSION
This study demonstrated that the ectopic expression of miR-203, which functions as anti-oncomir in human and canine malignant melanoma cells (25), induced cellular senescence by targeting E2F3 in human melanoma Mewo and A2058 cells. Also, miR-203 affected MAPK p38 and PI3K/Akt. A previous study of ours showed that miR-205 as well as miR-203 is down-regulated in human and canine malignant melanoma cells (25). Chromosome region 1q32.2, in which the miR-205 gene is located, is often deleted in melanomas (27). On the other hand, the miR-203 gene is found in chromosome region 14q32.33 (miRBase), and the deletion of this region in melanoma cells has not been reported to our knowledge.
First, we focused on E2F3 and ZBP-89 as target genes of miR-203 involved in the senescence mechanism, as suggested by the database (TargetScan). We verified that, as expected, both genes were targets of miR-203 based on the results of the luciferase activity assay. We considered that miR-203 targeted both E2F3a and E2F3b, because their protein expression levels were decreased by the ectopic expression of miR-203 and the predicted miR-203 binding sites were present in both E2F3a and E2F3b 3′-UTRs. As a result, the key regulator in cellular senescence elicited by the ectopic expression of miR-203 was E2F3, not ZBP-89 (Fig. 4). E2F3a overexpression in Mewo cells rescued them from the cell cycle arrest and cellular senescence caused by miR-203. When the E2F3a expression vector was introduced into cells, both E2F3a and E2F3b proteins were unexpectedly overexpressed. Although the reason for this finding is not yet clear, our data indicate that acceleration of the cell cycle by E2F3a was superior to suppression of it by E2F3b in Mewo cells.
E2F1–3a play a central role in the control of cell cycle progression by regulating the timely expression of genes required for DNA synthesis and mitosis at the G1/S phase boundary (16). Many proteins crucial for cell cycle progression are E2F targets, such as cyclin A, cyclin E, c-MYC, SIRT1, and Rb (28–31). In this study, the expression levels of SIRT1 and c-MYC also were decreased by the ectopic expression of miR-203 or E2F3 silencing. These findings suggest that SIRT1 and c-MYC were targets of E2F3, as shown in previous studies (31, 32). Furthermore, the E2F1 expression level was decreased by the introduction of miR-203 into Mewo or A2058 cells. This finding indicates that c-MYC regulates E2F1 expression, as reported earlier by O'Donell et al. (33), because E2F1 is not a direct target gene of miR-203, and E2F3 silencing also decreased E2F1 expression (Fig. 4A). Our data suggest that the down-regulation of E2F3 by miR-203 resulted in cell cycle arrest. On the other hand, our data indicate that the suppressive effect of miR-203 on cell growth resulted from the down-regulation of c-MYC expression, because the E2F3 silencing showed a smaller inhibitory effect on cell growth than ectopic miR-203 expression, and the effect on cell growth of c-MYC silencing in our previous study was almost as much as that of ectopic miR-203 expression in this study (34). Unfortunately, E2F3a- or E2F3b-specific siRNA could not be generated, because siRNA for specific sequences of each gene had off-target effects. We could not clarify whether the senescence resulted from the cell cycle arrest or the down-regulation of SIRT1. To resolve this question, we must examine the expression level of acetylated p53 in Mewo cells, which have mutant p53 (35), when the cells are transfected with miR-203. The level of induction of senescence in A2058 cells by miR-203 was smaller than that in Mewo cells. This finding may be associated with the smaller suppressive effect of miR-203 on E2F3 expression in A2058 cells than that in Mewo cells (Fig. 2B) and the lack of Rb protein in A2058 cells (supplemental Fig. 1).
Although there is a relationship between cell cycle arrest and apoptosis, apoptotic cell death was neither biochemically nor morphologically observed in Mewo or A2058 cells transfected with miR-203 (supplemental Fig. 1).
It has been reported that ZBP-89 forms a complex with histone deacetylase 3 (HDAC3) and that this complex induces senescence by inhibiting p16 expression (36). We consider the reason why ZBP-89 silencing failed to induce senescence to be the lack of p16 protein in the Mewo cells (data not shown). ZBP-89 expression is reportedly elevated in some tumor tissues and cell lines, and ZBP-89 plays a role at the early stage of gastric cancer development (36). However, it has also been reported that ZBP-89 arrests cell proliferation through its interactions with p53 and p21 and initiates apoptosis (36). These findings suggest that the ZBP-89 gene functions as both an oncogene and anti-oncogene. Additionally, ZBP-89 binds to the neuronal IRS2 promoter and inhibits the activation of IRS2 (37). Our data showed that the introduction of siR-ZBP-89 into Mewo cells enhanced their IRS2 and phospho-Akt expression levels. This finding indicates that ZBP-89 silencing in Mewo cells activated insulin/IGF-1 signaling, resulting in enhanced cell proliferation and cell survival. Therefore, ZBP-89 in Mewo cells possibly functions as a tumor suppressor.
In conclusion, miR-203 was shown to be a novel tumor suppressor in human melanoma cells. The present demonstration of previously uncharacterized biological functions of miR-203, with the ability to control cell proliferation and to induce senescence in melanoma cells, points to its significance as a unique type of tumor suppressor in melanoma cells.
Supplementary Material

This article contains supplemental Fig. 1.
- miRNA or miR
- microRNA
- Rb
- retinoblastoma
- SA-β-Gal
- senescence-associated β-galactosidase
- HEM
- human primary epidermal melanocyte.
REFERENCES
- 1. Miller A. J., Mihm M. C., Jr. (2006) Melanoma. N. Engl. J. Med. 355, 51–65 [DOI] [PubMed] [Google Scholar]
- 2. Pacheco I., Buzea C., Tron V. (2011) Towards new therapeutic approaches for malignant melanoma. Expert Rev. Mol. Med. 13, e33. [DOI] [PubMed] [Google Scholar]
- 3. Russo A. E., Torrisi E., Bevelacqua Y., Perrotta R., Libra M., McCubrey J. A., Spandidos D. A., Stivala F., Malaponte G. (2009) Melanoma. Molecular pathogenesis and emerging target therapies (Review). Int. J. Oncol. 34, 1481–1489 [DOI] [PubMed] [Google Scholar]
- 4. Eggermont A. M., Robert C. (2011) New drugs in melanoma: it's a whole new world. Eur. J. Cancer 104, 397–404 [DOI] [PubMed] [Google Scholar]
- 5. Sun B. S., Dong Q. Z., Ye Q. H., Sun H. J., Jia H. L., Zhu X. Q., Liu D. Y., Chen J., Xue Q., Zhou H. J., Ren N., Qin L. X. (2008) Lentiviral-mediated miRNA against osteopontin suppresses tumor growth and metastasis of human hepatocellular carcinoma. Hepatology. 48, 1834–1842 [DOI] [PubMed] [Google Scholar]
- 6. Cannell I. G., Kong Y. W., Bushell M. (2008) How do microRNAs regulate gene expression? Biochem. Soc. Trans. 36, 1224–1231 [DOI] [PubMed] [Google Scholar]
- 7. Bartel D. P. (2009) MicroRNAs. Target recognition and regulatory functions. Cell 136, 215–233 [DOI] [PMC free article] [PubMed] [Google Scholar]
- 8. Chiang H. R., Schoenfeld L. W., Ruby J. G., Auyeung V. C., Spies N., Baek D., Johnston W. K., Russ C., Luo S., Babiarz J. E., Blelloch R., Schroth G. P., Nusbaum C., Bartel D. P. (2010) Mammalian microRNAs. Experimental evaluation of novel and previously annotated genes. Genes Dev. 24, 992–1009 [DOI] [PMC free article] [PubMed] [Google Scholar]
- 9. Harfe B. D. (2005) MicroRNAs in vertebrate development. Curr. Opin. Genet. Dev. 15, 410–415 [DOI] [PubMed] [Google Scholar]
- 10. Lynam-Lennon N., Maher S. G., Reynolds J. V. (2009) The roles of microRNA in cancer and apoptosis. Biol. Rev. Camb. Philos. Soc. 84, 55–71 [DOI] [PubMed] [Google Scholar]
- 11. Zhang J., Jima D. D., Jacobs C., Fischer R., Gottwein E., Huang G., Lugar P. L., Lagoo A. S., Rizzieri D. A., Friedman D. R., Weinberg J. B., Lipsky P. E., Dave S. S. (2009) Patterns of microRNA expression characterize stages of human B-cell differentiation. Blood. 113, 4586–4594 [DOI] [PMC free article] [PubMed] [Google Scholar]
- 12. Kaddar T., Rouault J. P., Chien W. W., Chebel A., Gadoux M., Salles G., Ffrench M., Magaud J. P. (2009) Two new miR-16 targets. Caprin-1 and HMGA1, proteins implicated in cell proliferation. Biol. Cell 101, 511–524 [DOI] [PubMed] [Google Scholar]
- 13. Uziel T., Karginov F. V., Xie S., Parker J. S., Wang Y. D., Gajjar A., He L., Ellison D., Gilbertson R. J., Hannon G., Roussel M. F. (2009) The miR-17∼92 cluster collaborates with the Sonic Hedgehog pathway in medulloblastoma. Proc. Natl. Acad. Sci. U.S.A. 106, 2812–2817 [DOI] [PMC free article] [PubMed] [Google Scholar]
- 14. Gorospe M., Abdelmohsen K. (2011) MicroRegulators come of age in senescence. Trends Genet. 27, 233–241 [DOI] [PMC free article] [PubMed] [Google Scholar]
- 15. Liu F. J., Wen T., Liu L. (2012) MicroRNAs as a novel cellular senescence regulator. Ageing Res. Rev. 11, 41–50 [DOI] [PubMed] [Google Scholar]
- 16. Bueno M. J., Malumbres M. (2011) MicroRNAs and the cell cycle. Biochim. Biophys. Acta 1812, 592–601 [DOI] [PubMed] [Google Scholar]
- 17. Yamakuchi M., Lowenstein C. J. (2009) MiR-34, SIRT1 and p53. The feedback loop. Cell Cycle 8, 712–715 [DOI] [PubMed] [Google Scholar]
- 18. Haigis M. C., Guarente L. P. (2006) Mammalian sirtuins. Emerging roles in physiology, aging, and calorie restriction. Genes Dev. 20, 2913–2921 [DOI] [PubMed] [Google Scholar]
- 19. Chua K. F., Mostoslavsky R., Lombard D. B., Pang W. W., Saito S., Franco S., Kaushal D., Cheng H. L., Fischer M. R., Stokes N., Murphy M. M., Appella E., Alt F. W. (2005) Mammalian SIRT1 limits replicative life span in response to chronic genotoxic stress. Cell Metab. 2, 67–76 [DOI] [PubMed] [Google Scholar]
- 20. Feng Y., Wang X., Xu L., Pan H., Zhu S., Liang Q., Huang B., Lu J. (2009) The transcription factor ZBP-89 suppresses p16 expression through a histone modification mechanism to affect cell senescence. FEBS J. 276, 4197–4206 [DOI] [PubMed] [Google Scholar]
- 21. Dar A. A., Majid S., de Semir D., Nosrati M., Bezrookove V., Kashani-Sabet M. (2011) miRNA-205 suppresses melanoma cell proliferation and induces senescence via regulation of E2F1 protein. J. Biol. Chem. 286, 16606–16614 [DOI] [PMC free article] [PubMed] [Google Scholar]
- 22. Leone G., Nuckolls F., Ishida S., Adams M., Sears R., Jakoi L., Miron A., Nevins J. R. (2000) Identification of a novel E2F3 product suggests a mechanism for determining specificity of repression by Rb proteins. Mol. Cell Biol. 20, 3626–3632 [DOI] [PMC free article] [PubMed] [Google Scholar]
- 23. Hurst C. D., Tomlinson D. C., Williams S. V., Platt F. M., Knowles M. A. (2008) Inactivation of the Rb pathway and overexpression of both isoforms of E2F3 are obligate events in bladder tumors with 6p22 amplification. Oncogene 27, 2716–2727 [DOI] [PMC free article] [PubMed] [Google Scholar]
- 24. Tazawa H., Tsuchiya N., Izumiya M., Nakagama H. (2007) Tumor-suppressive miR-34a induces senescence-like growth arrest through modulation of the E2F pathway in human colon cancer cells. Proc. Natl. Acad. Sci. U.S.A. 104, 15472–15477 [DOI] [PMC free article] [PubMed] [Google Scholar]
- 25. Noguchi S., Mori T., Hoshino Y., Yamada N., Maruo K., Akao Y. (2012) MicroRNAs as tumour suppressors in canine and human melanoma cells and as a prognostic factor in canine melanomas. Vet. Comp. Oncol., in press [DOI] [PubMed] [Google Scholar]
- 26. Noguchi S., Mori T., Hoshino Y., Maruo K., Yamada N., Kitade Y., Naoe T., Akao Y. (2011) MicroRNA-143 functions as a tumor suppressor in human bladder cancer T24 cells. Cancer Lett. 307, 211–220 [DOI] [PubMed] [Google Scholar]
- 27. Smedley D., Sidhar S., Birdsall S., Bennett D., Herlyn M., Cooper C., Shipley J. (2000) Characterization of chromosome 1 abnormalities in malignant melanomas. Genes Chromosomes Cancer 28, 121–125 [DOI] [PubMed] [Google Scholar]
- 28. Macleod K. (1999) pRb and E2f-1 in mouse development and tumorigenesis. Curr. Opin. Genet. Dev. 9, 31–39 [DOI] [PubMed] [Google Scholar]
- 29. Helin K. (1998) Regulation of cell proliferation by the E2F transcription factors. Curr. Opin. Genet. Dev. 8, 28–35 [DOI] [PubMed] [Google Scholar]
- 30. Dyson N. (1998) The regulation of E2F by pRB Family proteins. Genes Dev. 12, 2245–2262 [DOI] [PubMed] [Google Scholar]
- 31. Chen D., Pacal M., Wenzel P., Knoepfler P. S., Leone G., Bremner R. (2009) Division and apoptosis of E2f-deficient retinal progenitors. Nature 462, 925–929 [DOI] [PMC free article] [PubMed] [Google Scholar]
- 32. Chen H. Z., Tsai S. Y., Leone G. (2009) Emerging roles of E2Fs in cancer. An exit from cell cycle control. Nat. Rev. Cancer. 9, 785–797 [DOI] [PMC free article] [PubMed] [Google Scholar]
- 33. O'Donnell K. A., Wentzel E. A., Zeller K. I., Dang C. V., Mendell J. T. (2005) c-Myc-regulated microRNAs modulate E2F1 expression. Nature 435, 839–843 [DOI] [PubMed] [Google Scholar]
- 34. Noguchi S., Mori T., Hoshino Y., Yamada N., Nakagawa T., Sasaki N., Akao Y., Maruo K. (2012) Comparative study of anti-oncogenic microRNA-145 in canine and human malignant melanoma. J. Vet. Med. Sci. 74, 1–8 [DOI] [PubMed] [Google Scholar]
- 35. Ho C. K., Li G. (2005) Mutant p53 melanoma cell lines respond differently to CP-31398-induced apoptosis. Br. J. Dermatol. 153, 900–910 [DOI] [PubMed] [Google Scholar]
- 36. Zhang C. Z., Chen G. G., Lai P. B. (2010) Transcription factor ZBP-89 in cancer growth and apoptosis. Biochim. Biophys. Acta 1806, 36–41 [DOI] [PubMed] [Google Scholar]
- 37. Udelhoven M., Pasieka M., Leeser U., Krone W., Schubert M. (2010) Neuronal insulin receptor substrate 2 (IRS2) expression is regulated by ZBP89 and SP1 binding to the IRS2 promoter. J. Endocrinol. 204, 199–208 [DOI] [PubMed] [Google Scholar]
Associated Data
This section collects any data citations, data availability statements, or supplementary materials included in this article.


