Background: Aquaporin 4 has been implicated in fluid homeostasis and imbalance during cerebral ischemia. The M1 isoform of AQP4 is found to be highly expressed in cerebral ischemia.
Results: AQP4 M1 transcript is observed to be highly modulated by miR-130a during brain edema.
Conclusion: miR-130a is a transcriptional repressor of AQP4 M1 promoter.
Significance: miR-130a could be useful in regulating AQP4 expression in brain ischemia.
Keywords: Aquaporin, Gene Regulation, Gene Transcription, Microarray, MicroRNA
Abstract
Aquaporins (AQPs) are transmembrane water channels ubiquitously expressed in mammalian tissues. They play prominent roles in maintaining cellular fluid balance. Although expression of AQP1, -3, -4, -5, -8, -9, and -11 has been reported in the central nervous system, it is AQP4 that is predominately expressed. Its importance in fluid regulation in cerebral edema conditions has been highlighted in several studies, and we have also shown that translational regulation of AQP4 by miR-320a could prove to be useful in infarct volume reduction in middle cerebral artery occluded rat brain. There is evidence for the existence of two AQP4 transcripts (M1 and M23) in the brain arising from two alternative promoters. Because the AQP4 M1 isoform exhibits greater water permeability, in this study, we explored the possibility of microRNA-based transcriptional regulation of the AQP4 M1 promoter. Using RegRNA software, we identified 34 microRNAs predicted to target the AQP4 M1 promoter region. MicroRNA profiling, quantitative stem-loop PCR, and luciferase reporter assays revealed that miR-130a, -152, -668, -939, and -1280, which were highly expressed in astrocytes, could regulate the promoter activity. Of these, miR-130a was identified as a strong transcriptional repressor of the AQP4 M1 isoform. In vivo studies revealed that LNATM anti-miR-130a could up-regulate the AQP4 M1 transcript and its protein to bring about a reduction in cerebral infarct and promote recovery.
Introduction
MicroRNAs (miRNAs)2 are small non-coding RNAs capable of regulating gene expression. Translational silencing is achieved when the miRNA interacts with the 3′-UTR of its target gene and prevents protein synthesis from the transcript (1, 2). We had reported previously that miR-320a can repress the translation of aquaporin 4 (AQP4) mRNA by interacting with its 3′-UTR (3). AQP4 belongs to a class of transmembrane channel proteins that are mainly involved in the bidirectional flux of water molecules across cellular membranes. Expression of AQP4 is found predominantly in the central nervous system, especially in the brain (4, 5). Its localization patterns in various cellular components of the brain such as the glial membranes, the subarachnoidal space, osmosensory areas, ventricles, and the blood capillaries suggest its importance in regulating fluid balance in the central nervous system (4, 5).
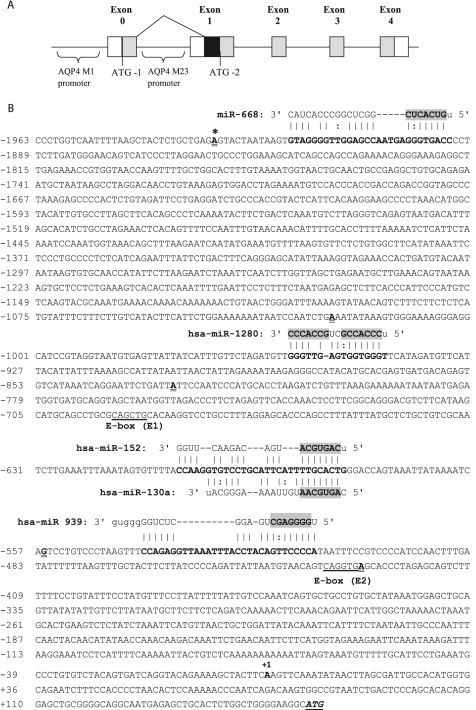
Incidentally, two AQP4 transcripts, M1 and M23, transcribed from two alternative promoters have been reported in human brain (4). Transcription of AQP4 M1 is thought to be controlled by the promoter located upstream of exon 0 of the AQP4 gene, whereas transcription of the shorter transcript, AQP4 M23, is controlled by the promoter located upstream of exon 1 (Fig. 1A). Hereafter we will refer to the promoters located at exon 0 and exon 1 as the M1 promoter and M23 promoter, respectively. Water permeability studies showed that the M1 isoform conducts water at a higher rate than the M23 isoform (4, 6). Quantitative immunoblotting and immunofluorescence studies showed that expression of AQP4 M1 was 8-fold higher than expression of M23 (7). On the contrary, Hirt et al. (8) observed higher expression of M23 mRNA levels in mouse brain. However, under ischemic conditions, the expression of the AQP4 M1 isoform predominated. Expression of AQP4 M1 transcript and protein were reported to increase further in ischemic brain (8). It is possible that the expression of the M1 isoform is triggered due to its increased water permeability characteristics as ischemia often leads to drastic changes in the cerebral water content.
FIGURE 1.
AQP4 gene organization adapted from Umenishi and Verkman (21). A, exons (0–4) are represented as boxes (not drawn to scale). Untranslated regions are shown as white boxes. Coding regions are shaded gray. A black box represents the sequence that additionally codes for the long AQP4 M1 transcript in exon 1. B, predicted binding of miRNAs to promoter region of AQP4 M1.The figure contains the promoter sequence of AQP4 M1 until the start codon (underlined italics). The first nucleotide of the AQP4 M1 promoter is marked with an asterisk. The transcription initiation site is marked with +1. Potential binding regions of five of the highly expressed miRNAs in human astrocytes are shown (bold). The seed regions are shaded. The first nucleotides of the deletion constructs are shown in bold and double underlined. The E box regions (E1 and E2) identified by Umenishi and Verkman (21) are also shown (underlined).
We have also observed that targeting the 3′-UTR of AQP4 (as well as AQP1) with miR-320a can result in changes in the infarct volume in the ischemic brain (3). However, as a translational regulator, miR-320a does not differentiate between the two isoforms. Although miRNAs are known to mediate translational silencing in the cytoplasm, recent evidence suggests that some miRNAs may also regulate gene expression at the transcriptional level (9–12). Several studies have identified miRNA recognition sites in gene promoters proximal to known transcription initiation sites and have shown the ability of miRNAs to regulate the transcription of the target gene (9–12). Given the importance of the AQP4 M1 isoform in cerebral edema/ischemia pathology, we explored the possibility of identifying miRNAs that could selectively modulate its promoter.
EXPERIMENTAL PROCEDURES
Culturing of Cells
Astrocytoma (CRL1718) and HeLa (CCL2) cells were obtained from the American Type Culture Collection (ATCC). Astrocytoma cells were cultured in RPMI 1640 medium, and the HeLa cell line was cultured in Dulbecco's modified Eagle's medium (DMEM) (Invitrogen). The medium was supplemented with 10% fetal bovine serum, 50 units of penicillin, and 50 μg/ml streptomycin. All cells were cultured in T-75 flasks and maintained in a 37 °C incubator with 5% CO2.
DNA/RNA Extraction
Genomic DNA was extracted from astrocytoma cells and used for cloning of the AQP4 promoter regions. Briefly, the cells were lysed using 1.0 ml of DNAzol® Reagent (Invitrogen), and the genomic DNA was extracted and precipitated according to the manufacturer's protocol. Total RNA (including miRNA) was extracted from cells by a single step method using TRIzol (Invitrogen) according to the manufacturer's protocol. The total RNA was utilized for further experimental techniques such as amplification of the AQP4 CDS, quantitative real time PCR, and miRNA array. The concentration and integrity of the nucleic acids were determined using Nanodrop ND-1000 spectrophotometry (Nanodrop Tech, Rockland, DE) and DNA/RNA gel electrophoresis.
Transfection of miRNAs
Transfection procedures of miRNAs were adapted from Cheng et al. (13) with slight modifications. Human anti- or pre-miRNAs (miR-130a, -152, -668, -939, and -1280) at a 30 nm final concentration (in 50 μl of Opti-MEM) were complexed with 1 μl of NeoFx in 50 μl of Opti-MEM (Ambion, Inc.). Astrocytoma (CRL1718)/HeLa (HTB-47) cells were transfected with these complexes and maintained for 48 h prior to subsequent experiments.
Reverse Transcription and Quantitative Real Time PCR
Reverse transcription followed by real time quantitative PCR (qRT-PCR) were carried out according to Jeyaseelan et al. (14). Quantitation of AQP4 mRNAs was performed using a SYBR Green assay. Specific primer sequences were designed using PrimerExpress software (Applied Biosystems): AQP4 M1 forward primer, 5′-atgagagctgcactctggct-3′; AQP4 M1 reverse primer, 5′-tgtgggtctgtcactcatg-3′; AQP4 forward primer, 5′-agcctgggatgcaccatca-3′; and AQP4 reverse primer, 5′-tgcaatgctgagtccaaagc-3′. For miRNA detection, reverse transcription followed by stem-loop qRT-PCRs was performed according to the manufacturer's protocols using miRNA-specific primers (Applied Biosystems). All the real time PCR experiments were carried out using an Applied Biosystems 7900 sequence detection system.
Generation of Plasmid Constructs
The entire promoter region was amplified using gene-specific primers (supplemental Table S1), cloned into pCR4-TOPO vectors (Invitrogen), and sequenced for verification. The verified sequences were then subcloned into the luciferase vector (pGL4, Promega, Madison, WI) for promoter activity studies. Deletion and mutation constructs were then generated using the whole promoter construct as the template. These constructs were used for luciferase assays. For immunocytochemistry studies, the luciferase gene in the promoter construct was excised (NcoI/XbaI) and replaced with the AQP4 CDS. These AQP4 promoter/CDS constructs were then co-transfected with the respective anti- or pre-miRNAs.
Immunocytochemistry
Immunocytochemistry was performed on astrocytoma cell cultures treated with the respective anti- or pre-miRNAs. Briefly, astrocytes co-transfected with pGL4 plasmids containing AQP4 (promoter/CDS) constructs and anti- or pre-miRNAs were fixed with 4% formaldehyde in phosphate-buffered saline for 20 min, permeabilized with 0.1% Triton X-100 in PBS for 30 min, and blocked with 5% FBS in PBS for 30 min. AQP4 (Santa Cruz Biotechnology) was probed according to the procedure adapted from Satoh et al. (15) using affinity-purified rabbit polyclonal anti-AQP4 (Santa Cruz Biotechnology) antibodies. A FITC-coupled goat anti-rabbit secondary antibody was used at dilutions of 1:200 (Bio-Rad). DAPI was used as a nuclear stain. Images were viewed (63× magnification) and analyzed using LSM510 confocal imaging software (Carl Zeiss MicroImaging Inc.).
SDS-PAGE and Western Blot Analysis
Forty micrograms of total protein was resolved by 12% Tris-Tricine SDS-PAGE, and Western blotting was carried out as described by Satoh et al. (15). Membranes were probed with primary antibodies (rabbit anti-AQP4, Santa Cruz Biotechnology) at a concentration of 1 μg/ml in 0.5% blocking solution. β-Actin was used as a loading control (Bio-Rad). Secondary antibodies (horseradish peroxidase-conjugated goat anti-rabbit, Bio-Rad) were used at a dilution of 1:10,000 in 0.5% blocking solution. The immunoprobed membranes were visualized via enhanced chemiluminescence (SuperSignal West, Thermo Scientific) with variable exposure times (Eastman Kodak Co. MS film). Films of Western blots were scanned (Acer SWZ3300U), and the signal intensities of the bands were quantitated using ImageJ software (National Institutes of Health).
Luciferase Reporter Assays
For luciferase reporter assays, the anti- or pre-miRNAs were transfected along with their respective plasmid constructs containing the miRNA recognition site. The plasmid transfection procedure was adapted from Cheng et al. (13) with slight modifications. Preseeded astrocytoma/HeLa cells (7 × 10⁴) were transfected with 50 nm anti- or pre-miRNAs for 3 h followed by pGL4 plasmid constructs (200 ng/well) for another 3 h. The miRNAs and plasmids were complexed with Lipofectamine 2000 (Invitrogen) and incubated for 20 min before addition to the cells. The cells were lysed following a 48-h incubation at 37 °C in a CO2 incubator for measurement of luciferase activity. A Dual-Luciferase Assay (Promega) was used to quantitate the effects of different miRNA interactions with the promoter of AQP4. The luciferase assay was performed according to the manufacturer's protocol. In all experiments, transfection efficiencies were normalized to those of cells co-transfected with the Renilla luciferase expression vector (at 5 ng/well; pRL-CMV, Promega). All relative expression levels were plotted with respect to the appropriate negative controls.
miRCURY LNATM MicroRNA Array
The microRNA array (miRCURY LNA) (Exiqon, Vedbaek, Denmark) was performed as described by Lim et al. (16). LNA-modified oligonucleotide (Exiqon) probes for human, mouse, and rat miRNAs annotated in miRBase version 11.0 were used in the microarray. Total RNA (1 μg) was 3′-end-labeled with Hy3 dye using the miRCURY LNA Power Labeling kit (Exiqon) and hybridized on miRCURY LNA Arrays using a MAUI hybridization system. A background-subtracted mean intensity of 300 was selected as a threshold value before normalization against the U6 snRNA.
Hypoxia and Oxygen/Glucose Deprivation (OGD) Experiments
Hypoxia and OGD experiments were adapted from Sepramaniam et al. (3) with slight modifications. Human astrocytoma cells were seeded at a density of 1.0 × 10⁵ (24-well plates) and subjected to hypoxia or OGD where the cells were maintained in an incubation chamber for 6 h at 37 °C in serum-free medium in the absence of oxygen (hypoxia) or oxygen and glucose (OGD). Oxygen in the chamber was displaced with a nitrogen gas flow rate of 1.3 liters/min. Corresponding control cell cultures were maintained in serum-free medium at 37 °C in a 5% CO2 incubator. After 6 h, the cells were allowed to recover at 37 °C in a 5% CO2 incubator for 16–18 h prior to further work.
Transient Focal Cerebral Ischemia
Transient focal cerebral ischemia was induced in male Wistar rats through middle cerebral artery occlusion as described by Jeyaseelan et al. (14). The animals were handled according to the guidelines of the Council for International Organizations of Medical Sciences on animal experimentation (World Health Organization, Geneva, Switzerland) and the National University of Singapore. The animal protocols were approved by the National University of Singapore Institutional Animal Care and Use Committee (IACUC Protocol 081/09). Transient ischemic stroke was created in rat models via middle cerebral artery occlusion for a period of 1 h. After 1 h of occlusion, the suture was removed to allow for reperfusion. Intracerebroventricular administration of anti-LNA miR-130a was carried out immediately after the removal of the suture. For infarct volume quantitation, whole rat brain slices were stained in 2,3,5-triphenyltetrazolium chloride (Sigma) and fixed in 10% buffered formalin. Stained brain slices were scanned, and the images were analyzed using Scion Image analysis software.
Statistical Analysis
Data are presented as mean ± S.D. of three or more independent results. Statistical significance was determined using a two-tailed unpaired Student's t test. p values <0.05 were taken as statistically significant.
RESULTS
Identification of miRNAs Binding to AQP4 M1 Promoter Region
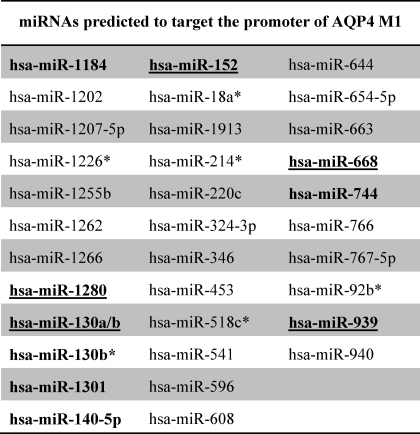
The AQP4 gene has been shown to contain two alternative promoters (Fig. 1A). In this study, given the importance of the longer transcript in relation to ischemia, we focused on the promoter of AQP4 M1 (NCBI accession number AF026814). The RegRNA program allows prediction of miRNAs interacting at any part of a given sequence (17). Thus, RegRNA was used to predict possible miRNA interactions at the AQP4 M1 promoter. A total of 34 miRNAs were predicted by RegRNA to bind to the AQP4 M1 promoter (Table 1). Expression of 10 of these miRNAs (hsa-miR-1184, -1280, -130a/b, -130b*, -1301, -140–5p, -152, -668, -744, and -939) were also identified in our miRNA profiling of astrocytoma cells (supplemental Table S2) with five of them (hsa-miR-668, -1280, -130a, -152, and -939) being highly expressed (Table 1). Stem-loop PCR was performed to revalidate the expression of these five miRNAs in astrocytoma cells (Table 2) as well as in an unrelated cell line, HeLa (HTB-47). Consistent with the miRNA array results, all five miRNAs were also detected in astrocytoma cells; however, only miR-130a and miR-1280 were observed to be expressed in HeLa cells.
TABLE 1.
miRNAs predicted to target promoter of AQP4 M1
The list of predicted miRNAs was obtained from RegRNA (release 1.0). Using miRNA profiling data of astrocytoma cells and the prediction list, the miRNAs expressed in astrocytes were short-listed (in bold). Given the huge range of signal intensities (ranging from 92 to 64,675), the top 70% of the highly expressed miRNAs were short-listed for further studies (bold and underlined).
TABLE 2.
Stem-loop PCR for miRNA expression levels
Cycle threshold (CT) values of selected miRNAs in astrocytoma and HeLa cells. CT values for respective miRNAs were determined from 10 ng of total RNA reverse transcribed using miRNA-specific stem-loop primers. NTC refers to non-template controls. 18 S expression was used as positive control. Data shown are the mean ± S.D. (n = 3).
| miRNA |
CT values |
|
|---|---|---|
| Astrocytoma | HeLa | |
| miR-130a | 28.22 ± 0.217 | 28.37 ± 0.109 |
| miR-152 | 30.82 ± 0.049 | Undetermined |
| miR-668 | 32.26 ± 0.107 | Undetermined |
| miR-939 | 30.75 ± 0.095 | Undetermined |
| miR-1280 | 19.19 ± 0.201 | 30.12 ± 0.126 |
| NTC | Undetermined | Undetermined |
| 18 S | 9.23 ± 0.188 | 9.51 ± 0.216 |
Evaluation of Promoter Activity of AQP4 M1
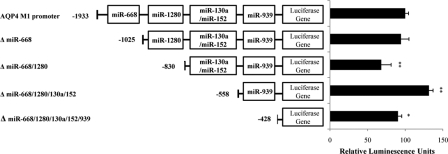
Based on the prediction data obtained from RegRNA, the recognition sites of the five miRNAs (hsa-miR-668, -1280, -130a, -152, and -939) were mapped on the promoter of AQP4 M1 (Fig. 1B). Interestingly, miR-130a and miR-152 were predicted to interact at the same region. It is noteworthy that these miRNAs do not target the promoter of AQP4 M23 (data not shown). To evaluate the effect of these five miRNAs on the AQP4 M1 promoter activity, the entire 2.1-kb promoter region upstream of exon 0 was cloned into a promoterless luciferase vector, pGL4. The expression of AQP4 M1 promoter in astrocytoma cells that contained all five microRNAs versus the promoterless plasmid pGL4 was also measured (supplemental Fig. S1). Several 5′ miRNA deletion constructs consisting of sequential deletions of the predicted miRNA target sites were also generated (Fig. 2). The constructs were transfected into astrocytoma cells, and their respective promoter activity was determined using luciferase reporter assays. Among the different promoter deletion constructs, loss of the miR-668 binding site did not result in any significant change in luciferase activity. Unlike miR-668, deletion of the miR-1280 potential binding site resulted in a 32% reduction in luciferase activity, suggesting that it behaves as an activator. Deletion of the miR-130a/-152 recognition site, however, resulted in a 30% increase in the promoter activity (Fig. 2). Hence, they could be considered as potential suppressors. Loss of the miR-939 recognition site resulted in only a 10% reduction in promoter activity; this was somewhat similar to miR-668.
FIGURE 2.
AQP4 M1 promoter activity analysis. The luciferase reporter constructs containing the flanking regions of the AQP4 M1 promoter are shown. The promoter of AQP4 M1 contains five miRNA target regions. Deletion constructs had one or more of the miRNA target regions removed. These luciferase reporter constructs were transfected into astrocytoma cells. Luciferase activity of the full promoter was taken as 100%. Luciferase activity of all other deletion constructs was expressed relative to the activity of the full promoter. Statistical analyses were done using t tests. *, p < 0.05; **, p < 0.01 compared with control. Error bars represent the mean ± S.E. (n = 3).
Effect of miRNA Modulation on Promoter Activity of AQP4 M1
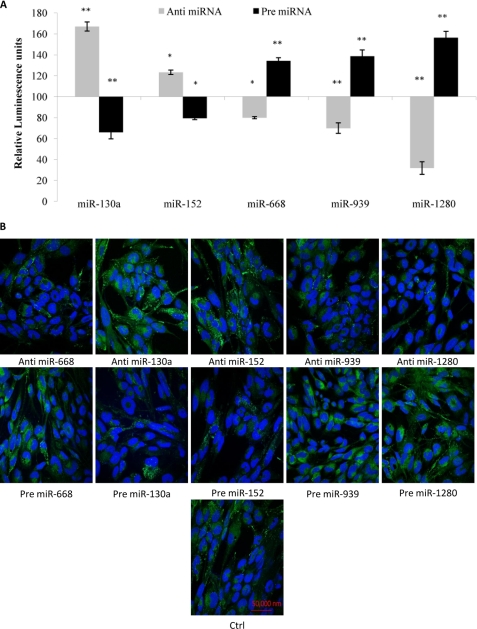
We have observed that the loss of the miRNA binding sites could have an effect on the promoter activity. To ascertain our observations, we chose to modulate the inherent miRNAs levels and look at the resultant effects on the promoter activity of AQP4 M1. Hence, the whole promoter construct was co-transfected together with the anti- or pre-miRNAs into astrocytoma cells. Introduction of anti-miR-130a caused a 60% increase in the AQP4 M1 promoter activity, whereas anti-miR-152-treated cells only showed a 25% increase. The opposite profile was noted when the precursor forms (pre-miR-130a and -152) were transfected into the cells (Fig. 3A). Transfection of anti-miR-668, -1280, and -939 caused a decrease in the promoter activity with significantly lowest activity observed in the presence of anti-miR-1280. Introduction of the precursor forms (pre-miR-668, -939, and -1280) caused an increase in the promoter activity. To observe the effect of these transfections on the protein level, promoter constructs containing the AQP4 CDS were separately co-transfected with the anti- and pre-miRNAs into astrocytoma cells. The changes in the AQP4 protein expression were then captured using FITC-labeled goat anti-rabbit antibodies. Changes in AQP4 protein expression reflected that of the luciferase readings (Fig. 3B).
FIGURE 3.
Effect of miRNA modulation on promoter activity of AQP4 M1. A, the luciferase reporter construct containing the entire 2.1-kb promoter was transfected into astrocytoma cells with the anti- or pre-miRNAs. Luciferase luminescence readings were obtained 48 h post-transfection. Relative luminescence was obtained by normalizing the value against respective negative control plasmids. Statistical analyses were done using t tests. *, p < 0.05; **, p < 0.01 compared with control. Error bars represent the mean ± S.E. (n = 3). B, AQP4 immunoreactivities in astrocytoma cells transfected with anti- or pre-miRNAs. Human astrocytoma cells were co-transfected with promoter/AQP4 CDS constructs together with anti- or pre-miR-130a, -152, -668, -939, or -1280. Control (Ctrl) cells were transfected with AQP4 CDS constructs and scrambled miRNAs. The cells were fixed, immunolabeled with anti-AQP4 antibodies (green), and stained with the nuclear stain DAPI (blue).
Effect of miR-130a and miR-1280 on Promoter Activity of AQP4 M1
Our findings so far show that modulation of miR-130a and miR-1280 had the greatest effect on the AQP4 M1 promoter activity (Fig. 3A). We had also shown that only miR-130a and -1280 are expressed in HeLa cell lines (Table 2). Thus, this cell line was used to study the effects of just miR-130a and -1280 on the AQP4 M1 promoter construct. The miR-130a and -1280 recognition sites were mutated using sequence-specific primers (supplemental Table S1). The construct with mutations at both the miR-1280 and miR-130a recognition sites was used as the reference in this study (Fig. 4). In the presence of the miR-1280 recognition site (miR-130a mutant), a marginal activation of promoter activity was seen. However, in the presence of the miR-130a recognition site (miR-1280 mutant), a strong repression in promoter activity was observed. These results suggest that miR-1280 functions as a weak activator, whereas miR-130a acts as a strong repressor of the AQP4 M1 promoter.
FIGURE 4.
miR-1280/-130a mutant constructs. Using the miR-668 deletion construct (which contains recognition sites for miR-1280 and miR-130a), three other plasmids were generated such that they contained miR-1280 and/or miR-130a recognition site mutations. Mutated sites are represented by xxxxx. The respective mutated constructs were transfected into HeLa cells, and the relative promoter activity of the constructs were obtained with respect to the miR-1280/-130a double mutant construct. The predicted recognition site of miR-939 was not taken into consideration as these constructs were transfected into HeLa cells, which do not express miR-939. Statistical analyses were done using t tests. *, p < 0.05; **, p < 0.01 compared with control. Error bars represent the mean ± S.E. (n = 3).
Intracellular Modulation of AQP4 M1 Transcript by miR-130a
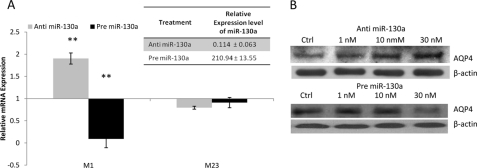
We have identified miR-130a as a strong modulator of the promoter of AQP4 M1. To understand the in vitro effects of miR-130a, astrocytoma cells were transfected with anti- or pre-miR-130a. The changes in the miR-130a expression levels were determined using quantitative stem-loop PCR, whereas the expression levels of AQP4 transcripts were determined using quantitative real time PCR. Although differential expression of the AQP4 M1 transcript was observed with anti- and pre-miR-130a treatment, the M23 transcript levels remained unchanged (Fig. 5A). These findings support our hypothesis that miR-130a can be used as a specific regulator of the AQP4 M1 promoter. The effect of miR-130a modulation on the AQP4 M1 promoter showed a resultant dose-dependent effect on AQP4 protein expression (Fig. 5B). As the anti-miR-130a concentrations were increased from 1 to 30 nm, a resultant increase in AQP4 protein expression was seen. Similarly, with increasing pre-miR-130a concentration, a dose-dependent decrease in AQP4 protein expression was noted.
FIGURE 5.
Relative expression of AQP4. A, astrocytoma cells were transfected with anti- or pre-miR-130a or corresponding anti- or pre-miRNA negative controls. Total RNA was extracted, and the miR-130a levels were determined using stem-loop PCR (see inset). The relative expression levels of miR-130a were expressed with respect to the appropriate scrambled negative controls. The corresponding AQP4 mRNA levels were also determined. Specific primers were used to differentiate between the two AQP4 isoforms, M1 and M23. Data shown are the mean ± S.D. (n = 3). B, astrocytoma cells were transfected with anti- or pre-miR-130a at various concentrations or corresponding anti- or pre-miRNA negative controls (Ctrl). Total protein was extracted and subjected to Western blotting to determine the AQP4 protein levels.
Changes in miR-130a and AQP4 Expression in Ischemic Conditions in Vitro and in Vivo
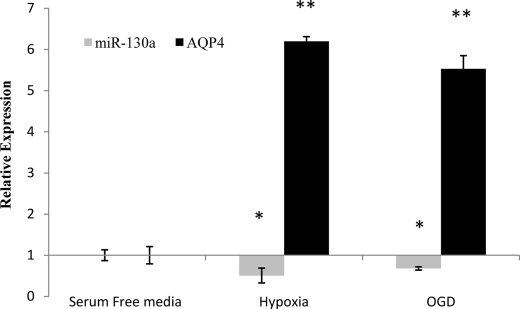
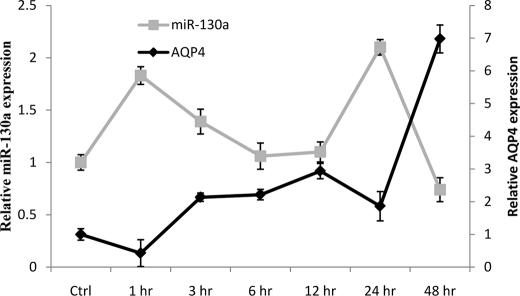
Cerebral ischemia is often associated with partial or complete loss of energy supply to the brain. To understand changes in expression of AQP4 M1 and miR-130a in such situations, we subjected astrocytoma cells to in vitro conditions mimicking ischemia. The astrocytoma cells were subjected to hypoxic (no oxygen) and oxygen-glucose deprivation conditions for 6 h, and changes in inherent miR-130a expression and its resultant effect on AQP4 were measured via quantitative PCR. Quantitative real time analysis showed that a sharp increase in AQP4 relative expression was noted in hypoxic as well as OGD conditions (Fig. 6). This was mirrored by a decrease in miR-130a expression. Interestingly, during hypoxia, the expression of AQP4 was higher than that during OGD. To understand the changes in expression in an in vivo situation, ischemic rodent models were used. These animals were subjected to middle cerebral artery occlusion for a period of 1 h followed by various lengths of reperfusion. Total RNA was extracted from the brain, and changes in miR-130a and AQP4 expression were studied using quantitative PCR. miR-130a and AQP4 exhibited opposing expression profiles in ischemic rat brain, suggesting that miR-130a could indeed be involved in controlling AQP4 expression (Fig. 7).
FIGURE 6.
Expression of miR-130a and AQP4 M1 in astrocytoma cells subjected to 6 h of hypoxia or OGD. Total cellular RNA was extracted and used to quantify miR-130a and AQP4 M1 levels. Up-regulation AQP4 M1 mRNA under hypoxic and OGD conditions with a relative decrease in miR-130a expression was observed. All values were expressed relative to negative controls. Statistical analyses were done using t tests. *, p < 0.05; **, p < 0.01 compared with control. Error bars represent the mean ± S.E. (n = 3).
FIGURE 7.
miR-130a and AQP4 profile in ischemic rat models. The opposing expression patterns of miR-130a and AQP4 in ischemic rat models are shown. Changes in miR-130a and AQP4 expression levels in the brain samples were quantitated using stem-loop qRT-PCR and qRT-PCR, respectively. All values were expressed relative to control (Ctrl) rats. Error bars represent the mean ± S.E. (n = 3).
Modulation of miR-130a Levels in Vivo
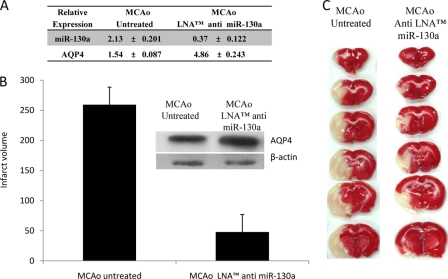
The miR-130a levels in cerebral ischemic animals were modulated to study the effect on AQP4 expression. Middle cerebral artery-occluded rats were injected with LNA anti-miR-130a (n = 6) upon reperfusion. LNA anti-miR-130a reduced inherent miR-130a levels to 0.37 ± 0.122 fold, whereas the respective AQP4 levels increased by 4.86 ± 0.243-fold (Fig. 8A) against untreated controls. A significant reduction in infarct volume was also seen on ischemic brain sections (Fig. 8, B and C).
FIGURE 8.
Expression levels of AQP4 and miR-130a in ischemic rat injected with LNA anti miR-130a. A, changes in AQP4 and miR-130a expression levels in the brain samples were quantitated using quantitative PCR and stem-loop qRT-PCR, respectively. Data shown are the mean ± S.D. B, infarct volume of rat treated with LNA anti miR-130a. Error bars represent the mean ± S.E. (n = 3). AQP4 protein expression correlated with mRNA levels (see inset). C, histological analysis of brain sections. 2,3,5-Triphenyltetrazolium chloride-stained coronal brain sections (2 mm thick) of rats injected with 50 pmol of LNA anti miR-130a are shown. Intracerebroventricular injections were given immediately after the removal of the suture. Surviving cells stained red, whereas dead cells remained white. MCAo, middle cerebral artery occlusion.
DISCUSSION
The importance of AQP4 expression in general in brain water balance has been shown in numerous studies (18–20). Damage to the brain can occur in the form of stroke, injury, or trauma, and the resultant effect often leads to cerebral edema. Changes in AQP4 expression can be detrimental or favorable depending on the cause of edema formation. A decrease in AQP4 expression is thought to be detrimental in conditions such as water intoxication, ischemic stroke, and bacterial meningitis, whereas an increase in AQP4 expression is thought to be beneficial in conditions resulting in vasogenic edema (18–20).
Two predominant AQP4 transcripts (M1 and M23) have been shown to be expressed in the human brain, and the presence of alternative promoters suggests differential regulation of these two isoforms (4, 21). However, little is known about the physiological roles of both the AQP4 isoforms, and most studies do not attempt to differentiate between their expressions. However, a few reports have highlighted the significance of the AQP4 M1 isoform with respect to cerebral water balance. Hirt et al. (8) reported that the AQP4 M1 isoform significantly increased during conditions such as brain injuries and ischemia in edematous tissue. They reported that, although the AQP4 M23 expression was higher under normal conditions, during ischemia the AQP4 M1 expression increased significantly, whereas the AQP4 M23 expression could not be determined (8). What triggers this shift is not understood. Expression of M1 is possibly crucial in cerebral homeostasis as its single channel water permeability rates are much higher than M23. Furthermore, M23 is often implicated with structural organization of the membrane (7, 22).
We had shown previously that modulating the expression of AQP4 via the 3′-UTR with miR-320a can result in a beneficial outcome with respect to cerebral ischemia (3). However, sensing the importance of AQP4 M1 in relation to cerebral water content balance, we sought to identify regulators that could differentiate between the two isoforms. Because the AQP4 isoforms only differ at the amino end of the sequence, it was not possible to differentially regulate their expression using miRNAs that targeted their 3′-UTR. Thus, our search aimed at identifying miRNAs that could differentially regulate the different promoters of this gene. We explored the presence of miRNAs that could selectively regulate the promoter activity of AQP4 M1.
Unlike databases such as microRNA.org or Targetscan, RegRNA allows the input of promoter and 5′-UTR sequences to predict miRNA interaction (17). Using the RegRNA prediction software and miRNA profiling data (supplemental Table S2), we short-listed 10 miRNAs (hsa-miR-1184, -1280, -130a/b, -130b*, -1301, -140–5p, -152, -668, -744, and -939) that could target the promoter of AQP4 M1. The expression of five of the highly expressed miRNAs (hsa-miR-668, -1280, -130a, -152, and -939) were revalidated using stem-loop PCR. Interaction of the five selected miRNAs with the promoter was predicted at regions almost 1 kb upstream of the transcription start site. Younger and Corey (12) reported previously that although synthetic small RNAs could not interact with promoter regions far away from the transcription start site miRNA mimics were capable of interacting with the target even more than 500 bases upstream of the transcription start site (12, 23). In fact, they also observed that even with extensive mismatches the miRNA mimics could regulate the human progesterone receptor promoter, whereas the regulatory activity of synthetic small RNAs was lost even with a single mismatched nucleotide (12). This characteristic of miRNAs highlights the difficulty in identifying their exact targets but yet again shows the versatility of their interaction.
Based on direct interaction studies, we observed that all five miRNAs could modulate the promoter activity. However, miR-1280 and -130a seemed to exhibit the strongest opposing effects on the promoter activity. Nevertheless, site-directed mutagenesis studies revealed miR-1280 to be a relatively poor activator, whereas miR-130a remained a strong repressor.
To understand the effects of modulating miR-130a levels in an in vitro system, anti- and pre-miR-130a were transfected into astrocytoma cells. Quantitative real time PCR revealed changes in the relative expression levels of the AQP4 M1 transcript but not in the M23 (Fig. 5A). Previous reports had identified MAFB (24), ATXN1 (25), TAC1 (26), and MEOX2/GAX and HOXA5 (27) as direct mRNA targets of miR-130a. From our mRNA profiling data, we also observed that these validated targets of miR-130a were similarly regulated (supplemental Fig. S2). Furthermore, Chen and Gorski (27) showed that miR-130a was serum-responsive, and its expression was increased in medium supplemented with 10% fetal bovine serum. We too observed a similar phenomenon: if the cells were transferred to a serum-free medium, a decrease in miR-130a expression was noted, and AQP4 M1 expression was up-regulated (supplemental Fig. S3). In vitro conditions such as hypoxia and oxygen glucose deprivation also showed a decrease in miR-130a expression, whereas AQP4 M1 was up-regulated.
Expression of AQP4 is often reported to be up-regulated during various ischemic time points (3, 8), whereas a recent report by Lim et al. (16) showed differential expression of miR-130a during ischemia. We also observed that among the five miRNAs chosen for the study, miR-130a was the only one conserved in mammals (16). These findings strengthened our observations that miR-130a plays an important role and can be used to selectively modulate the transcription of AQP4 M1.
Although we have shown that miR-130a functions as a transcriptional regulator of AQP4, previous reports on the promoter of AQP4 M1 suggested the presence of an E-box region that acted as a suppressor (20, 28). Umenishi and Verkman (21) considered the E-box region to play a crucial role in the transcriptional suppression of the promoter. Mapping the five selected miRNAs in the AQP4 M1 promoter region showed that E-box 1 (E1) and E-box 2 (E2) were closer to the miR-130a and miR-939 recognition sites, respectively (Fig. 1B). Thus, the miR-130a recognition site lies between E1 and E2. Because we observed strong suppressor activity with miR-130a, several deletion/mutation constructs were created to span the two E-boxes and miR-130a (supplemental Fig. S4). The contribution by the miR-939 recognition site was ignored as miR-939-based regulation of the promoter was seen to be relatively weak, and its expression had already been verified to be absent (Table 2) in the HeLa cells used in this experiment.
Promoter activity analysis showed, as seen by Umenishi and Verkman (21), that E1 had a marginal effect on the transcriptional activity, whereas E2 acted as a strong repressor. However, our observation of miR-130a being a repressor was also evident. In fact, we observed that even in the presence of the E2 repression the loss of the miR-130a recognition site could significantly increase the transcriptional activity of the AQP4 M1 promoter. Furthermore, the transcriptional activity of the promoter in the presence of E2 could be modulated using anti- or pre-miR-130a (supplemental Fig. S4).
Another study by Ito el al. (29) showed that increasing the interleukin-1β (IL1β) concentration could mediate transcriptional activation of the AQP4 M1 promoter via the transcription factor nuclear factor κB (NFκB). However, no NFκB binding site was identified on the AQP4 M1 promoter, suggesting an indirect effect by the transcription factor (29). We observed that removal of IL1β from cultured cells did not significantly affect AQP4 M1 expression. Furthermore, even in the absence of IL1β, regulation of the promoter activity with miR-130a was evident (supplemental Fig. S5). Contrary to the findings of Ito et al. (29), Tourdias et al. (30) showed opposing IL1β and AQP4 profiles in animal models. They reported that in inflammatory animal models IL1β expression in the brain peaked at day 1 and dropped back to basal levels by day 7. However, AQP4 expression remained low until day 1 and started increasing significantly up until 20 days (30). The contradicting effects of IL1β on AQP4 expression could be due to variability in its functional roles. Administration of recombinant IL1β into ischemic brains exacerbated cerebral edema, necrosis, and neutrophil infiltration, whereas IL1β-neutralizing antibodies reduced infarct volume. Interestingly, this effect was only seen in ischemic brains, and no significant changes were seen in normal brains administered recombinant IL1β (31).
Ischemia triggers a variety of inflammatory responses in brain, and IL1β is a proinflammatory cytokine that induces the expression of several genes including NFκB (32). As reported previously, IL1β expression was significantly increased in ischemic brain (supplemental Table S3). IL1β is known to induce activation of NFκB, which in turn binds to the IL1β promoter and further enhances IL1β transcription (33). Activation of NFκB is known to regulate various genes involved in inflammation, apoptosis, and proliferation. In fact, NFκB also enhances the transcription of its inhibitor, inhibitor of nuclear factor of κ light chain gene enhancer in B-cells (IκB) and autoregulates its own expression (34). Real time analysis of the brain samples of our ischemic animal models showed that NFκB expression was elevated, whereas IκB was down-regulated (supplemental Table S3). IκB sequesters NFκB and renders it inactive. Down-regulation of IκB in ischemic brain samples suggests that NFκB is in its active state. Although we postulate that transcription of the AQP4 M1 promoter is controlled by miR-130a, significant increases in the expression of indirect activators such as IL1β and NFκB could also enhance its expression.
Although the role of NFκB in the brain is unclear, a study by Schneider et al. (35) showed that activation of NFκB promotes apoptosis in ischemia, suggesting that elevated levels of NFκB are detrimental in ischemia (35). Administration of anti-miR-130a in an in vivo cerebral ischemia setting showed a significant reduction in the infarct volume. Real time analyses showed that AQP4 levels were further enhanced, supporting our previous findings that up-regulation of AQP4 expression 24 h after ischemia was beneficial for recovery. Moreover, expression of IL1β and NFκB, which are postulated to be indirect regulators of AQP4, was reduced in these animals. In addition, IκB expression was observed to be up-regulated, suggesting that autoregulatory mechanisms of NFκB expression are underway and that NFκB could be in an “inactive” state. Thus the enhancement of AQP4 expression seen in the anti miR-130a treated samples can be attributed to the reduced miR-130a levels.
Incidentally, a recent study by Zhou et al. (36) showed that the NFκB subunit p65 could bind to the promoters of several miRNAs including miR-130a (36). Because the AQP4 M1 promoter does not include a NFκB site, the missing link seen between NFκB activation and AQP4 expression could be in fact miR-130a. We postulate that upon cerebral ischemia increased IL1β expression triggers NFκB activation, which in turn could bind the miR-130a promoter and increase its transcription. Increased miR-130a levels would then suppress the AQP4 M1 promoter activity and thus the number of functional transcripts and eventually induce edema accumulation. This suppression is relieved when IL1β levels drop to normalcy, which is reflected by an increase in AQP4 expression and edema resolution. This phenomenon explains the edema formation and resolution phase seen by Tourdias et al. (30) in relation to opposing IL1β and AQP4 profiles in animal models. However, further evaluation is needed to understand this complex promoter regulation by miR-130a and NFκB.
In conclusion, our study positively establishes the interaction of hsa-miR-668, -1280, -130a, -152, and -939 with the promoter of AQP4 M1 gene. Among these miRNAs, miR-130a appears to be a strong suppressor of the promoter activity. Using anti- or pre-miR-130a, we can selectively regulate the promoter activity of AQP4 M1. Furthermore, miR-130a functions as a suppressor that can modulate the promoter activity even in the presence of other transcriptional (direct or indirect) modulators. Interestingly, of the five miRNAs studied, only miR-130a was conserved in mammals, and in vivo studies reveal that anti-miR-130a could serve as a potential therapeutic agent in ischemic recovery.
Supplementary Material
This work was supported by Research Grants R-184-002-165-281 and R-183-000-290-213 from the Singapore National Research Foundation and National Medical Research Council, respectively.

This article contains supplemental Tables S1–S3 and Figs. S1–S5.
- miRNA
- microRNA
- AQP
- aquaporin
- qRT-PCR
- real time quantitative PCR
- NFκB
- nuclear factor κB
- IκB
- inhibitor of nuclear factor of κ light chain gene enhancer in B-cells
- CDS
- coding sequence
- Tricine
- N-[2-hydroxy-1,1-bis(hydroxymethyl)ethyl]glycine
- OGD
- oxygen/glucose deprivation
- E1
- E-box 1
- E2
- E-box 2.
REFERENCES
- 1. Bartel D. P. (2004) MicroRNAs: genomics, biogenesis, mechanism, and function. Cell 116, 281–297 [DOI] [PubMed] [Google Scholar]
- 2. Ambros V. (2004) The functions of animal microRNAs. Nature 431, 350–355 [DOI] [PubMed] [Google Scholar]
- 3. Sepramaniam S., Armugam A., Lim K. Y., Karolina D. S., Swaminathan P., Tan J. R., Jeyaseelan K. (2010) MicroRNA 320a functions as a novel endogenous modulator of aquaporins 1 and 4 as well as a potential therapeutic target in cerebral ischemia. J. Biol. Chem. 285, 29223–29230 [DOI] [PMC free article] [PubMed] [Google Scholar]
- 4. Jung J. S., Bhat R. V., Preston G. M., Guggino W. B., Baraban J. M., Agre P. (1994) Molecular characterization of an aquaporin cDNA from brain: candidate osmoreceptor and regulator of water balance. Proc. Natl. Acad. Sci. U.S.A. 91, 13052–13056 [DOI] [PMC free article] [PubMed] [Google Scholar]
- 5. Nielsen S., Nagelhus E. A., Amiry-Moghaddam M., Bourque C., Agre P., Ottersen O. P. (1997) Specialized membrane domains for water transport in glial cells: high-resolution immunogold cytochemistry of aquaporin-4 in rat brain. Neuroscience 17, 171–180 [DOI] [PMC free article] [PubMed] [Google Scholar]
- 6. Fenton R. A., Moeller H. B., Zelenina M., Snaebjornsson M. T., Holen T., MacAulay N. (2010) Differential water permeability and regulation of three aquaporin 4 isoforms. Cell. Mol. Life Sci. 67, 829–840 [DOI] [PMC free article] [PubMed] [Google Scholar]
- 7. Silberstein C., Bouley R., Huang Y., Fang P., Pastor-Soler N., Brown D., Van Hoek A. N. (2004) Membrane organization and function of M1 and M23 isoforms of aquaporin-4 in epithelial cells. Am. J. Physiol. Renal Physiol. 287, F501–F511 [DOI] [PubMed] [Google Scholar]
- 8. Hirt L., Ternon B., Price M., Mastour N., Brunet J. F., Badaut J. (2009) Protective role of early aquaporin 4 induction against postischemic edema formation. J. Cereb. Blood Flow Metab. 29, 423–433 [DOI] [PubMed] [Google Scholar]
- 9. Place R. F., Li L. C., Pookot D., Noonan E. J., Dahiya R. (2008) MicroRNA-373 induces expression of genes with complementary promoter sequences. Proc. Natl. Acad. Sci. U.S.A. 105, 1608–1613 [DOI] [PMC free article] [PubMed] [Google Scholar]
- 10. Majid S., Dar A. A., Saini S., Yamamura S., Hirata H., Tanaka Y., Deng G., Dahiya R. (2010) MicroRNA-205-directed transcriptional activation of tumor suppressor genes in prostate cancer. Cancer 116, 5637–5649 [DOI] [PMC free article] [PubMed] [Google Scholar]
- 11. Kim D. H., Saetrom P., Snøve O., Jr., Rossi J. J. (2008) MicroRNA-directed transcriptional gene silencing in mammalian cells. Proc. Natl. Acad. Sci. U.S.A. 105, 16230–16235 [DOI] [PMC free article] [PubMed] [Google Scholar]
- 12. Younger S. T., Corey D. R. (2011) Transcriptional gene silencing in mammalian cells by miRNA mimics that target gene promoters. Nucleic Acids Res. 39, 5682–5691 [DOI] [PMC free article] [PubMed] [Google Scholar]
- 13. Cheng A. M., Byrom M. W., Shelton J., Ford L. P. (2005) Antisense inhibition of human miRNAs and indications for an involvement of miRNA in cell growth and apoptosis. Nucleic Acids Res. 33, 1290–1297 [DOI] [PMC free article] [PubMed] [Google Scholar]
- 14. Jeyaseelan K., Lim K. Y., Armugam A. (2008) MicroRNA expression in the blood and brain of rats subjected to transient focal ischemia by middle cerebral artery occlusion. Stroke 39, 959–966 [DOI] [PubMed] [Google Scholar]
- 15. Satoh J., Tabunoki H., Yamamura T., Arima K., Konno H. (2007) Human astrocytes express aquaporin-1 and aquaporin-4 in vitro and in vivo. Neuropathology 27, 245–256 [DOI] [PubMed] [Google Scholar]
- 16. Lim K. Y., Chua J. H., Tan J. R., Swaminathan P., Sepramaniam S., Armugam A., Wong P. T., Jeyaseelan K. (2010) MicroRNAs in cerebral ischemia. Transl. Stroke Res. 1, 287–303 [DOI] [PubMed] [Google Scholar]
- 17. Huang H. Y., Chien C. H., Jen K. H., Huang H. D. (2006) RegRNA: an integrated web server for identifying regulatory RNA motifs and elements. Nucleic Acids Res. 34, W429–W434 [DOI] [PMC free article] [PubMed] [Google Scholar]
- 18. Manley G. T., Fujimura M., Ma T., Noshita N., Filiz F., Bollen A. W., Chan P., Verkman A. S. (2000) Aquaporin-4 deletion in mice reduces brain edema after acute water intoxication and ischemic stroke. Nat. Med. 6, 159–163 [DOI] [PubMed] [Google Scholar]
- 19. Papadopoulos M. C., Manley G. T., Krishna S., Verkman A. S. (2004) Aquaporin-4 facilitates reabsorption of excess fluid in vasogenic brain edema. FASEB J. 18, 1291–1293 [DOI] [PubMed] [Google Scholar]
- 20. Papadopoulos M. C., Verkman A. S. (2005) Aquaporin-4 gene disruption in mice reduces brain swelling and mortality in pneumococcal meningitis. J. Biol. Chem. 280, 13906–13912 [DOI] [PubMed] [Google Scholar]
- 21. Umenishi F., Verkman A. S. (1998) Isolation and functional analysis of alternative promoters in the human aquaporin-4 water channel gene. Genomics. 50, 373–377 [DOI] [PubMed] [Google Scholar]
- 22. Sorbo J. G., Moe S. E., Ottersen O. P., Holen T. (2008) The molecular composition of square arrays. Biochemistry 47, 2631–2637 [DOI] [PubMed] [Google Scholar]
- 23. Janowski B. A., Huffman K. E., Schwartz J. C., Ram R., Hardy D., Shames D. S., Minna J. D., Corey D. R. (2005) Inhibiting gene expression at transcription start sites in chromosomal DNA with antigene RNAs. Nat. Chem. Biol. 1, 216–222 [DOI] [PubMed] [Google Scholar]
- 24. Garzon R., Pichiorri F., Palumbo T., Iuliano R., Cimmino A., Aqeilan R., Volinia S., Bhatt D., Alder H., Marcucci G., Calin G. A., Liu C. G., Bloomfield C. D., Andreeff M., Croce C. M. (2006) MicroRNA fingerprints during human megakaryocytopoiesis. Proc. Natl. Acad. Sci. U.S.A. 103, 5078–5083 [DOI] [PMC free article] [PubMed] [Google Scholar]
- 25. Lee Y., Samaco R. C., Gatchel J. R., Thaller C., Orr H. T., Zoghbi H. Y. (2008) miR-19, miR-101 and miR-130 co-regulate ATXN1 levels to potentially modulate SCA1 pathogenesis. Nat. Neurosci. 11, 1137–1139 [DOI] [PMC free article] [PubMed] [Google Scholar]
- 26. Greco S. J., Rameshwar P. (2007) MicroRNAs regulate synthesis of the neurotransmitter substance P in human mesenchymal stem cell-derived neuronal cells. Proc. Natl. Acad. Sci. U.S.A. 104, 15484–15489 [DOI] [PMC free article] [PubMed] [Google Scholar]
- 27. Chen Y., Gorski D. H. (2008) Regulation of angiogenesis through a microRNA (miR-130a) that down-regulates antiangiogenic homeobox genes GAX and HOXA5. Blood 111, 1217–1226 [DOI] [PMC free article] [PubMed] [Google Scholar]
- 28. Arima H., Yamamoto N., Sobue K., Umenishi F., Tada T., Katsuya H., Asai K. (2003) Hyperosmolar mannitol simulates expression of aquaporins 4 and 9 through a p38 mitogen-activated protein kinase-dependent pathway in rat astrocytes. J. Biol. Chem. 278, 44525–44534 [DOI] [PubMed] [Google Scholar]
- 29. Ito H., Yamamoto N., Arima H., Hirate H., Morishima T., Umenishi F., Tada T., Asai K., Katsuya H., Sobue K. (2006) Interleukin-1β induces the expression of aquaporin-4 through a nuclear factor-κB pathway in rat astrocytes. J. Neurochem. 99, 107–118 [DOI] [PubMed] [Google Scholar]
- 30. Tourdias T., Mori N., Dragonu I., Cassagno N., Boiziau C., Aussudre J., Brochet B., Moonen C., Petry K. G., Dousset V. (2011) Differential aquaporin 4 expression during edema build-up and resolution phases of brain inflammation. J. Neuroinflammation 8, 143. [DOI] [PMC free article] [PubMed] [Google Scholar]
- 31. Yamasaki Y., Matsuura N., Shozuhara H., Onodera H., Itoyama Y., Kogure K. (1995) Interleukin-1 as a pathogenetic mediator of ischemic brain damage in rats. Stroke 26, 676–680; discussion 681 [DOI] [PubMed] [Google Scholar]
- 32. Moynagh P. N., Williams D. C., O'Neill L. A. (1993) Interleukin-1 activates transcription factor NFκB in glial cells. Biochem. J. 294, 343–347 [DOI] [PMC free article] [PubMed] [Google Scholar]
- 33. Cogswell J. P., Godlevski M. M., Wisely G. B., Clay W. C., Leesnitzer L. M., Ways J. P., Gray J. G. (1994) NF-κB regulates IL-1β transcription through a consensus NF-κB binding site and a nonconsensus CRE-like site. J. Immunol. 153, 712–723 [PubMed] [Google Scholar]
- 34. Scott M. L., Fujita T., Liou H. C., Nolan G. P., Baltimore D. (1993) The p65 subunit of NF-κB regulates IκB by two distinct mechanisms. Genes Dev. 7, 1266–1276 [DOI] [PubMed] [Google Scholar]
- 35. Schneider A., Martin-Villalba A., Weih F., Vogel J., Wirth T., Schwaninger M. (1999) NF-κB is activated and promotes cell death in focal cerebral ischemia. Nat. Med. 5, 554–559 [DOI] [PubMed] [Google Scholar]
- 36. Zhou R., Hu G., Gong A. Y., Chen X. M. (2010) Binding of NF-κB p65 subunit to the promoter elements is involved in LPS-induced transactivation of miRNA genes in human biliary epithelial cells. Nucleic Acids Res. 38, 3222–3232 [DOI] [PMC free article] [PubMed] [Google Scholar]
Associated Data
This section collects any data citations, data availability statements, or supplementary materials included in this article.


