Abstract
Purpose: Quantitative cone-beam CT (CBCT) imaging is on increasing demand for high-performance image guided radiation therapy (IGRT). However, the current CBCT has poor image qualities mainly due to scatter contamination. Its current clinical application is therefore limited to patient setup based on only bony structures. To improve CBCT imaging for quantitative use, we recently proposed a correction method using planning CT (pCT) as the prior knowledge. Promising phantom results have been obtained on a tabletop CBCT system, using a correction scheme with rigid registration and without iterations. More challenges arise in clinical implementations of our method, especially because patients have large organ deformation in different scans. In this paper, we propose an improved framework to extend our method from bench to bedside by including several new components.
Methods: The basic principle of our correction algorithm is to estimate the primary signals of CBCT projections via forward projection on the pCT image, and then to obtain the low-frequency errors in CBCT raw projections by subtracting the estimated primary signals and low-pass filtering. We improve the algorithm by using deformable registration to minimize the geometry difference between the pCT and the CBCT images. Since the registration performance relies on the accuracy of the CBCT image, we design an optional iterative scheme to update the CBCT image used in the registration. Large correction errors result from the mismatched objects in the pCT and the CBCT scans. Another optional step of gas pocket and couch matching is added into the framework to reduce these effects.
Results: The proposed method is evaluated on four prostate patients, of which two cases are presented in detail to investigate the method performance for a large variety of patient geometry in clinical practice. The first patient has small anatomical changes from the planning to the treatment room. Our algorithm works well even without the optional iterations and the gas pocket and couch matching. The image correction on the second patient is more challenging due to the effects of gas pockets and attenuating couch. The improved framework with all new components is used to fully evaluate the correction performance. The enhanced image quality has been evaluated using mean CT number and spatial nonuniformity (SNU) error as well as contrast improvement factor. If the pCT image is considered as the ground truth, on the four patients, the overall mean CT number error is reduced from over 300 HU to below 16 HU in the selected regions of interest (ROIs), and the SNU error is suppressed from over 18% to below 2%. The average soft-tissue contrast is improved by an average factor of 2.6.
Conclusions: We further improve our pCT-based CBCT correction algorithm for clinical use. Superior correction performance has been demonstrated on four patient studies. By providing quantitative CBCT images, our approach significantly increases the accuracy of advanced CBCT-based clinical applications for IGRT.
Keywords: scatter correction, shading correction, quantitative cone-beam CT, radiation therapy, planning CT
INTRODUCTION
Quantitative cone-beam CT (CBCT) imaging is on increasing demand for high-performance image guided radiation therapy (IGRT) since it provides a foundation for advanced image-guidance techniques, including online tumor delineation1, 2 and patient dose calculation.3, 4, 5 With more precise treatment monitoring from accurate CBCT images, dose delivery errors can be significantly reduced in each fraction6, 7 and further compensated for in subsequent fractions using adaptive radiation therapy.8, 9 However, the current CBCT imaging has severe shading artifacts mainly due to scatter contamination,10, 11, 12, 13, 14 and its current clinical application is therefore limited to patient setup based on only bony structures. To improve CBCT imaging for quantitative use, we recently proposed a shading correction method using planning CT (pCT) as the prior knowledge.15 Promising results were shown on phantoms, with reconstruction errors reduced from 348 Hounsfield unit (HU) to below 10 HU by the proposed correction. In this paper, we develop an improved framework to extend our method from bench to bedside by adding several new components into our previous algorithm to enhance the performance in the real clinical environment.
In modern radiation therapy, patients are routinely scanned by conventional CT scanners for planning purposes before treatment. These scanners provide accurate pCT images because of small inherent scatter signals, as well as more linear detectors and sophisticated correction algorithms that have been developed over the past 30 years.16 We propose to use pCT images as “free” prior information to improve the CBCT image quality. Primary signals in the CBCT scan are first estimated via forward projection on the pCT image of the same object. If the pCT image is registered well to the object geometry in the CBCT scan, the difference between these estimated primary signals and the raw CBCT projections contain dominant low-frequency scatter,17, 18, 19, 20 which can be efficiently obtained and corrected for using low-pass filtering. The accuracy of the registration step determines the performance of our method. However, as shown in our previous phantom studies,15 the method obtains effective scatter correction as long as the high-contrast objects are well aligned in the pCT and CBCT images. Small low-contrast discrepancy is not carried over from the pCT to the corrected CBCT. The improved CBCT images therefore retain faithful patient information at treatment time.
Our preliminary phantom results were obtained on a tabletop CBCT system, using a correction scheme with rigid registration. More challenges arise as we translate this technique to clinical use, especially because patients have large organ deformation from the pCT scanner to the treatment room. Here, we propose to improve our method using deformable registration to minimize the geometry difference between the pCT and the CBCT images. The registration performance relies on the accuracy of the CBCT image. As such, we design an iterative scheme to update the CBCT image used in the registration with the corrected image generated in the previous iteration.
Deformable registration cannot guarantee a perfect geometry match when the pCT and the CBCT images do not have the exact one-to-one correspondence.21, 22 Although our method can tolerate geometry mismatch of low-contrast objects,15 its performance will be degraded by unmatched high-contrast objects. In our method, we need to calculate the projection data on the registered pCT image and compare with the raw CBCT projections. These unmatched objects may generate large signals in the differences of raw CBCT projections and estimated primaries, which cannot be separated from scatters using smoothing techniques due to the overlapped low-frequency components. Such a situation is commonly seen on images of human torsos. For example, the rectum may have different gas filling status in the pCT and the CBCT scans. Furthermore, the x-ray beam of a CBCT system covers the patient couch, which has a different geometry from that of a pCT scan. To tackle the difficulties of geometry mismatch, we further improve our method by including a step of gas pocket and couch matching to reduce the errors in the primary estimation.
In this paper, we evaluate the improved shading correction scheme on four prostate patients, who are scheduled for radiation therapy treatments. Two cases are presented in detail to investigate the method performance for a large variety of patient geometry in clinical practice. With the optional features (iterations, gas pocket, and couch matching) disabled, our algorithm works well for patients with small anatomical changes from the planning to the treatment room, as shown on the first patient. The image correction on the second patient is more challenging due to the effects of gas pockets and attenuating couch. The improved framework with all new components is used to fully evaluate the correction performance. The stability of the proposed framework is tested on two more patients.
METHOD
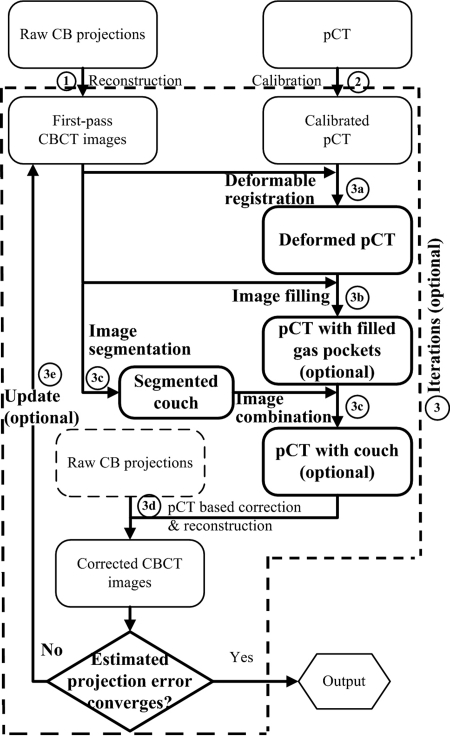
Figure 1 shows the general workflow of the improved algorithm. The shading correction on CBCT images is carried out as the following steps: (Details of the implementations are shown in later Secs. 2, 2, and 2 as indicated in the parentheses.)
-
(1)
Reconstruct a first-pass CBCT image using raw cone-beam projections without correction.
-
(2)
Calibrate the pCT of the same patient from CT number (HU) to linear attenuation coefficient (mm−1).
-
(3)Iterate the pCT-based correction on CBCT until the image quality is satisfactory (Sec. 2).
-
(a)Register the calibrated pCT to the corrected CBCT (or the first-pass CBCT in the first iteration) (Sec. 2).
-
(b)Starting from the second iteration, create artificial gas pockets or fill gas pockets with soft tissues on the pCT image to match the gas pocket geometry on the CBCT image (Sec. 2).
-
(c)Segment the patient couch from the corrected CBCT image (or the first-pass CBCT in the first iteration) and add it on the pCT image.
-
(d)Correct for artifacts of CBCT images using the pCT-based correction algorithm (see Fig. 2).
-
(e)If the residual error is large, go back to step 3(a). Otherwise, output the corrected CBCT as the final result.
-
(a)
Figure 1.
Improved workflow of the quantitative CBCT imaging scheme with the new components. The new components are highlighted in bold. The label of each step corresponds to the description in text.
Figure 2.
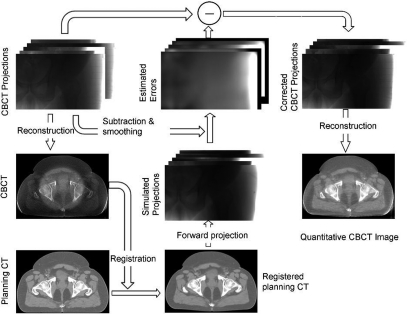
One iteration of scatter correction [mainly step 3(d) in Fig. 1].
Similar to our previous phantom study, the standard FDK algorithm is used in the CBCT reconstruction.23 In the pCT calibration step (2), we convert CT numbers of the pCT to linear attenuation coefficients based on the linear attenuation coefficients of known tissue composition according to the ICRT report 46.24 In step 3(d), the CBCT correction based on a registered and well-calibrated pCT image is implemented exactly as published in our recent paper, except that a penalized weighted least-square (PWLS) algorithm is applied on the corrected CBCT projections to suppress image noise. The implementation of step 3(d) is illustrated in Fig. 2 and the readers are referred to our previous publication for more details.15 A brief summary of these procedures is included below for readers’ convenience.
Using the pCT image as “scatter-free” images, we first estimate the primary projections in the CBCT scan via forward projection of the spatially registered pCT data. Since most of the CBCT shading artifacts stem from low-frequency errors in the projections such as scatter, these errors can be accurately estimated by low-pass filtering the difference between the estimated and the raw CBCT projections. The error estimates are then subtracted from the raw CBCT projections and scatter-corrected CBCT images are generated using a standard FDK algorithm.23
Scatter noise remains in the projections after the proposed correction, since it is mainly high-frequency. We have recently published an effective scatter noise suppression method using a PWLS algorithm in Ref. 25. The PWLS method is a statistics-based algorithm that aims to estimate the linear integrals from noisy x-ray projections by minimizing the PWLS objective function. The PWLS objective function models the first and second moments of the projection data, which is defined as
| (1) |
where is the vector of noise-suppressed line integral data to be estimated, is the vector of scatter-corrected line integral data, ∑ is a diagonal matrix of which the ith element is the variance of at detector pixel i and R is the smoothness penalty function. The variance of is approximated based on Poisson statistics as
| (2) |
where is the measured projection data before scatter correction and logarithm operation and is the estimated scatter. The smoothness of the result is determined by a smoothing parameter β which controls the degree of agreement between the estimated and measured data. In this paper, we use relatively strong noise suppression for a better CBCT image quality with a spatial resolution comparable to that of the pCT. The β values are in the range from 1500 to 2000.
In the following Secs. 2, 2, and 2 , we focus on the new components [all procedures in step 3, except for step 3(d)] in the improved workflow, which are highlighted in bold in Fig. 1.
Image registration
The registration of the pCT image to the CBCT image is implemented as the following three steps:
-
(1)
Background clearing: The backgrounds of the pCT and the CBCT images are removed by filling zeros to the regions outside of the patient volume.
-
(2)
Rigid registration: These “clean” images are registered rigidly to obtain an approximate alignment.
-
(3)
Deformable registration: A deformable registration is applied to further improve the geometry match of the two images.
Step (3) takes the majority of the computation. We model the deformable registration as an optimization problem using a conventional framework. The deformation vector field of the pCT image is iteratively updated to maximize the similarity between the deformed pCT and the CBCT images. The intensity of CBCT image may be inaccurate during the correction process. Therefore, we choose mutual information (MI) as the similarity metric in the registration since it does not rely on the absolute intensities of the two images.26 The vector field is generated using B-spline interpolation over the volume of interest, driven by points on a cubic control grid. B-spline coefficients are defined at regular intervals along the grid, and the deformation field is a smooth interpolation of the coefficients. The coefficients are obtained by minimizing the MI-based metric of the two images. A gradient descent search algorithm is implemented to update the solution in the optimization. Note that deformable registration is still an active research area. Many other successful deformable registration algorithms can also be employed in our method.27, 28
Gas pocket and couch matching
Since scatter is dominantly low-frequency, we obtain only low-frequency signals as CBCT projection errors. As a result, our algorithm is able to suppress small high-frequency errors in the estimated projections stemming from the mismatched low-contrast objects in the pCT and the CBCT images. This feature has been demonstrated in both the studies of our previous publication15 and the patient studies shown later in this paper. When the geometry difference becomes significant (i.e., misalignment of high-contrast objects), however, correction errors in our algorithm are not negligible. In clinical studies, we find that bones in the pCT and the CBCT images can always be registered well. The high-contrast geometry mismatching mainly comes from gas pockets inside the patient and the patient couch of the CBCT system. These problems can be substantially alleviated by modifying the pCT image to match the CBCT geometry in the following steps.
-
(1)
Identify gas pockets in the pCT and the CBCT images. From the registered pCT and the CBCT images with background removed, generate binary masks by setting the voxel value to 1 or 0 if it is below or above a certain threshold. The thresholds are empirically chosen. In the studies presented in this paper, we use 0.015 mm−1 for pCT and 0.01 mm−1 for CBCT. Remove small islands in the binary masks due to image noise by image erosion and then image dilation.
-
(2)
Fill and create gas pockets in the pCT based on the CBCT geometry. First, identify the volume where the pCT has gas pockets but the CBCT does not, by comparing the binary masks generated in step (1). Fill these voxels with the linear attenuation coefficient of soft tissues (0.02 mm−1 in our implementations). Then, identify the volume where the pCT has no gas pockets but the CBCT does, again, by comparing the binary masks generated in step (1). Set these voxels to zeros.
-
(3)
Segment the couch of CBCT and add it to the registered pCT.
It is worth emphasizing that these steps are optional in the proposed algorithm, depending on whether the high-contrast geometry mismatch results in large low-frequency errors in the estimated primary signals. From the clinical studies, we find that small gas pockets (with a volume below 1 cm3) cause negligible errors in our correction. On a Varian radiation therapy machine, the couch top, which is made of carbon fiber, has low attenuation. The correction errors mainly come from the attenuating metal frame of the couch. We can skip the step of couch matching, if the CBCT projection field does not cover the metal frame.
Iteration
Calculations inside each iteration are exactly the same except that the CBCT image is updated with the new correction before the registration step. The iteration should stop when the errors of the reconstructed CBCT images converge to stable values. We find that very few iterations (at most five) are needed for acceptable correction performance. In this study, the total iteration number is empirically chosen based on inspections of the corrected CBCT images.
Evaluation
We evaluated our method on four prostate patients, who were scheduled for radiation therapy treatments at Georgia Radiation Therapy Center, Georgia Health Sciences University. The pCT scans were taken on a 16-slice Philips Brilliance Big Bore CT simulator (Philips Healthcare Systems, Andover, MA) with the helix scan mode. The reconstructed pCT image had a size of 512-by-512-by-114, with the voxel size of 1.17 mm in the axial plane and 3 mm in the longitudinal direction. The CBCT scans were performed on the patients at treatment time using the on-board imager system installed on the Varian Clinac 23IX radiation therapy machine (Varian Medical System, Palo Alto, CA). The system operated in the half-fan scan mode, with a bow-tie filter mounted on the outside of the x-ray collimator and a data acquisition of about 668 projections in a 360° scan. The reconstruction volume had a size of 512-by-512-by-190 with the voxel size of 0.977 mm in all directions.
In the implementation of the proposed method, we used 3D SLICER, an open-source software package,39 in the registration step. The grid size used in the B-spline deformable registration was set as 15 voxels in all directions of the whole image volume. The optimization goal was typically reached after approximately 35 iterations. On a 3.0 GHz workstation, each registration took about 20 min. All other steps were implemented in matlab (version 7.8.0, Mathworks). After registration, the data processing (including forward projection, scatter estimation, noise suppression, and FDK reconstruction) for one projection took about 1 min. Note that the purpose of the presented work is to demonstrate the potential of our approach on the improvement of CBCT image quality. The data processing time can be greatly reduced after standard optimizations, including C implementation and graphics processing units (GPU) acceleration, as addressed in Sec. 4.
In our implementations, a 2D median filter, with a width of 51-by-51 pixels (19.9-by-19.9 mm on the detector), is used to suppress the boundary discrepancy in the difference images of the raw and the estimated CBCT projections. A low-pass 2D Gaussian filter, with a window size of 91-by-91 pixels (35.3-by-35.3 mm) and a standard deviation of 21 pixels (8.1 mm), is then applied to further reduce the high-frequency primary difference without affecting the low-frequency scatter signals. The parameters of these filters are estimated from the sampling period of scatter measurement using both Monte Carlo simulation and beam blocker experiment in our previous publications.15, 18, 29 With these parameters, we successfully suppress the discrepancy in the difference image due to misregistered low-contrast objects. Note that the performance of the proposed algorithm is not sensitive to the parameters of low-pass filters when the filter width is in a large range (e.g., from 51 to 111 pixels).
The proposed method is evaluated on four prostate patients. The first patient had very few gas pockets inside the pelvis area. The most attenuating parts of the patient couch (e.g., metal frame) happened not to be inside the projection field during the CBCT scan. We found that the corrected CBCT image had a good quality even if the correction was carried out with no iterations and no gas pocket and couch matching. The correction of the second patient image was more challenging due to the large volume of gas pockets and attenuating metal frame of the couch. All the optional components were turned on in the proposed correction to further reduce any potential correction errors. With the established framework, we then proceeded with the study on two more patients to test the stability of the proposed approach.
We used mean CT number values, spatial nonuniformity (SNU) and image contrasts in selected regions of interest (ROIs) on the reconstructed images as image quality metrics. The registered pCT image used in our correction was considered as the ground truth in the comparisons.
Low-frequency errors in the projection data, mostly scatter signals, cause nonuniformity in the reconstructed image. We measured the SNU using a similar definition as in the literature30
| (3) |
Different ROIs were selected in the CBCT image at both the center and the periphery. and in Eq. 3 are the maximum and the minimum of the mean CT number values of these ROIs, respectively. Note that the true SNU may not be zero. Therefore, the image quality was quantified by the SNU error, which is defined as the difference of SNUs on the CBCT and the ground truth.
Scatter-induced artifacts cause image contrast loss. The image contrast was calculated as
| (4) |
where is the mean reconstructed value inside the ROI and is the mean reconstructed value in the surrounding area.
RESULTS
First patient study
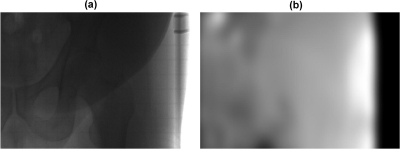
This patient has a large size, which results in high scatter signals in the cone-beam projections.31, 32 The calculated scatter-to-primary ratio (SPR) around the patient center varies from about 1.5 in the AP views to about 4.5 in the lateral views based on the estimated scatter signals using our method. An example of a raw CBCT projection without correction and the estimated low-frequency errors is shown in Fig. 3.
Figure 3.
Raw cone-beam projection and the corresponding estimate of low-frequency errors using the proposed method. (a) cone-beam projection without correction and (b) estimated low-frequency errors (mainly scatter). The display windows are set to be (in detector units) (a) [0 2500] and (b) [0 300].
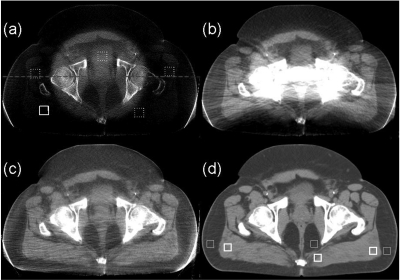
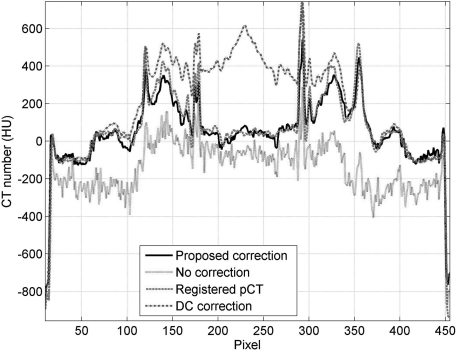
Figure 4 shows the axial views of the registered pCT image and the CBCT images without correction, with uniform scatter correction, and with the proposed correction. Figure 5 compares the 1D profiles passing through the central horizontal line indicated in Fig. 4a. Large errors in CBCT projections result in severe shading artifacts up to 338 HU, as shown in Fig. 4a. Though scatter is dominantly low frequency, its distribution still contains relatively high-frequency components and cannot be estimated as a constant. The challenges of scatter correction are well seen in the corrected image by assuming uniform and constant scatter across the projection field [Fig. 4b]. The scatter constant is estimated by averaging the scatter signals inside the patient obtained in our proposed framework. The uniform correction works well in the peripheral soft-tissue region of the reconstructed image. Nevertheless, severe streaking and shading artifacts have been observed around the central bony structures and the proximity of the patient back. Using pCT image as the ground truth, the SNU error calculated from the five ROIs as indicated in Fig. 4a is decreased to 11.9%, a slight reduction from 25.9% in the image with no correction. Note that our selection of ROIs has avoided the area of strong streaking artifacts.
Figure 4.
Axial images of the first prostate patient. Display window: [−300 200] HU. (a) CBCT without correction; (b) CBCT with uniform scatter correction; (c) CBCT with the proposed correction; and (d) registered pCT. In the selected uniform soft-tissue ROI [marked with a solid white square in (a)], the average CT numbers from (a) to (d) are −300, −10, 22, and 38 HU, respectively. The SNUs calculated on the selected five ROIs [marked with solid and dashed white squares in (a)] from (a) to (d) are 27%, 13%, 2.7%, and 1.1%, respectively. The dashed line in (a) indicates where the 1D profiles in Fig. 5 are taken. The thick and thin white square pairs in (d) indicate where the contrasts in Table TABLE I. are calculated.
Figure 5.
Comparison of 1D profiles taken at the central horizontal line indicated in Fig. 4a.
Our approach achieves a superior image quality, as shown in Fig. 4c. The deformable registration obtains good geometry match on this patient. No iterations and no gas pocket and couch matching are implemented in this patient case. The proposed method not only reduces the mean CT number error to 16 HU in the solid white square as indicated in Fig. 4a but also further decreases the SNU error to 1.6%. Besides the improvement of image uniformity, our method is also effective on increasing soft-tissue contrast. The contrasts for the pCT image and the CBCT images without and with correction are summarized in Table TABLE I.. The selected ROIs for the calculation are indicated in Fig. 4d. With the proposed correction, the CBCT image contrast becomes comparable to that of the pCT image, with an average increase factor of about 2.3. The streaking artifacts around the left and right edges of the patient body are caused by truncation errors in the projection data (i.e., the detector is not large enough to cover the whole patient) instead of residual scatter, due to the large volume of this patient. We may further suppress these errors by conventional truncation correction on the projections.33 Note that some other streak artifacts are present in the images, especially around and between bones, possibly due to residual scatter or increased noise level after scatter correction. These artifacts could be suppressed by more advanced reconstruction algorithms, such as iterative reconstruction with total-variation regularization.34
TABLE I.
Comparison of the image contrasts measured on the selected ROI pairs marked in Fig. 4d. All units are in HU.
| No correction | Proposed correction | pCT | |
|---|---|---|---|
| Left pair | 44 | 125 | 110 |
| Middle pair | 44 | 67 | 84 |
| Right pair | 40 | 95 | 90 |
| Mean | 42 | 96 | 95 |
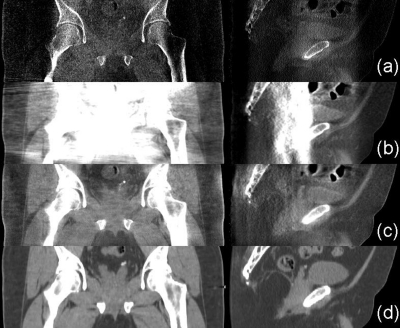
The improved image quality can also be observed in the comparisons of 1D profiles (Fig. 5), sagittal and coronal views (Fig. 6). It is worth noting that our method faithfully maintains the anatomical structures in the CBCT image. On the same patient, the pCT and the CBCT images show quite different anatomical structures. Although our correction is based on pCT images, the algorithm does not carry over the anatomical details from the pCT image to the CBCT image. For example, the gas pocket (about 0.8 cm3), which does not exist in the pCT image [Fig. 6d], is retained in the corrected image [Fig 6c].
Figure 6.
Coronal (left) and sagittal views (right) of the reconstructed prostate patient. Display window: [−300 200] HU. Row (a) no correction; (b) with uniform correction; (c) with the proposed correction; and (d) registered pCT.
Second patient study
This patient has lower scatter signals due to a relatively smaller volume size. The calculated SPR around the patient center varies from about 1.6 in the AP views to about 3.0 in the lateral views based on the estimated scatter signals using our method. Nevertheless, large geometry changes are observed on the pCT and CBCT images, which lead to errors in our correction if the scatter correction scheme without iterations is used. For example, the CBCT image has a rectum gas pocket with a volume of several cubic centimeters, which is not seen in the pCT image. Besides the anatomical change, the CBCT image includes two metal bars of the couch, which cause primary estimation errors in our algorithm and potentially degrade the image quality inside the patient.
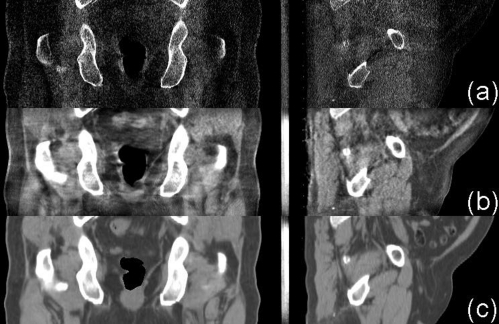
To tackle the challenges, we apply the general correction method with all the components enabled, including iterations, and the step of gas pockets and couch matching. Fig. 7c shows the pCT image used in our correction after the gas pocket and couch matching. After five iterations, we obtain a high-quality CBCT image as shown in Fig. 7b. Severe shading artifacts in the uncorrected image [Fig. 7a] have been greatly suppressed. The mean CT number error is reduced from 277 to 12 HU in the solid white square as indicated in Fig. 7a, and the SNU error is decreased from 14.1% to 0.9%. Similar to the first patient study, our method is also effective on increasing soft-tissue contrast. The average contrasts for the pCT image and the CBCT image without and with correction are summarized in Table TABLE II. together with the results on the other three patients. Three ROI pairs shown in Fig. 7c are used in the calculation. The proposed correction improves the image contrast by an average factor of about 2.9 to a value comparable to that in the pCT image. The superior performance of our method is also demonstrated in the sagittal and coronal views of the reconstructed image (Fig. 8). Note that gas pockets may not have sharp edges. The gas pocket matching step as discussed in detail in Sec. 2 is based on a single thresholding technique. Therefore, it cannot achieve precise geometry match between the CBCT and the pCT images, which results in residual streaking artifacts around the gas pockets due to scatter estimation errors. These artifacts can be further suppressed by creating the gas pocket in the pCT with the intensity distribution of CBCT in the whole gas pocket region, instead of setting a single value.
Figure 7.
Axial images of the second prostate patient. Display window is [−300 200] HU. (a) CBCT without correction; (b) CBCT with the proposed correction after five iterations; and (c) registered pCT with matched gas pocket and couch. In the selected uniform soft-tissue ROI [marked with a solid white square in (a)], the average CT numbers from (a) to (c) are −236, 53, and 41 HU, respectively. The SNUs calculated on the selected five ROIs [marked with solid and dashed white squares in (a)] from (a) to (c) are 16%, 2.8%, and 1.9%, respectively. The thick and thin white square pairs in (c) indicate where the average contrasts in Table TABLE II. are calculated.
TABLE II.
Comparison of the CT numbers, SNUs and image contrasts of the four patients, measured on the similar selected ROIs shown in Figs. 47. Here, “SC” stands for “the proposed shading correction.”
| 1 | 2 | 3 | 4 | |||||||||
|---|---|---|---|---|---|---|---|---|---|---|---|---|
| Patient # | No SC | SC | pCT | No SC | SC | pCT | No SC | SC | pCT | No SC | SC | pCT |
| CT # (HU) | −300 | 22 | 38 | −236 | 53 | 41 | −215 | 59 | 51 | −247 | 65 | 60 |
| Contrast (HU) | 42 | 96 | 95 | 48 | 140 | 138 | 60 | 134 | 128 | 42 | 121 | 129 |
| SNU(%) | 27 | 2.7 | 1.1 | 16 | 2.8 | 1.9 | 17.6 | 4.6 | 3.4 | 23.9 | 4.3 | 3.4 |
Figure 8.
Coronal (left) and sagittal views (right) of the reconstructed prostate patient. Display window: [−300 200] HU. Row (a) no correction; (b) with the proposed correction after the fifth iteration; and (c) registered pCT with gas pocket and couch matching.
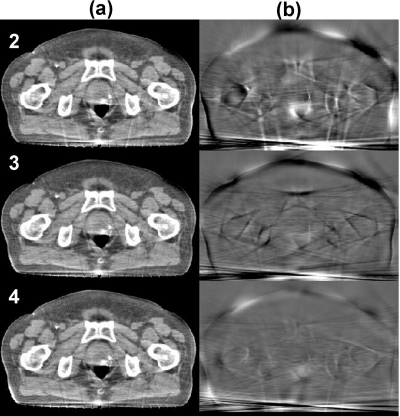
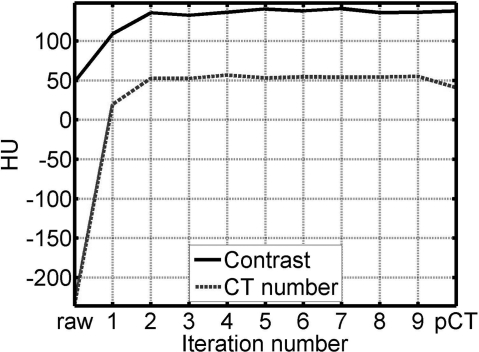
The quality of the corrected CBCT image improves as the deformable registration becomes more accurate after the CBCT image to be registered is updated in each iteration. The left column of Fig. 9 [Fig. 9a] shows the corrected images in different iterations, and the right column [Fig. 9b] shows the corresponding difference images compared to the image obtained in the fifth iteration [Fig. 7b]. The corrected image converges as the iteration proceeds. In order to demonstrate the convergence of the iterative scheme, we repeat the iteration process for several more times (a total of nine in this study) and plot the CT number and contrast in Fig. 10. Note that the image of the first iteration is generated using the proposed correction with the pCT registered to a first-pass uncorrected CBCT image, i.e., the correction scheme shown in Fig. 2. It is seen that the most significant image improvement occurs in the second iteration when we update the CBCT in the deformable registration step and include gas pocket and couch matching. Both the image metrics (CT number and contrast) reach the stable values after the first two or three iterations, indicating that only a few iterations are needed for acceptable correction performance.
Figure 9.
Effects of iterations in the proposed correction on the image quality. Display window: (a) [−300 200] HU and (b) [−80 120] HU. Column (a) corrected CBCT at different iterations (the iteration numbers are labeled at the upper-left corner) and (b) corresponding difference compared to the fifth iteration [Fig. 7b].
Figure 10.
Demonstration of the convergence of the iterative scheme using the 2nd patient study as an example. The values of CT number and contrast are taken in the same ROIs indicated in Fig. 7. The numbers of the horizontal axis indicate the image of each iteration, in which the image of the first iteration is generated using the proposed correction with the pCT registered to a first-pass uncorrected CBCT image, i.e., the correction scheme shown in Fig. 2. The term “raw” means the CBCT image without correction.
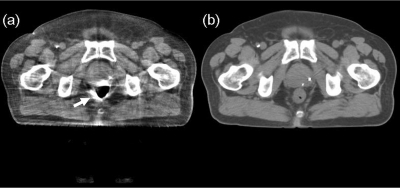
To investigate the image improvements from the gas pocket and couch matching as well as the iterative scheme, we show in Fig. 11 the CBCT image after the 1st iteration, using a correction scheme the same as in the first patient study. In the corrected image, streaking artifacts are very severe around the periphery of the gas pocket [see Fig. 11a]. The shading artifacts around the metal bars, however, lead to small artifacts inside the patient. One reason is that the bars are outside of the patient and the artifacts diminish quickly toward inside. Another possible reason is that the thin metal bars cause relatively small scatter estimation errors due to the large SPR of the pelvis volume.
Figure 11.
Effects of the optional steps in the proposed correction (i.e. iterations, gas pocket, and couch matching) on the image quality. (a) CBCT image of the 1st iteration, without the optional steps. The arrow points to the severe streaking artifacts due to mismatched gas pocket and (b) registered pCT without gas pocket and couch matching. In the same ROIs indicated in Fig. 7a), the average CT number is 19 HU, and the SNU is 4.7%.
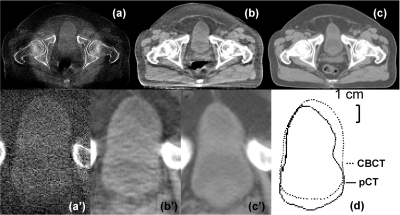
Our previous study as well as the first patient results has shown that the proposed algorithm suppresses small high-frequency errors stemming from the mismatched low-contrast objects in the pCT and the CBCT images.15 To further support our argument, we study the bladder region of patient images, where the deformable registration error is large (around 1 cm) due to its different filling status as shown in Fig. 12d. Our approach still preserves the contour of bladder in CBCT image well without carrying over the information from the pCT image [compare Figs. 12b1, 12c1]. The error of average CT number inside the bladder is reduced from 87 HU with no correction to 11 HU, and the object contrast has been increased by a factor of 1.6.
Figure 12.
CBCT and registered pCT images of the bladder region. (a) CBCT without correction; (b) CBCT after the proposed correction; and (c) pCT after deformable registration. (a’)–(c’) enlarged views of bladder corresponding to (a)–(c). (d) comparison of the bladder contours of CBCT and registered pCT. The average CT numbers inside the bladder from (a) to (c) are −73, 3, and 14 HU, respectively. The contrasts are 69, 112, and 122 HU, respectively. Display window: [−300 200] HU.
Overall performance of four patient studies
To test the stability of the proposed framework, we proceed with two more patient studies using the proposed shading correction and similar ROIs for image quality evaluation as those in the previous studies. On average, the overall CT number error is reduced from 300 HU to less than 16 HU, and the SNU error is decreased from 18.7% to within 1.6 %. The image contrast is increased by a factor of 2–3. The image improvements of the four patient studies are summarized in Table TABLE II..
DISCUSSION
Using pCT images as prior information, we previously developed a preliminary correction method for CBCT images. The algorithm works well on phantoms. To further improve the method performance in the presence of large patient deformation from the planning to the treatment room, in this paper, we propose a general framework of pCT-based CBCT correction for clinical applications. The method requires no modifications of hardware or imaging protocols on current radiation therapy machines, and can be used as a “plug-and-play” component attachable to the existing image processing chain. CBCT images contain artifacts due to different sources, of which scatter is dominant. Our algorithm aims to suppress low-frequency errors in CBCT projections (mainly scatter signals). Correction for other artifacts, including errors stemming from organ motion and metal implants, is considered beyond the scope of this paper. Existing algorithms can be implemented together with the proposed method to enhance the CBCT image quality.35, 36
Our CBCT correction does not totally rely on the pCT image for providing the patient geometrical details at treatment time. Only low-frequency projection errors are generated in the proposed correction. The method can therefore tolerate small registration errors in the pCT images. Anatomical information is not carried over from the pCT to the CBCT image, an important feature which makes our method distinct from other prior image based correction methods.37, 38
The geometry mismatch makes the registration errors large and severely degrades the image quality. As seen in the previous Sec. 2 , the resultant artifacts are mainly around the unmatched objects. The gas pocket matching step in our algorithm effectively suppresses these artifacts inside the patient. The objects outside the patient (e.g., patient couch) cause relatively smaller artifacts. However, the errors from these objects may become relatively more significant when the scatter artifacts in the uncorrected image are small (e.g., head imaging). We will study more disease sites and fully evaluate the performance of our algorithm.
In the current studies, most of the algorithm steps are implemented in MATLAB and the calculation speed is not optimized. We will improve the computational efficiency by converting MATLAB code into more efficient languages (e.g., C). Several computationally expensive steps in our algorithm, including forward projection and FDK reconstruction, have a structure compatible with parallel computation. We will further speed up our algorithm using GPU based techniques. After coding optimization and hardware acceleration, the computation speed of our algorithm is expected to be improved by a factor of over 100.34
Due to the limited registration accuracy, pCT may not the best ground truth for comparison purposes. A more appropriate ground truth should be a fan-beam scan right after the routine cone-beam scan,15, 29 where a narrowly opened collimator (e.g., a width of ∼10 mm on the detector) is used to inherently suppress scatter. Such a ground truth acquisition changes the scanning protocol in hospital and introduces an extra exposure to the patient, though not significantly. We will acquire the fan-beam data as the ground truth in the future patient studies for a more comprehensive evaluation of our method.
Despite promising results on four prostate patients, more studies are needed to fully evaluate the stability of our method. Many of the algorithm parameters, such as the thresholds in the gas pocket and couch matching and the total iteration number, are empirically chosen in the current implementations. These parameters will be further optimized based on more patient data. We will also investigate the algorithm performance on other imaging regions besides prostate (e.g., head), and suggest corresponding parameters.
CONCLUSIONS
A pCT-based correction algorithm was previously developed in our group for high-quality CBCT imaging. In this paper, we further improve the method for clinical use. Quantitative CBCT images have been obtained on four patient studies. The proposed correction reduces the overall CBCT error from over 300 HU to below 16 HU in the selected ROIs, and the SNU error from over 18% to below 2%. With improved CBCT accuracy, our approach significantly promotes the performance of advanced CBCT-based clinical applications for IGRT.
ACKNOWLEDGMENTS
This work is supported by Georgia Institute of Technology new faculty startup funding and the NIH under the Grant No. 1R21EB012700-01A1. The authors would like to thank Dr. Xun Jia (Center for Advanced Radiotherapy Technologies and Department of Radiation Oncology, University of California San Diego, La Jolla, CA) and Dr. Yifei Lou (School of Electrical and Computer Engineering, Georgia Institute of Technology, Atlanta, GA) for insightful discussion on image registration. They would also like to thank the anonymous reviewers for their constructive suggestions which substantially strengthen the paper.
References
- Altorjai G., Fotina I., Lutgendorf-Caucig C., Stock M., Potter R., Georg D., and Dieckmann K., “Cone-beam CT-based delineation of stereotactic lung targets: The influence of image modality and target size on interobserver variability,” Int. J. Radiat. Oncol., Biol., Phys. 82(2), e265–e272 (2012) 10.1016/j.ijrobp.2011.03.042. [DOI] [PubMed]
- Lutgendorf-Caucig C., Fotina I., Stock M., Potter R., Goldner G., and Georg D., “Feasibility of CBCT-based target and normal structure delineation in prostate cancer radiotherapy: Multi-observer and image multi-modality study,” Radiother. Oncol. 98(2), 154–161 (2011). 10.1016/j.radonc.2010.11.016 [DOI] [PubMed]
- Yang Y., Schreibmann E., Li T. F., Wang C., and Xing L., “Evaluation of on-board kV cone beam CT (CBCT)-based dose calculation,” Phys. Med. Biol. 52(3), 685–705 (2007). 10.1088/0031-9155/52/3/011 [DOI] [PubMed]
- Yoo S. and Yin F. F., “Dosimetric feasibility of cone-beam CT-based treatment planning compared to CT-based treatment planning,” Int. J. Radiat. Oncol. 66(5), 1553–1561 (2006). 10.1016/j.ijrobp.2006.08.031 [DOI] [PubMed]
- Lo T., Yang Y., Schreibniann E., Li T., and Xing L., “Mapping electron density distribution from planning CT to cone-beam CT (CBCT): A novel strategy for accurate dose calculation based on CBCT,” Int. J. Radiat. Oncol. 63(2), S507–S507 (2005). 10.1016/j.ijrobp.2005.07.861 [DOI]
- Islam M. K., Purdie T. G., Norrlinger B. D., Alasti H., Moseley D. J., Sharpe M. B., Siewerdsen J. H., and Jaffray D. A., “Patient dose from kilovoltage cone beam computed tomography imaging in radiation therapy,” Med. Phys. 33(6), 1573–1582 (2006). 10.1118/1.2198169 [DOI] [PubMed]
- Ghilezan M., Yan D., Liang J., Jaffray D., Wong J., and Martinez A., “Online image-guided intensity-modulated radiotherapy for prostate cancer: How much improvement can we expect? A theoretical assessment of clinical benefits and potential dose escalation by improving precision and accuracy of radiation delivery,” Int. J. Radiat. Oncol., Biol., Phys. 60(5), 1602–1610 (2004). 10.1016/j.ijrobp.2004.07.709 [DOI] [PubMed]
- Nijkamp J., Pos F. J., Nuver T. T., De Jong R., Remeijer P., Sonke J. J., and Lebesque J. V., “Adaptive radiotherapy for prostate cancer using kilovoltage cone-beam computed tomography: First clinical results,” Int. J. Radiat. Oncol. 70(1), 75–82 (2008). 10.1016/j.ijrobp.2007.05.046 [DOI] [PubMed]
- Ding G. X., Duggan D. M., Coffey C. W., Deeley M., Hallahan D. E., Cmelak A., and Malcolm A., “A study on adaptive IMRT treatment planning using kV cone-beam CT,” Radiother. Oncol. 85(1), 116–125 (2007). 10.1016/j.radonc.2007.06.015 [DOI] [PubMed]
- Maltz J. S., Gangadharan B., Bose S., Hristov D. H., Faddegon B. A., Paidi A., and Bani-Hashemi A. R., “Algorithm for x-ray scatter, beam-hardening, and beam profile correction in diagnostic (kilovoltage) and treatment (megavoltage) cone beam CT,” IEEE Trans. Med. Imaging. 27(12), 1791–1810 (2008). 10.1109/TMI.2008.928922 [DOI] [PubMed]
- Kyriakou Y., Riedel T., and Kalender W. A., “Combining deterministic and Monte Carlo calculations for fast estimation of scatter intensities in CT,” Phys. Med. Biol. 51(18), 4567–4586 (2006). 10.1088/0031-9155/51/18/008 [DOI] [PubMed]
- Niu T. Y. and Zhu L., “Overview of x-ray scatter in cone-beam computed tomography and its correction methods,” Curr. Med. Imaging Rev. 6(2), 82–89 (2010). 10.2174/157340510791268515 [DOI]
- Zhu L., Xie Y. Q., Wang J., and Xing L., “Scatter correction for cone-beam CT in radiation therapy,” Med. Phys. 36(6), 2258–2268 (2009). 10.1118/1.3130047 [DOI] [PMC free article] [PubMed]
- Gao H., Fahrig R., Bennett N. R., Sun M., Star-Lack J., and Zhu L., “Scatter correction method for x-ray CT using primary modulation: Phantom studies,” Med. Phys. 37(2), 934–946 (2010). 10.1118/1.3298014 [DOI] [PMC free article] [PubMed]
- Niu T. Y., Sun M. S., Star-Lack J., Gao H. W., Fan Q. Y., and Zhu L., “Shading correction for on-board cone-beam CT in radiation therapy using planning MDCT images,” Med. Phys. 37(10), 5395–5406 (2010). 10.1118/1.3483260 [DOI] [PubMed]
- Hsieh J., Computed Tomography Principles, Design, Artifacts, and Recent Advances, 2nd ed. (SPIE, Washington and John Wiley & Sons, Inc., New Jersey, 2009), p. 207.
- Kyriakou Y., Meyer M., and Kalender W. A., “Technical note: Comparing coherent and incoherent scatter effects for cone-beam CT,” Phys. Med. Biol. 53(10), N175–N185 (2008). 10.1088/0031-9155/53/10/N02 [DOI] [PubMed]
- Niu T. and Zhu L., “Single-scan scatter correction for cone-beam CT using a stationary beam blocker: A preliminary study,” Proc. SPIE 7961, 261–269 (2011). 10.1117/12.878387 [DOI]
- Boone J. M., Arnold B. A., and Seibert J. A., “Characterization of the point spread function and modulation transfer-function of scattered radiation using a digital imaging-system,” Med. Phys. 13(2), 254–256 (1986). 10.1118/1.595906 [DOI] [PubMed]
- Zhu L., Bennett N. R., and Fahrig R., “Scatter correction method for x-ray CT using primary modulation: Theory and preliminary results,” IEEE Trans. Med. Imaging 25(12), 1573–1587 (2006). 10.1109/TMI.2006.884636 [DOI] [PubMed]
- Yang D. S., Chaudhari S. R., Goddu S. M., Pratt D., Khullar D., Deasy J. O., and El Naqa I., “Deformable registration of abdominal kilovoltage treatment planning CT and tomotherapy daily megavoltage CT for treatment adaptation,” Med. Phys. 36(2), 329–338 (2009). 10.1118/1.3049594 [DOI] [PMC free article] [PubMed]
- Dong L., Gao S., Zhang L. F., Wang H., de Crevoisier R., Kuban D. D., and Mohan R., “A deformable image registration method to handle distended rectums in prostate cancer radiotherapy,” Med. Phys. 33(9), 3304–3312 (2006). 10.1118/1.2222077 [DOI] [PubMed]
- Feldkamp L. A., Davis L. C., and Kress J. W., “Practical cone-beam algorithm,” J. Opt. Soc. Am. A 1(6), 612–619 (1984). 10.1364/JOSAA.1.000612 [DOI]
- ”Photon, electron, proton and neutron interaction data for body tissues,” ICRU-Report No. 46 (International Commission on Radiation Units and Measurements, 1992).
- Zhu L., Wang J., and Xing L., “Noise suppression in scatter correction for cone-beam CT,” Med. Phys. 36(3), 741–752 (2009). 10.1118/1.3063001 [DOI] [PMC free article] [PubMed]
- Maes F., Collignon A., Vandermeulen D., Marchal G., and Suetens P., “Multimodality image registration by maximization of mutual information,” IEEE Trans. Med. Imaging 16(2), 187–198 (1997). 10.1109/42.563664 [DOI] [PubMed]
- Gu X. J., Pan H., Liang Y., Castillo R., Yang D. S., Choi D. J., Castillo E., Majumdar A., Guerrero T., and Jiang S. B., “Implementation and evaluation of various demons deformable image registration algorithms on a GPU,” Phys. Med. Biol. 55(1), 207–219 (2010). 10.1088/0031-9155/55/1/012 [DOI] [PMC free article] [PubMed]
- Zhong H. L., Peters T., and Siebers J. V., “FEM-based evaluation of deformable image registration for radiation therapy,” Phys. Med. Biol. 52(16), 4721–4738 (2007). 10.1088/0031-9155/52/16/001 [DOI] [PubMed]
- Niu T. Y. and Zhu L., “Scatter correction for full-fan volumetric CT using a stationary beam blocker in a single full scan,” Med. Phys. 38(11), 6027–6038 (2011). 10.1118/1.3651619 [DOI] [PMC free article] [PubMed]
- Mail N., Moseley D. J., Siewerdsen J. H., and Jaffray D. A., “The influence of bowtie filtration on cone-beam CT image quality,” Med. Phys. 36(1), 22–32 (2009). 10.1118/1.3017470 [DOI] [PubMed]
- Siewerdsen J. H. and Jaffray D. A., “Cone-beam computed tomography with a flat-panel imager: Magnitude and effects of x-ray scatter,” Med Phys. 28(2), 220–231 (2001). 10.1118/1.1339879 [DOI] [PubMed]
- Siewerdsen J. H., Daly M. J., Bakhtiar B., Moseley D. J., Richard S., Keller H., and Jaffray D. A., “A simple, direct method for x-ray scatter estimation and correction in digital radiography and cone-beam CT,” Med. Phys. 33(1), 187–197 (2006). 10.1118/1.2148916 [DOI] [PubMed]
- Ohnesorge B., Flohr T., Schwarz K., Heiken J. P., and Bae K. T., “Efficient correction for CT image artifacts caused by objects extending outside the scan field of view,” Med. Phys. 27(1), 39–46 (2000). 10.1118/1.598855 [DOI] [PubMed]
- Jia X., Lou Y. F., Li R. J., Song W. Y., and Jiang S. B., “GPU-based fast cone beam CT reconstruction from undersampled and noisy projection data via total variation,” Med. Phys. 37(4), 1757–1760 (2010). 10.1118/1.3371691 [DOI] [PubMed]
- Zhang Y. B., Zhang L. F., Zhu R., Lee A. K., Chambers M., and Dong L., “Reducing metal artifacts in cone-beam CT images by preprocessing projection data,” Int. J. Radiat. Oncol. 67(3), 924–932 (2006). 10.1016/j.ijrobp.2006.09.045 [DOI] [PubMed]
- Li R. J., Lewis J. H., Jia X., Zhao T. Y., Liu W. F., Wuenschel S., Lamb J., Yang D. S., Low D. A., and Jiang S. B., “On a PCA-based lung motion model,” Phys. Med. Biol. 56(18), 6009–6030 (2011). 10.1088/0031-9155/56/18/015 [DOI] [PMC free article] [PubMed]
- Marchant T. E., Moore C. J., Rowbottom C. G., MacKay R. I., and Williams P. C., “Shading correction algorithm for improvement of cone-beam CT images in radiotherapy,” Phys. Med. Biol. 53(20), 5719–5733 (2008). 10.1088/0031-9155/53/20/010 [DOI] [PubMed]
- Brunner S., Nett B. E., Tolakanahalli R., and Chen G. H., “Prior image constrained scatter correction in cone-beam computed tomography image-guided radiation therapy,” Phys. Med. Biol. 56(4), 1015–1030 (2011). 10.1088/0031-9155/56/4/009 [DOI] [PMC free article] [PubMed]
- www.slicer.org


