Abstract
Purpose: The purpose of this study is to investigate the feasibility of increasing the system spatial resolution and scanning speed of Hologic Selenia Dimensions digital breast tomosynthesis (DBT) scanner by replacing the rotating mammography x-ray tube with a specially designed carbon nanotube (CNT) x-ray source array, which generates all the projection images needed for tomosynthesis reconstruction by electronically activating individual x-ray sources without any mechanical motion. The stationary digital breast tomosynthesis (s-DBT) design aims to (i) increase the system spatial resolution by eliminating image blurring due to x-ray tube motion and (ii) reduce the scanning time. Low spatial resolution and long scanning time are the two main technical limitations of current DBT technology.
Methods: A CNT x-ray source array was designed and evaluated against a set of targeted system performance parameters. Simulations were performed to determine the maximum anode heat load at the desired focal spot size and to design the electron focusing optics. Field emission current from CNT cathode was measured for an extended period of time to determine the stable life time of CNT cathode for an expected clinical operation scenario. The source array was manufactured, tested, and integrated with a Selenia scanner. An electronic control unit was developed to interface the source array with the detection system and to scan and regulate x-ray beams. The performance of the s-DBT system was evaluated using physical phantoms.
Results: The spatially distributed CNT x-ray source array comprised 31 individually addressable x-ray sources covering a 30 angular span with 1 pitch and an isotropic focal spot size of 0.6 mm at full width at half-maximum. Stable operation at 28 kV(peak) anode voltage and 38 mA tube current was demonstrated with extended lifetime and good source-to-source consistency. For the standard imaging protocol of 15 views over 14, 100 mAs dose, and 2 × 2 detector binning, the projection resolution along the scanning direction increased from 4.0 cycles/mm [at 10% modulation-transfer-function (MTF)] in DBT to 5.1 cycles/mm in s-DBT at magnification factor of 1.08. The improvement is more pronounced for faster scanning speeds, wider angular coverage, and smaller detector pixel sizes. The scanning speed depends on the detector, the number of views, and the imaging dose. With 240 ms detector readout time, the s-DBT system scanning time is 6.3 s for a 15-view, 100 mAs scan regardless of the angular coverage. The scanning speed can be reduced to less than 4 s when detectors become faster. Initial phantom studies showed good quality reconstructed images.
Conclusions: A prototype s-DBT scanner has been developed and evaluated by retrofitting the Selenia rotating gantry DBT scanner with a spatially distributed CNT x-ray source array. Preliminary results show that it improves system spatial resolution substantially by eliminating image blur due to x-ray focal spot motion. The scanner speed of s-DBT system is independent of angular coverage and can be increased with faster detector without image degration. The accelerated lifetime measurement demonstrated the long term stability of CNT x-ray source array with typical clinical operation lifetime over 3 years.
Keywords: breast cancer, digital breast tomosynthesis, carbon nanotube x-ray, s-DBT
INTRODUCTION
Breast cancer is the most common type of cancer occurring in women. Early detection is considered the best hope for decreasing the mortality rate from breast cancer.1, 2, 3, 4 Mammography, the current gold standard for early screening, has played an important role in reducing the mortality rate in the last decade.5, 6 However, it has well documented limitations including high false positive and false negative rates.7, 8 Digital breast tomosynthesis (DBT), a limited angle computed tomography technique, has shown significant promises in addressing these limitations.9, 10 In DBT, multiple projection images are acquired at different viewing angles and reconstructed into a 3D dataset, which can be viewed in thin slices with high in-plane resolution without suffering from tissue overlap. It has the potential to improve the effectiveness of early breast cancer screening at a similar dose and cost to full-field digital mammography (FFDM).11 The first commercial DBT scanner received FDA approval in early 2011. Several other DBT systems from different vendors are currently under clinical trials.12, 13, 14, 15, 16
There are, however, two important limitations of the current DBT technology: low spatial resolution and a comparably long scanning time with respect to FFDM. Both result from the limitations of the conventional x-ray tube technology where x-ray radiation is generated from a single focal spot and the flux is constrained by the anode heat load. To generate the projection images needed for reconstruction, a standard mammography tube is mounted on a rotating gantry and moves along an arc above the partially compressed breast over a certain angular range. The scanning speed and spatial resolution are interconnected, depending on factors including the total imaging dose, the power of the x-ray tube, the angular coverage, and the number of views.13, 17 Current DBT systems are grouped into two types. In the step-and-shoot mode (such as GE system), the source needs to come to a complete stop at each position before x-ray exposure. The mechanical instability induced by acceleration and deceleration of the source limits the speed by which the tube can be moved from view to view.18 In the continuous motion mode (such as Hologic system), the x-ray tube moves continuously through the arc during the scan. The higher the scanning speed, the larger the distance the x-ray tube travels during the finite x-ray exposure time window and the larger the x-ray focal spot blurring.19, 20 The amount of focal spot blur that can be tolerated limits the scanning speed and the angular coverage.
Image blurring due to both source and patient motion is a major factor that degrades the spatial resolution of DBT and its sensitivity for small microcalcifications (MC) compared to FFDM.10 Although results from phantoms21, 22 and clinical tests23 have shown a higher sensitivity for masses compared to mammography, DBT by itself is often inferior to diagnostic mammography in characterization of MC,17 which is critical for diagnosis of cancer.24, 25, 26 The Hologic Selenia Dimensions DBT scanner was recently approved by the FDA (Ref. 27) to operate in the combo mode requiring acquisition of both 2D mammography and 3D tomosynthesis images for each patient to achieve good MC and mass detection. This, however, increases the total imaging dose.12
To address the limitations of the current DBT technology, we recently demonstrated the concept of stationary digital breast tomosynthesis (s-DBT) in a bench top system using a vacuum chamber based CNT x-ray source array.28 Instead of mechanically moving a single x-ray tube to the multiple viewing angles, s-DBT employs a stationary x-ray source array, which generates x-ray beams from different viewing angles by electronically activating the individual sources (beams) prepositioned at the corresponding viewing angles without mechanical moving the x-ray tube, therefore eliminating the focal spot motion blurring.29, 30 The scanning speed is determined only by the x-ray tube flux (which determines the exposure time per view) and the detector readout time and is independent of angular coverage. Here, we report our recent progress in this technology development. In particular, we investigated the feasibility of improving the spatial resolution of the Hologic Selenia Dimensions DBT scanner by replacing the standard mammography x-ray tube with a specially designed distributed CNT source array. The aim is to increase the detection sensitivity of tomosynthesis for MCs and potentially eliminate the need for additional 2D mammographic imaging. We evaluated the scanning time at the targeted spatial resolution for a given set of detector readout times. The lifetime and consistency of the CNT x-ray source array were also tested.
METHODS
A CNT x-ray source array was designed to have similar imaging configuration to Hologic Selenia Dimensions scanner except the sources are arranged in a straight line parallel to the detector plane rather than in an arc.12 Finite element analysis was performed to determine the maximum x-ray tube current for the targeted focal spot size and power. Electron beam optics simulations were carried out to optimize the electron focusing optics to achieve the desired focal spot size. Long term stability and consistency of the CNT cathodes were evaluated. A control electronics system was integrated to scan and regulate the imaging dose from each beam by compensating the driving voltages and by modulating the exposure time from each beam. The x-ray source array was mounted on the gantry of the Selenia Dimensions scanner replacing its original mammography tube and was electronically integrated with the detection unit. Preliminary system calibration was performed using phantoms.
Overall system configuration and x-ray source design
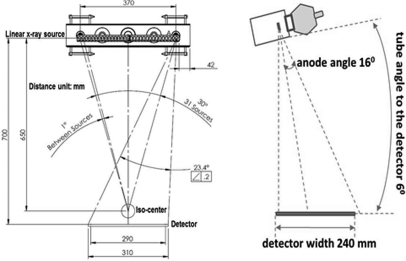
The CNT source array was designed to provide an imaging configuration similar to the rotating gantry Selenia Dimensions scanner in angular coverage, number of views, and source-detector distance, as shown in Table TABLE I.. It consists of 31 sources distributed in a linear array, inside an evacuated stainless steel housing with a 1 mm thick Al window serving as the vacuum barrier and energy filter. The corresponding 31 x-ray focal spots span a distance of 370 mm from end to end with equal angular spacing of 1°. The x-ray beams can be programed individually in any time sequence to allow various imaging configurations. The possible sequences include 15 views over 14° coverage, 31 views over 30° coverage, and 15 views over 28° coverage at the source-object-distance (SOD) of 650 mm. The x-ray anode is tilted 16° and the entire x-ray tube is rotated 6° as illustrated in Fig. 1. The x-ray beams are collimated using both internal (inside the tube housing) and external collimators to ensure that x-ray beam from each focal spot covers the whole flat panel detector. The collimation has a tolerance of 2% of the source-imaging-plane distance (SID) on three sides of the detector except the chest wall side, where the beam edge is collimated to within 5 mm away from the chest wall.31
TABLE I.
Specifications of the s-DBT system.
| No. views | Up to 31 |
|---|---|
| Angular range | Up to 30 |
| Detector FOV | 24 × 29 cm |
| Source-detector distance | 700 mm |
| Angular spacing between views | 1 |
| X-ray anode | W |
| Anode tilting angle | 16 |
| Tube rotation | 6 |
| X-ray window | 1 mm Al |
| Anode voltage | Up to 50 kV(peak) |
| Tube current | Up to 38 mA |
| Focal spot size (FWHM) | 0.6 × 0.61 |
Figure 1.
Geometry of the s-DBT system and the CNT x-ray source array (all dimensions are in millimeters).
Due to manufacturing and cost considerations, the 31 x-ray focal spots (sources) in the current design are arranged in a straight line parallel to the detector plane, rather than in an arc with equal distance to the isocenter. In this case, the SOD varies slightly from source to source in a simple cosine relation: SODi = SOD0/cos(i*θ*π/180°), where i (the source index) = 0, ±1, … ±15; θ (the equal angular spacing between the adjacent sources) = 1°; and SOD0 = 650 mm is the distance between the central source and the object center (chosen to be the isocenter of the rotating gantry DBT system). To obtain the same entrance dose on the object, the mAs value from each individual source can be adjusted electronically based on its SOD. Each x-ray anode focal spot is individually rotated such that it faces toward the center of the object center, which is 50 mm above the detector surface.
In the present design, the modified Einzel-type electrostatic lens described in our previous publications28, 32 was utilized. The gate electrode is grounded, and the gate-cathode extraction voltage needed to generate the tube current is about 1.4 kV. The effective anode kilovolt (peak) is the sum of the anode voltage and the gate-cathode voltage. For example, when anode voltage is set at 28 kV(peak), the effective anode voltage is 29.4 kV.
Anode heat load
About 99% of the electron energy of an x-ray tube, whether thermionic or field emission, is wasted as heat on the anode. The maximum operating power is limited by the temperature and heat load of the anode. A mammography x-ray tube typically operates at 100–200 mA tube current and ∼30 kV(peak) effective anode voltage. The peak power of 3–6 kW is distributed over the focal track on the rotating anode. In the present CNT x-ray source array design, a stationary W anode is used for each focal spot. This allows distribution of the heat load over a larger area. To determine the power limit, finite element simulations were carried out using the commercial package (ansys). The anode temperature was calculated by solving the heat equation:
where and k are the temperature dependent heat capacity and thermal conductivity, respectively, is the input power and is the output power due to blackbody radiation.33
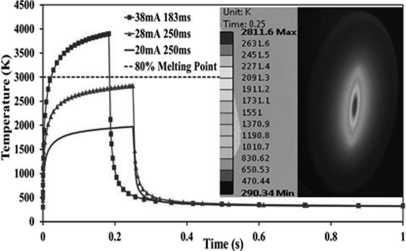
Thermal simulations were performed on a model structure for various power levels. The power was selected according to the expected operating conditions of the x-ray tube at up to 38 kV(peak) effective anode voltage and various tube currents and pulse widths. In the current configuration of the CNT tube, the energy of electrons reaching the anode target is the sum of the anode potential and the extraction voltage applied between the gate and the cathode. The maximum simulated effective anode voltage of 38 kV(peak) is higher than the most commonly used value for mammography [28 kV(peak)] and was chosen to take into consideration of imaging conditions for denser and thicker breasts. The electron penetration depth into the target is assumed to be constant over the voltage range simulated. The maximum stable tube current is determined by the heat load of the stationary anode. It depends on the energy, pulse width, and focal spot size. The combinations of 28 mA and 250 ms and 38 mA and 183 ms were selected for the anode heat load simulation because each of them provides the necessary dose for a projection view for an imaging protocol of 100 mAs per scan with 15 projection views. The temperature distribution on the whole anode structure was simulated for the targeted focal spot size. The power density was distributed on the anode as a Gaussian function with the measured FWHM of the focus spot size.32
CNT field emission electron source
Several factors considered in designing the CNT cathode include the targeted focal spot size, the demagnification factor of the electrostatic lens, the anode tilting angle, and the maximum stable emission current density of the CNT emitters. The aim of the present study is to have an isotropic focal spot size of ∼0.6 × 0.6 mm FWHM, which will provide a significant improvement in the spatial resolution along the scanning direction while maintaining a comparable value in the direction orthogonal to motion. The basic structure of each x-ray unit (source) consists of a CNT cathode, a gate electrode to extract electrons, an electron focusing lens, and an anode. To focus the field emitted electron beam, the modified Einzel-type electrostatic lens described in our previous publications28, 32 was utilized. The detailed dimension of the electrostatic lens was optimized using a commercial simulation package (OPERA-3D).34 The CNT cathodes were fabricated by electrophoretically depositing a composite film of preformed CNTs and inorganic binders on a metal substrate by heat treatment.35
The emission current from the CNT cathode was evaluated using anticipated operating conditions before the x-ray tube was manufactured with use of a vacuum chamber based test module housing three x-ray sources. The test module has a similar structure as the designed tube, with each source consisting of a CNT cathode, an extraction gate, a focusing lens, and a W anode. Accelerated lifetime measurements were performed under pulse modes with variable pulse widths and duty cycles. Each pulse corresponds to one x-ray exposure. Long term stability was tested for 250 and 183 ms pulses. During the measurement, the extraction electrical field was automatically adjusted to maintain a constant current.
X-ray focal spot size measurement
The effective focal spot sizes of the x-ray sources in the array were measured following the IEC standard36 using a gold-platinum pinhole phantom, which is 100 μm in diameter, 500 μm in length, and has a 12 opening angle. The electrical potentials applied to the two focusing electrodes in the Einzel lens were adjusted to obtain the minimum focal spot size. The same focusing voltages were used for all 31 sources. The measurement was performed at 35 kV(peak) anode voltage for all 31 sources.
System integration
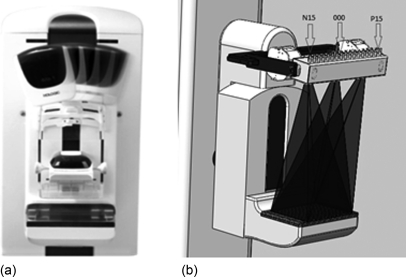
The CNT x-ray source array was mounted on the rotating gantry of the Selenia Dimensions scanner replacing its mammography x-ray tube, as illustrated in Fig. 2. A mounting bracket was designed to connect the source array with the gantry. It provides multiple degrees of translational and rotational freedom, adjusting the exact location and orientation of the source with respects to the detector plane. The x-ray source array was electronically interfaced with the Selenia detection unit, which sets the number of views, the detector integration time, and the detector readout time. The x-ray source exposure time for each view is controlled by the x-ray control unit (XCU). The XCU also controls the current and sequence of the x-ray beams. The pulse width was programed equal to the detector integration time. A TTL trigger signal from the Selenia detector unit to the XCU synchronizes the x-ray beam activation with the detector integration and readout. The XCU receives a separate trigger pulse from the detector unit for each exposure. During the scan sequence, the XCU regulates the extraction voltage for the CNT cathodes to provide the programed emission current value for each source. The current and the pulse width from each source can be programed individually to be either the same or various.
Figure 2.
(a) A photograph showing the Hologic Selenia Dimensions rotating gantry tomosynthesis scanner with the mammography tube in several positions. (b) A schematic of a s-DBT scanner with the CNT x-ray source array mounted on the Selenia Dimensions gantry. For illustration purposes, x-ray radiations from three sources are shown. The 31 x-ray sources were labeled from left to right as: N15, N14, …, N1, 0, P1, …, P14, P15.
System calibration
The modulation transfer function (MTF) of the s-DBT scanner was measured using a homemade phantom consisting of a 50 μm diameter W wire. The phantom was mounted on the movable breast compression paddle of the Hologic scanner. The distance between the phantom and the surface of detector can be read from the compression paddle’s digital indicator. The wire has a 2° angle, which regards to the detector axis, allowing oversampling of the line spread function.37 The Selenium direct conversion detector was operated in 2 × 2 binning mode with 140 × 140 μm effective pixel size. Images were taken using 28 kV(peak) anode voltage and 6.67 mAs dose per view.
Phantom imaging
Projection images of a tissue-equivalent breast phantom (Model 013, CIRS, Inc.) and an ACR Gammex 156 Mammographic Accreditation phantom were collected using the s-DBT scanner and conventional Hologic scanner. The CIRS phantom is shaped to represent a partially compressed breast about 5 cm thick. Embedded within the CIRS phantom are randomly positioned solid masses and two MC clusters placed in the center layer. The ACR phantom simulates the x-ray attenuation of a 4.2 cm slab of compressed human breast composed of 50% adipose tissue and 50% glandular tissue. Target objects in ACR phantom are six nylon fibrils, five simulated microcalcification specs, and five masses. All of them are of known size, shape, and density. The projection images were then reconstructed using the Hologic provided back projection (BP) method, and the calculated geometry parameters yielded 50 slices through the phantom. The slice separation was 1 mm. The images were collected using the following parameters: 15 views over 14°, 28 kV(peak) anode voltage, and a total dose of 100 mAs (6.67 mAs per view).
RESULTS
CNT x-ray source array
Figure 3 shows the CNT x-ray source array designed for s-DBT. The tube contains an extended anode plate with 31 individual tungsten anodes and a two-stage active focusing assembly for electron beam focusing. In the picture, one can see the main housing components, which consist of the HV feed-through for the anode voltage input, two ion getter pumps that allow the monitoring of the pressure inside the tube, and the large x-ray window made from aluminum. The backside contains the electrical feed-through for the cathodes and the focusing electrodes. The tube was designed to provide similar scan modes as conventional moving source systems. The target material is tungsten with a 1 mm aluminum filtration x-ray window. Additional filters and collimators can be installed on the tube housing.
Figure 3.
Front and back views of the CNT x-ray source array.
Anode heat load simulation
Figure 4 shows the simulated anode temperature for exposure conditions listed in Table TABLE II.. For the simulation, the effective focal spot size was assumed to be 0.6 × 0.6 mm FWHM. At 28 mA tube current and 250 ms pulse width, the highest anode temperature was found to be less than 80% of the W melting temperature (Tm = 3695 K), which is generally considered within the safe operating range. The transient temperature drops very quickly to the base value after the exposure. The anode transient temperature rises with increase of tube power and exceeds the Tm at 38 mA and 38 kV(peak). To operate safely at 38 mA at this focal spot size, the anode voltage needs to be reduced. The temperature becomes substantially lower if 28 kV(peak) instead of 38 kV(peak) is used in the simulation, which is the most commonly used effective anode voltage for mammography. The anode temperature at 28 kV(peak) and 38 mA reduces to 2811 K, the same as that for the 38 kV(peak) and 28 mA case. The combinations of 28 mA/250 ms and 38 mA/183 ms were selected for the simulation because each provides the necessary dose for a projection view for a tomosynthesis imaging protocol of 100 mAs per scan with 15 projection views. The inset is a snap shot of the temperature distribution on the anode surface at the end of a 38 kV(peak), 28 mA, and 250 ms exposure. The temperature drops off quickly from the center of the focal spot.
Figure 4.
The simulated temperature at the center of the W anode during a single x-ray exposure at three different power levels. The horizontal line is 80%Tm of W. The insert shows temperature distribution on the anode surface at the end of a 38 kV(peak), 28 mA, and 250 s exposure.
TABLE II.
Simulated anode temperature for 0.6 × 0.6 mm FWHM focal spot size.
| High voltage [kV(peak) | Tube current (mA) | Power (W) | Exposure time (ms) | Max temperature (K) |
|---|---|---|---|---|
| 38 | 38 | 1444 | 183 | 3872 |
| 38 | 28 | 1064 | 250 | 2811 |
| 38 | 20 | 760 | 250 | 1962 |
CNT field emission electron source
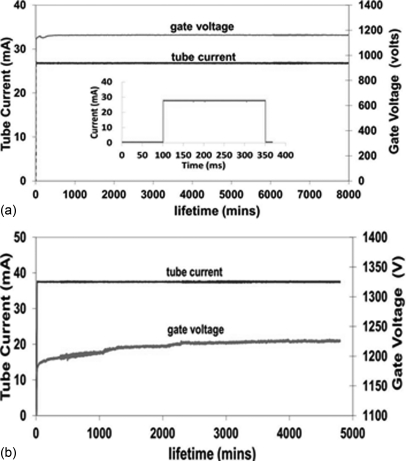
The stable emission current from the CNT cathode, the cathode to cathode consistency, and long term stability under the anode’s thermal manageable current level were investigated. Figure 5 shows the stability of the CNT cathode measured in two different conditions. At 27 mA tube current and 250 ms pulse width, the CNT cathode showed no degradation during the entire 8000 min of measurement at 5% duty cycle. This is equivalent to 400 min of total x-ray beam-on time or ∼100 000 tomosynthesis scans. The second test was performed at 38 mA with 183 ms pulse width. In this case, the focal spot size was larger than 0.6 × 0.6 mm. During the ∼5000 min of measurement at 0.6% duty cycle, the extraction voltage increased slightly (∼8 V per 1000 tomosynthesis scans). These two current waveforms were selected for the long term stability test because each pulse provided the dose for one projection view of a 15 view, 100 mAs tomosynthesis scan.
Figure 5.
(a) The graph shows a lifetime measurement performed at 27 mA tube current, 250 ms pulse width, and 5% duty cycle. The inset shows one current pulse. (b) The graph shows data at 38 mA tube current, 183 ms pulse width, and 0.6% duty cycle. The extraction voltage was adjusted automatically to maintain constant tube current.
It is worth pointing out that, as discussed in Sec. 2A, the effective anode kilovolt (peak) is the sum of anode voltage and gate-cathode voltage, and adjustment of gate-cathode voltage by XCU to maintain the constant current in principle affects the energy of the x-ray spectrum. However, as shown in Fig. 5, the adjustment in the gate-cathode voltage over the lifetime test is very small comparing to the anode voltage (<1%). This is because, in field emission, the current increases exponentially with the applied gate-cathode voltage.
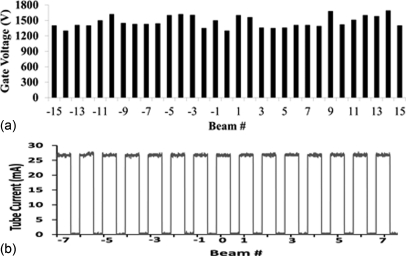
The source-to-source consistency of the sealed x-ray tube array was evaluated. Figure 6 plots the extraction voltage needed to obtain 27 mA tube current from all 31 x-ray sources. The difference between the lowest and the highest extraction voltages is about 400 V before any compensation or use of a ballast resistor. The XCU automatically adjusts the gate-cathode voltage to provide the programed milliampere value. Figure 6 shows an example of the output current from the central 15 of the 31 x-ray sources.
Figure 6.
(a) Variation in the extraction voltages needed to obtain 27 mA tube current from each CNT cathode in the x-ray source array before any compensation. The average value is about 1.4 kV. (b) Tube current from each of the central 15 sources. The XCU automatically adjust the extraction voltage to achieve the required current.
X-ray focal spot
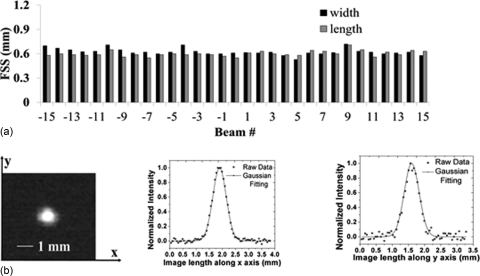
Figure 7 shows the measured focal spot sizes of all 31 x-ray sources of the CNT x-ray source array following the IEC standard.36 Detailed data from the central beam (source #0) is also shown in Fig. 7. The average focal spot size is 0.64 × 0.04 mm × 0.61 × 0.05 mm (width × length) at FWHM. The width direction is defined as being parallel to the x-ray source array orientation (scanning direction). The maximum focal spot size in both width and length direction is about 0.7 mm and the smallest dimension is around 0.5 mm.
Figure 7.
(a) Experimentally measured focal spot sizes (FWHM) of all 31 sources in the x-ray source array. (b) Pinhole image of the central beam (left) and Gaussian fitting curves for intensity profiles along the x and y axes, from which the FWHM is extracted. A gold-platinum pinhole with 12° opening angle, 100 μm diameter, and 500 μm length was used for the measurement.
System integration
The CNT source array is mounted on the gantry of Hologic Selenia Dimensions tomosynthesis scanner, replacing the regular rotating anode mammography x-ray tube, as shown in Fig. 8. Fine adjustment of the position and orientation of the array was made based on the geometry calibration using a phantom containing multiple metal balls. The source is electronically integrated with the detection unit. In the current design, exposure from the CNT x-ray source array is driven by the detector. Figure 8 shows an example from one tomosynthesis scan. The detector sent a TTL pulse train signal with each pulse corresponding to one detector frame with preset integration and readout time. The rising edge of each pulse triggers exposure from one corresponding x-ray source where the x-ray pulse width is programed to be equal to the detector integration time. The amplitude of the CNT cathode current, therefore the x-ray tube current, is regulated by control electronics, which automatically varies the extraction voltage applied to achieve the targeted value that can either be the same for each source or varies in a preprogramed pattern.
Figure 8.
(a) The specially designed CNT source array with 31 equal angularly spaced x-ray sources mounted on the gantry of the Hologic Selenia Dimension tomosynthesis scanner, replacing the regular rotating anode mammography x-ray tube. (b) Pulsing sequence from one scan with 15 views (bottom). The upper pulse train is the TTL signal from the detector. The rising edge is used for triggering. The lower pulse train is the x-ray tube current.
System calibration
Projection images of the MTF wire phantom were acquired using the 15-view, 14° angular coverage mode at a magnication factor of 1.08 (4.4 cm thickness) and 2 × 2 detector binning. Figure 9 shows the measured MTF from source N7 (#7 source on the left), 0 (central source), and P7 (#7 source on the right) in the s-DBT system. For comparison, the corresponding projection MTFs from the rotating gantry system measured at viewing angle of −7°, 0°, and 7° are also shown on the same figure. The spatial resolutions for the rotating gantry scanner, measured at 10% MTF, are 4 cycles/mm along the scanning direction and 5.4 cycles/mm perpendicular to the scanning direction. These results are consistent with the calculated values using the known system parameters (focus spot size, detector pixel size, and SOD). For the s-DBT system, the measured MTFs for the central source (#0) are 5.1 cycles/mm along the scanning direction and 5.2 cycles/mm perpendicular to the scanning direction. The MTF degrades slightly for the off-center x-ray beams. For example, for x-ray beams N7 and P7, the MTF is 5 cycles/mm along the scanning direction. The small variation in MTF for different x-ray beams can be attributed to the projection angle of the x-ray beam on the detector screen.38 The system MTF obtained using the reconstructed in-focused slice for the two system configurations are plotted in Fig. 9. The slice separation is 1 mm. The 10% system MTF is ∼1 cycles/mm lower than the projection MTF for the same system. This is attributed to the reconstruction process and the z-axis offset. When a reconstructed slice does not intersect the object exactly (z-axis offset), the object will be blurred. It has been reported that, with 0.5 mm z-offset, the system MTF can be degraded by as much as 1.5 cycles/mm.19
Figure 9.
(a) The projection MTFs of the stationary and rotating gantry DBT systems along the scanning direction. (b) The system MTF obtained using reconstructed in-focus slice.
Initial breast phantom imaging
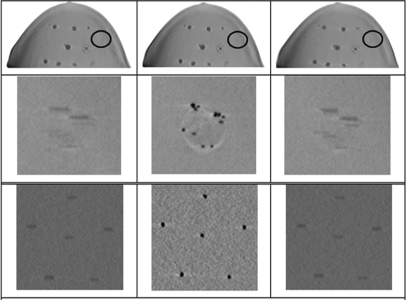
The first row in Fig. 10 shows three reconstructed slices of the biopsy breast phantom at depths of 1, 2.5, and 4 cm from the top. The second row shows the zoomed-in view of the circled region with MCs. The diameters of the microcalcifications are in the range of 0.2–0.5 mm. The third row shows three slices of the Gammex 156 ACR phantom at depths of 0.7, 1.4, and 2 cm from the top. The diameters of these microcalcifications are 0.54 mm. The MCs are most clearly shown in focus at the proper slice location.
Figure 10.
(a) Fifteen projection images of the biopsy breast phantom obtained from the system were reconstructed using the BP algorithm to yield 50 slices through the phantom, three of which are shown in the first row at depths of 1, 2.5, and 4 cm from the top surface. (b) The second row shows zoomed-in views of the circled regions. The diameters of these microcalcifications are in the range of 0.2–0.5 mm. (c) The third row shows three reconstructed slices of Gammex 156 ACR phantom, which are at depths of 0.7, 1.4, and 2 cm from the top. The diameters of these microcalcifications are 0.54 mm.
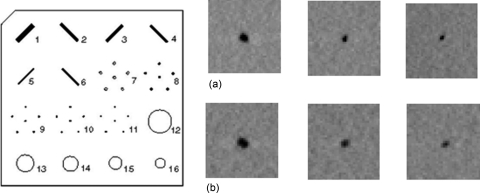
The layout of target objects in Gammex 156 ACR phantom is shown in Fig. 11. For comparison, the first row (a) and the second row (b) in Fig. 11 show a focused slice of the ACR phantom reconstructed using the data collected from the s-DBT and the DBT system, respectively. The three images from left to right in each row are the zoomed-in view of the central MC of the MC clusters #7, 8, and 9, respectively. The diameters of these three MCs are 0.54, 0.4, and 0.32 mm, respectively. The same magnification factor and the window/level are used in displaying the two sets of data. Qualitatively, the images in the first row collected using the s-DBT system are clearer.
Figure 11.
The layout of target objects in Gammex 156 ACR phantom is shown. (a) The first row shows the focused slices of the phantom reconstructed using the s-DBT projection data. (b) The second row shows the focused slices of the phantom reconstructed using the DBT projection data. The three images from left to right in each row are the zoomed-in view of the central MC of the MC Clusters 7, 8, and 9, respectively. The diameters of these three MCs are 0.54, 0.4, and 0.32 mm, respectively. The same magnification factor and the window/level are used in displaying the two sets of data.
DISCUSSION
The motivation of this research project was to improve the spatial resolution and the scanning speed of the current tomosynthesis technology. We successfully constructed a s-DBT system by replacing the regular mammography x-ray tube used in the Hologic Selenia Dimensions scanner with a spatially distributed stationary CNT x-ray source array. The s-DBT system is shown to have improved the spatial resolution and the scanning speed compare with DBT due to complete elimination of the source motion blur. Although the nominal focal spot size of the mammography x-ray tube used in the DBT scanner is slightly smaller than that of the present CNT x-ray source, the motion blurring is substantial during x-ray exposure, which degrades the image quality. In this study, using the standard imaging protocol of 15 views over 14°, a 25% improvement in in-plane spatial resolution was achieved in the s-DBT design. The improvement is expected to be more pronounced for a wider angular coverage, which is often preferred for better image reconstruction but is difficult to achieve with the rotating gantry design in high speed without significantly degrading the image quality. For the s-DBT scanner, since no mechanical motion is required to collect the multiple projection views, the spatial resolution is independent of the angular coverage. For example, the 10% system MTF will remain at 4.0 cycles/mm when the angular coverage is increased from 14° to 30° while all other parameters remain the same for the s-DBT scanner (Table TABLE III.).
TABLE III.
The spatial resolution and scanning time of the s-DBT system for different imaging protocols.
| 14,15 view, 100 mAs scan | Scan time | 6.3 s |
| Source motion blur | 0 | |
| 10% system MTF | 4.0 cycles/mm | |
| 30, 15 view, 100 mAs scan | Source motion blur | 0 |
| Scan time | 6.3 s | |
| 10% system MTF | 4.0 cycles/mm | |
| 30, 31 view, 100 mAs scan | Source motion blur | 0 |
| Scan time | 10.1 s | |
| 10% system MTF | 4.0 cycles/mm |
Note: The numbers for the 14°, 15 view, and 100 mAs scan were experimentally measured. The rest was calculated using 28 kV(peak) anode voltage, 37 mA tube current, 240 ms detector readout, and 140 × 140 μm detector pixel.
To minimize the effect of patient movement on the imaqe quality, it is desired to keep total scanning time as short as possible. The tomosynthesis scanning time of s-DBT is determined by the detector readout time and the number of projection views but is independent of the angular coverage. It can be expressed as . The exposure time per view Δtexp is set to be the same as the detector integration time and is a direct function of the total imaging dose (D, in mAs) required, Nview, and the x-ray tube current I (in mA) as follows: . At 38 mA tube current, is 180 ms for a 15-view and 100 mAs scan. This translates to a total scanning time of 6.3 s with current detector readout time of , regardless of the angular coverage. On the other hand, the scanning time of DBT depends on the scanning angle. The current Selenia Dimensions scanner takes 3.7 s for a 100 mAs and 15-view scan at 14° coverage. If the angular coverage is increased, the same scan will take longer to maintain the same spatial in-plane resolution. The scanning time of the s-DBT can be reduced by increasing the detector speed or/and increasing the x-ray tube current. With advancement of the detector technology, flat panel detectors with higher frame rates can potentially be available in the future.
As a new technology, the long term performance of the CNT x-ray source array for tomosynthesis needs to be evaluated. The accelerated lifetime measurement performed under the condition of 35 kV(peak) anode voltage, 27 mA tube current, and 0.25 s per pulse shows very little degradation of the CNT cathode during the entire experiment. Here, degradation is defined as the increase of the extraction voltage for a constant output tube current. The 400 min of total beam-on time measured from one source, without any noticeable increase of the extraction voltage, is equivalent to 100 000 tomosynthesis scans (15 view and 100 mAs per scan), which is estimated to be over 3 years in service lifetime (∼60 patients per day, 2 tomosynthesis scan per patient, 250 working days per year). The present source array is designed to allow ∼1000 V increase of the extraction voltage without affecting the x-ray output power, which means the actual service lifetime could be much longer than this. Initial phantom studies demonstrate the capability of the prototype s-DBT system to provide high quality images. Detailed phantom and specimen studies are ongoing.
CONCLUSION
A prototype s-DBT scanner has been developed and evaluated by retrofitting Hologic Selenia Dimensions rotating gantry DBT scanner with a CNT field emission x-ray source array. Preliminary results show that it improves the system spatial resolution by eliminating the image blur from x-ray focal spot motion during exposure. The scanning time depends on the detector speed and imaging configuration. At small angular coverage, the s-DBT scanner is slower but becomes comparable and slightly faster than the rotating gantry system at larger coverage angles. The scanning time can be further reduced without sacrificing the resolution using a faster detector. Accelerated lifetime measurement demonstrated the long term stability of the CNT x-ray source array for digital breast tomosynthesis.
ACKNOWLEDGMENTS
This research was supported by the National Cancer Institute (Grant Nos. R01CA134598 and U54CA119343) and the University Cancer Research Fund at the University of North Carolina. Dr. X. Qian is supported by a fellowship from the Department of Defense (Grant No. BC087505). The authors thank Dr. Y. Chen, Dr. G. Cao, and Dr. Y.Z. Lee for valuable discussions and assistance.
References
- Kopans D. B., Breast Imaging, 2nd ed (Lippincott Williams and Wilkins, New York, 1997).
- Cherney P. R. T., “Breast cancer mortality continues decline in Wisconsin,” Wisconsin Med. J. 98(4), 47–49 (1999). [PubMed]
- Paci E., “Mammography and beyond: Developing technologies for the early detection of breast cancer,” Breast Cancer Res. 4(3), 123 (2002). 10.1186/bcr429 [DOI]
- Bushberg J. T. et al. , “The essential physics of medical imaging,” Med. Phys. 30, 1936 (2003). 10.1118/1.1585033 [DOI]
- Nystrom L., Adnersson I., and Bjurstam N., “Long-term effects of mammography screening: updated overview of the Swedish randomised trials,” Lancet 359(9310), 909–919 (2002). 10.1016/S0140-6736(02)08020-0 [DOI] [PubMed]
- Moss S. M., Cuckle H., and Evans A., “Effect of mammographic screening from age 40 years on breast cancer mortality at 10 years’ follow-up: A randomised controlled trial,” Lancet 368(9552), 2053–2060 (2006). 10.1016/S0140-6736(06)69834-6 [DOI] [PubMed]
- Wu T. et al. , “A comparison of reconstruction algorithms for breast tomosynthesis,” Med. Phys. 31, 2636–2647 (2004). 10.1118/1.1786692 [DOI] [PubMed]
- Elmore J. G., Barton M. B., and Moceri V. M., “Ten-year risk of false positive screening mammograms and clinical breast examinations,” N. Engl. J. Med. 338(16), 1089–1096 (1998). 10.1056/NEJM199804163381601 [DOI] [PubMed]
- J. T.Dobbins, III, and Godfrey D. J., “Digital x-ray tomosynthesis: Current state of the art and clinical potential,” Phys. Med. Biol. 48, R65–R106 (2003). 10.1088/0031-9155/48/19/R01 [DOI] [PubMed]
- Poplack S. P. et al. , “Digital breast tomosynthesis: Initial experience in 98 women with abnormal digital screening mammography,” AJR, Am. J.Roentgenol. 189(3), 616–623 (2007). 10.2214/AJR.07.2231 [DOI] [PubMed]
- Smith A.et al. , “Lesion visibility in low dose tomosynthesis,” International Workshop on Digital Mammography 2006, United Kingdom (Springer-Verlag, Berlin/Heidelberg, 2006).
- Ren B. R. et al. , “A new generation FFDM/tomosynthesis fusion system with selenium detector,” Proc. SPIE 7622, 76220B (2010).
- Bissonnette M. et al. , “Digital breast tomosynthesis using an amorphous selenium flat panel detector,” Proc. SPIE 5745, 529–540 (2005). 10.1117/12.601622 [DOI]
- Zhang Y. et al. , “A comparative study of limited-angle cone-beam reconstruction methods for breast tomosynthesis,” Med. Phys. 33(10), 3781–3795 (2006). 10.1118/1.2237543 [DOI] [PMC free article] [PubMed]
- Wu T. et al. , “Tomographic mammography using a limited number of low-dose cone-beam projection images,” Med. Phys. 30(3), 365–380 (2003). 10.1118/1.1543934 [DOI] [PubMed]
- Maidment A. D. et al. , “Evaluation of a photon-counting breast tomosynthesis imaging system,” Proc. SPIE 6142, 89–99 (2006).
- Chen Y., Digital Breast Tomosynthesis (DBT)—A Novel Imaging Technology to Improve Early Breast Cancer Detection: Implementation, Comparison and Optimization (Duke University, Durham, NC, 2007).
- Zhou J., Zhao B., and Zhao W., “A computer simulation platform for the optimization of a breast tomosynthesis system,” Med. Phys. 34(3), 1098–1108 (2007). 10.1118/1.2558160 [DOI] [PubMed]
- Ren B. et al. , “Design and performance of the prototype full field breast tomosynthesis system with selenium based flat panel detector,” Proc. SPIE 5745, 550 (2005). 10.1117/12.595833 [DOI]
- Yorker J. G. et al. “Characterization of a full field digital mammography detector based on direct x-ray conversion in selenium,” Proc. SPIE 4682, 21 (2002). 10.1117/12.465568 [DOI]
- Niklason L. T. et al. , “Digital tomosynthesis in breast imaging,” Radiology 205(2), 399–406 (1997). [DOI] [PubMed]
- Suryanarayanan S. et al. , “Comparison of tomosynthesis methods used with digital mammography,” Acad. Radiol. 7(12), 1085–1097 (2000). 10.1016/S1076-6332(00)80061-6 [DOI] [PubMed]
- Dobbins J. T. and Godfrey D. J., “Digital x-ray tomosynthesis: Current state of the art and clinical potential,” Phys. Med. Biol. 48, 65–106 (2003). [DOI] [PubMed]
- Anderson I., Mammographic Screening for Breast Carcinoma, Ph.D. thesis, Lund University, Malmo, Sweden, 1980.
- Tabar L., Dean P. B., and Tot T., “Radiology of minimal breast cancer,” Radiology 217, 54 (2000).11012423
- Feig S. A., Shaber G. S., and Patchefsky A., “Analysis of clinically occult and mammographically occult breast tumors,” AJR, Am. J. Roentgenol. 128, 403–408 (1977). [DOI] [PubMed]
- US-FDA, “Digital Accreditation,” U.D.O.H.H. Services, 2011, http://www.fda.gov/RadiationEmittingProducts/MammographyQualityStandardsActandProgram/FacilityCertificationandInspection/ucm114148.htm.
- Qian X. et al. , “Design and characterization of a spatially distributed multibeam field emission x-ray source for stationary digital breast tomosynthesis,” Med. Phys. 36(10), 4389–4399 (2009). 10.1118/1.3213520 [DOI] [PMC free article] [PubMed]
- Yang G. et al. , “Stationary digital breast tomosynthesis system with a multi-beam field emission x-ray source array,” Proc. SPIE 6913, 69131A (2008).
- Zhou O.et al. , “Stationary x-ray digital breast tomosynthesis systems and related methods,” U.S. patent 7,751,528 (6 July 2010).
- FDA, Radiological Health-Performance Standards for Ionzing Radiation Emitting Products, in 21 (FDA, Silver Spring, MD, 2010).
- Carslaw H. S. and Jaeger J. C., Conduction of Heat in Solids Oxford University, New York, 1973,.
- Liu Z. et al. , “Carbon nanotube based microfocus field emission x-ray source for microcomputed tomography,” Appl. Phys. Lett. 89, 103111 (2006). 10.1063/1.2345829 [DOI]
- Zhang J. et al. , “A nanotube-based field emission x-ray source for micro-computed tomography,” Rev. Sci. Instrum. 76, 094301 (2005). 10.1063/1.2041589 [DOI]
- Oh S. J. et al. , “Liquid-phase fabrication of patterned carbon nanotube field emission cathodes,” Appl. Phys. Lett. 87(19), 3738–3740 (2004).
- IEC, “Medical electrical equipment—X-ray tube assemblies for medical diagnosis,” in Characteristics of Focal Spots (Geneva, Switzerland, 2005),p. 80.
- Fujita H. et al. , “A simple method for determining the modulation transfer function in digital radiography,” IEEE Trans. Med. Imaging 11(1), 34–39 (1992). 10.1109/42.126908 [DOI] [PubMed]
- Badano A., Freed M., and Fang Y., “Oblique incidence effect in direct x-ray detectors: A first-order approximation using a physics-based analytical model,” Med. Phys. 38, 2095–2098 (2011). 10.1118/1.3567497 [DOI] [PubMed]


