Abstract
Radiofrequency ablation is an effective minimally invasive treatment for tumors. One primary source of difficulty is monitoring and controlling the ablation region. Currently, RF ablation is performed at 460 kHz, for which MRI could play a role given its capability for temperature monitoring and tumor visualization. If instead the ablation were to be performed at the MRI Larmor frequency, then the MR capability for B1 field mapping could be used to directly visualize the RF fields created by the ablation currents. Visualizing the RF fields may enable better control of the ablation currents, enabling better control of lesion shape and size and improving repeatability. We demonstrate the feasibility of performing RF ablations at 64 MHz and show preliminary results from imaging the RF fields from the ablation. The post-ablation RF fields show an increase in current density in the ablated region, consistent with an increase in conductivity of the ablated tissue.
Index Terms: Magnetic resonance imaging (MRI), Image-guided treatment, radio-frequency (RF) ablation, magnetic field measurement, hyperthermia, bioimpedance, temperature dependence
I. Introduction
Radiofrequency ablation (RFA) is an effective, image-guided, minimally invasive therapeutic alternative to surgical treatment of cancer tumors. RFA is a well accepted form of therapy, in particular for treatment of non-resectable liver tumors [1]–[8]. However, control of the ablation volume is still challenging. Local charring acts as an insulator, causing unpredictable changes in RF current deposition and hence unpredictable ablations. Destruction of large tumors is difficult, especially if 0.5 cm to 1 cm margins are to be achieved. Typically, RF electrodes can ablate a 5 cm diameter volume in about 20 minutes; hence, for a 1 cm margin, only tumors 3 cm or smaller can be ablated in a single treatment. Existing needle placement planning simplistically assumes spherically shaped and overlapped ablations [9], [10] that cannot account for local anatomy, the impact of changes in the conductivity of ablated tissue on the next ablation, deployment failures of electrode tines, and the actual irregular ablated volume. The ability to better predict ablation shapes could allow large treatment regions with fewer overlapping ablations.
RF ablations use 460 kHz RF currents as high as 0.5 to 2 Amperes for durations up to 20 minutes. The current is delivered to the tissue via an electrode and returned by up to 4 ground pads, each typically 10×10 cm and placed on the thighs [11]. RF current deposits extremely high power (SAR) in tissue near the electrode, creating an outward flowing heat source. The tissue current density,
| (1) |
is comprised of conductiion and displacement components, where σ is conductivity, ε is permittivity and E is electric field. The current introduces a power density term |J|2/σ to the bio-heat equation modeling temperature T:
| (2) |
Here, ρ is tissue density, c is specific heat, k is thermal conductivity, and hbl models perfusion of blood at temperature Tbl. A metabolic heat term is omitted. As ablation progresses, tissue conductivity and perfusion change, altering current and power deposition, to create a highly nonlinear heating process. Above 45°C, intracellular protein denaturation and melting of lipid bilayers occurs, resulting in cell death [12]. Initially, tissue exhibits a 2%/°C decrease in resistance with heating [13], with the rate of change decreasing as tissue denatures. When critical temperatures are reached, impedance rises dramatically. Ablated tissue has been shown to have a permanent increase in conductivity separate from the temperature dependent conductivity changes [14], [15].
To achieve cell death, temperatures must exceed 50°C to 60°C over the target volume. To increase necrotic volume, modern systems incorporate multi-tine adjustable clusters [16], saline infused liquid electrodes [3], [5], [9], [17], [18], and bipolar or multipolar electrodes [19]–[21]. Even ground pad location influences lesion shape [22], [23]. Complex electrode geometries create the possibility of more complex current distributions in the electrode and therefore in the surrounding tissue, affecting the ablation lesion volume and shape. Due to the variety of tissue morphology and conductivity, the current pathways are difficult to predict and will vary from subject to subject.
Even now, MRI could play several major roles during an RFA treatment. Pre-treatment, MRI can be used to visualize tumors and real-time MRI could guide electrode placement to the desired location. During treatment, MRI could image temperature distribution using PRF thermometry [24]–[26]. Additionally, ablated tissue exhibits changes in T1 and T2 relaxation times [27] that could identify the ablated volume.
Traditionally, RFA is performed at 460 kHz. If ablations were instead performed at the Larmor frequency of an MRI scanner, the spatially distributed magnetic fields created by the RF current would also excite magnetization. By using B1 mapping techniques such as Actual Flip-Angle Imaging (AFI) [28], the Double Angle Method [29], or Bloch-Siegert [30], MRI can produce images of these magnetic fields and provide information about the distribution of the currents. By Ampère’s Law, the total current density generates an associated magnetic field:
| (3) |
of which the left circularly polarized transverse component, (Hx − jHy)(ax + jay)/2, excites spins. Even if ablation were performed at the typical 460 kHz, the near-field distribution of current at the Larmor frequency will be very similar to the ablation current distribution. The addition of RF magnetic field mapping with MRI to an RFA treatment has the potential to show the distribution of ablation currents, indicating where ablation will occur. This could add predictive power to interventional MRI for RFA treatments.
We have designed a prototype 64 MHz RFA system incorporated into a GE Signa 1.5 T MRI system using our existing low cost platform for imaging [31], [32]. The ablation process is monitored with real-time temperature and impedance measurements as well as MRI temperature maps. The ablation electrode provides the B1 excitation field in imaging sequences as well as the ablation current. The magnetic fields from the ablation currents before and after the ablation procedure are imaged using the AFI sequence [28]. The field patterns after ablation differ from the pre-ablation fields, showing that the conductivity changes from ablation affect the current pathways. Incorporating magnetic field mapping has the potential to add predictive information to RFA procedures and combines well with other potential MRI techniques for RFA visualization.
II. Methods
A. 64 MHz Ablation System
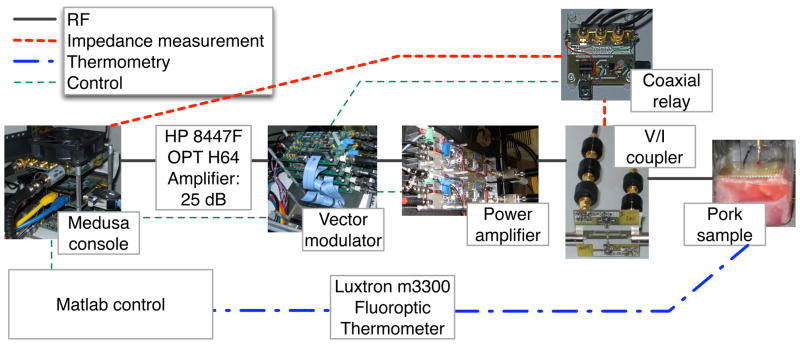
The 64 MHz ablation system (Fig. 1) used a Medusa console [31] to provide and control the RF signal and a Luxtron m3300 Biomedical Lab Kit from LumaSense (Santa Clara, CA, USA) to monitor temperature. A custom program written in Matlab (MathWorks, Natick, MA, USA) used a GUI to display the ablation and temperature data and to allow the user to control the ablation power accordingly.
Fig. 1.
Overview of ablation system. Matlab controls the ablation process through a Medusa console. The console provides the RF signal for ablation and receives the feedback signal for impedance measurement. A voltage and current coupler measures the waveforms at the output of the power amplifier, which is translated into sample impedance measurements accounting for the length of transmission line. A Luxtron fiber-optic thermometer provides temperature readings to the Matlab control system.
The Medusa console provided a low power 64 MHz RF signal which was amplified with a Hewlett Packard (Palo Alto, CA, USA) 8447F OPT H64 amplifier and a 300W power amplifier built from a Communications Concepts (Beavercreek, OH, USA) AN779H driver and AR313 power stage. An RF Lambda RFLC-HXD-7 circulator at the output of the power amplifier provided protection in case of high power signal reflections. Between the amplifiers, a vector modulator [32], controlled by Medusa, shaped and scaled the RF waveform while creating gating signals. One gating signal was used to control the power amplifier, and one controlled the coaxial relay used for impedance measurements.
Impedance measurements were calculated from voltage and current readings using an in-line voltage and current coupler [33]. The S-parameters of the coupler were measured to provide accurate calibration of the voltage and current readings. The signals from the voltage and current ports were combined into a single signal line using a Mini-Circuits (Brooklyn, NY, USA) ZX80-DR230-S+ SPDT RF switch, which was controlled by a gating signal from the vector modulator. 19 dB of attenuation was applied to each signal to limit the power through the relay. The resulting signal was recorded using the receive port of Medusa and sent to the Matlab program for processing. Before ablation, the electrical length of the transmission line from the voltage and current coupler to the ablation electrode was measured using an Advantest (Santa Clara, CA, USA) R3753AH 5Hz–500MHz Network Analyzer. The transmission line length was used to translate the current and voltage readings at the coupler into the input impedance of the ablation electrode in the tissue.
Real-time temperature readings were obtained with the Luxtron thermometer. Its fiber optic temperature probe is MR compatible, safe and accurate under the strong RF fields created by the ablation. The temperature was monitored by the Matlab program and displayed to the user along with the impedance measurements.
An ex-vivo porcine sample was used as the ablation phantom (Fig. 2). The sample was immersed in saline solution to ensure good electrical contact with the electrodes and to help prevent extreme desiccation of the tissue. A saline concentration of 50 mM NaCl was chosen to achieve a conductivity of about 0.5 S/m, which is typical of the conductivity of tissue at 64 MHz [34]. The solution was doped with 3 mM NiCl2 to shorten T1 to reasonable biological values, on the the order of 500 ms [35].
Fig. 2.
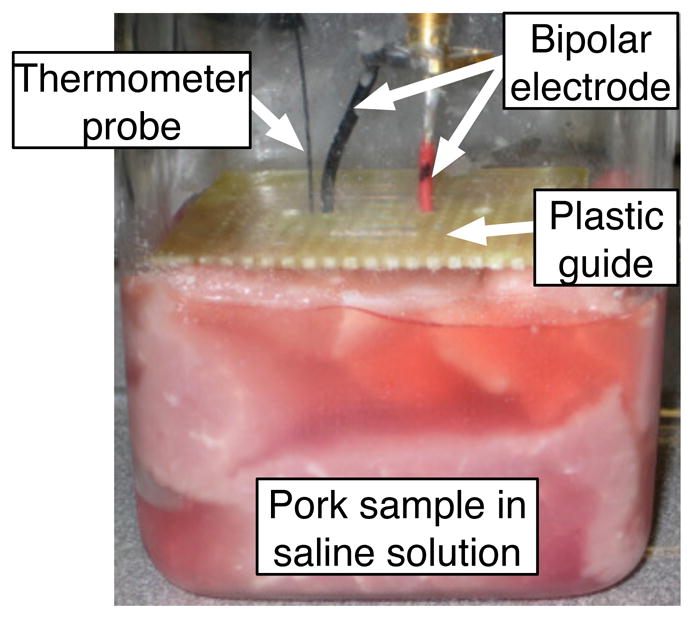
Porcine phantom used for ablation experiment. The bipolar ablation electrode provided both the current for the RF ablation and the B1 field for imaging field maps. The plastic guide holds the two polarities of the electrode at a distance of 0.5 inches at the anterior surface of the sample.
The bipolar ablation electrode consisted of two 18 gauge stranded copper wires. The wires were held at a 0.5 inch separation at the surface of the sample with a plastic guide. The uninsulated, active portion of the electrodes was one inch long. The fiber optic thermometer probe was inserted next to one of the electrode leads. The exact placement of the electrode is inconsistent due to the depth of the ablation electrodes, so the temperature readings are used as an indication of ablation process and not as an absolute measurement.
B. RF magnetic field imaging
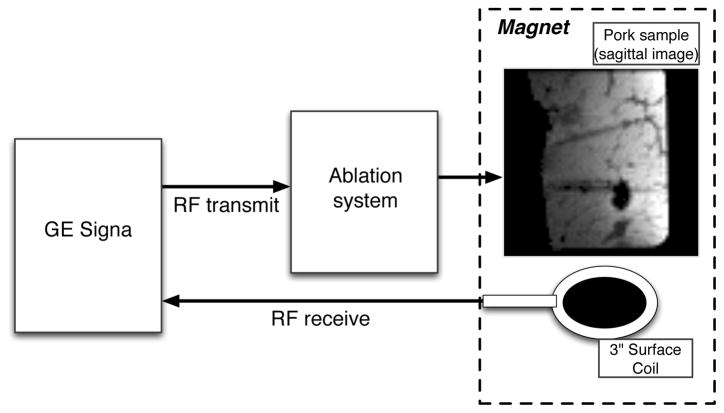
RF field images were acquired using a 1.5T Signa GE MRI scanner using a 3 inch diameter surface coil for receive. The RF excitation field was generated by the currents from the ablation electrodes. The ablation hardware was inserted into the RF transmit chain of the Signa imaging system (Fig. 3). Signa provided the small signal RF and a trigger signal to the Medusa console. A 2 ms hard pulse from the Signa system was shaped by the vector modulator to make a 1 ms hard pulse with 80 μs ramp times. Four different signal amplitudes were applied by the vector modulators to achieve B1 RF field magnitudes of 1/8, 1/4, 1/2, and full amplitude. The signal amplitudes were calibrated to account for amplifier nonlinearity by measuring a look-up-table of amplifier performance with the phantom load before the experiment. The transmit signal was monitored with the voltage and current coupler using the receive port of Medusa to monitor any residual non-linearity in the transmit magnitudes.
Fig. 3.
Imaging configuration of the ablation system. GE Signa provides the small signal RF to the ablation system, which then shapes and scales the waveform. Signa controls the gradients and processes the RF receive signal.
RF field maps were acquired using the AFI B1 mapping sequence [28] both before and after the ablation. The AFI sequence was chosen over alternative B1 mapping techniques such as the Double-Angle method [29] or Bloch-Siegert [30] due to its speed and suitability for volumetric acquisitions. Volumetric acquisitions were necessary to capture the full variation in B1 surrounding the electrodes. Additionally, a slice selective pulse is not suitable because the slice profile would vary due to the large variation in B1 amplitudes. Both coronal and sagittal orientations were acquired. Coronal slices had the electrodes running through the imaging plane, while central sagittal slices contained the length of both electrodes. The field of view was 6.4 cm in each direction, with 1 mm in-plane resolution and 4 mm slice thickness. The AFI sequence had TR1=20 ms, TR2/TR1 ratio=10, TE=3.2 ms, and an imaging bandwidth of 15.63 kHz. RF and gradient spoiling were applied as described by Yarnykh [36], using the optimal RF spoiling seed of 36°. Spoiling gradients of 40 mT/m were applied on each of the three gradient axes for a duration of 5 ms, creating total spoiling gradient areas of AG1/AG2=350/3500 mT·ms/m. The scan time at each transmit magnitude was 3:50.
The B1 maps for each transmit magnitude were separately reconstructed. The individual maps were then combined on a voxel by voxel basis. The raw images were windowed to remove low-signal areas where noise would dominate the reconstruction. Large flip angles are subject to reconstruction bias in the AFI sequence due to T1 bias [28] and incomplete spoiling of transverse magnetization [36], so data with reconstructed flip angles over 80 degrees was disregarded. Expected flip angles for the larger magnitude data sets were estimated using the smaller magnitude data sets to prevent aliasing from flip angles significantly over 90 degrees. The data sets with flip angles under 80 degrees were then scaled to the equivalent flip angle for the full scale using the measured ratios of transmit amplitudes. The scaled flip angles were combined with a weighted average based on the image magnitude during TR1, giving more weight to flip angles with higher SNR. Finally, the flip angle was converted to magnetic field magnitude in Gauss based on the area of the transmit pulse.
C. Temperature imaging
Temperature images were acquired using the proton resonant frequency shift [24]. The body coil provided the RF excitation to ensure that phase changes were due to heating and not due to altered transmit phase from changed current pathways. GRE phase images were compared to a reference phase image acquired before ablation. A single slice acquisition was used to minimize the time during which ablation needed to be suspended. The temperature maps had a field of view of 6.4 cm with 1 mm resolution and 4 mm slice thickness to match the B1 maps. The sequence had TE=10 ms, TR=50 ms, flip angle=20 degrees, and imaging bandwidth=15.63 kHz, with a total scan time of 4 seconds. The same 3 inch diameter surface coil from B1 mapping was used for receive. The copper material of the electrodes, with a magnetic susceptibility similar to that of tissue [37], meant that susceptibility artifacts from the electrodes were not a concern.
D. Ablation procedure
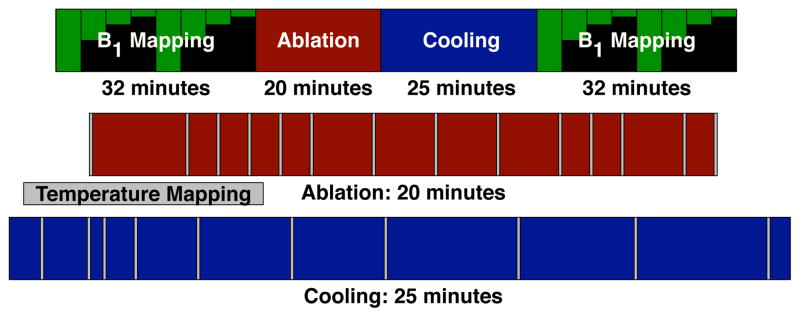
The timing of the ablation procedure is shown in Fig. 4. Initially, pre-ablation coronal and sagittal B1 maps were acquired with 4 different transmit amplitudes. A central sagittal slice that contained the majority of the electrodes’ length was selected for temperature imaging and a reference GRE image of that slice was acquired. The ablation started at a very low power level and the power was slowly increased. The active power deposition had a duty cycle of 28%. Temperature images were acquired periodically throughout the ablation to monitor its process, with the timing of the images indicated in Fig. 4. The power deposition was paused during temperature imaging to prevent RF interference with the imaging. Ablation proceeded until temperature images showed a significant area over 50°C for over two minutes to ensure successful necrosis. After ablation, the sample was allowed to cool with periodic temperature imaging. Once the temperature stabilized and temperature maps showed it to be largely uniform throughout the phantom, post-ablation B1 maps were acquired.
Fig. 4.
Timing of the ablation procedure. B1 mapping preceded and followed the ablation procedure, taking 32 minutes to acquire 4 transmit amplitudes in both sagittal and coronal orientations. During the 20 minute ablation, the power deposition was stopped periodically to acquire a temperature image, as indicated with grey bars on the diagram. After ablation, the phantom was allowed to cool for 25 minutes while acquiring temperature images. The time scale for the overall procedure is compressed by a factor of five compared to the ablation and cooling time scales.
III. Results
A. Ablation procedure
The ablation process took a total of 21 minutes to complete. The ablation current level was estimated to be about 60 mA. This estimate was derived from the forward transmit power level during ablation, which was 64% higher than the maximum level used for imaging. The imaging current level was estimated by comparing the observed fields to simulations, as discussed below. The current level is significantly lower than the level required in clinical ablations due to the small size of the sample and the lack of cooling due to perfusion.
The impedance and temperature readings during the ablation are shown in Fig. 5. The first two minutes of the procedure did not show much change in either impedance or temperature as the power level was slowly increased. As the power level was increased enough to cause significant heating, the resistance began to decrease. The reactance mirrored the resistance change and became more positive (inductive) with the temperature increase.
Fig. 5.
Impedance and temperature during ablation. The changes in temperature track the applied power level, with brief drops seen when the ablation was paused for imaging. The resistance decreases with temperature while the reactance increases, becoming more inductive. The impedance changes track closely with the measured temperature, even though the temperature change was not monotonic. The cooling period starting at 5 minutes, due to low applied power, shows that the impedance tracks thermal changes during cooling as well as heating.
After 5 minutes, the ablation power level was lowered for 4 minutes, testing the direct relationship between temperature and impedance. The lack of heating lead to a decrease in temperature and a corresponding increase in resistance and decrease in reactance. After the power was increased again at 9 minutes, the temperature again increased with corresponding impedance changes.
The impedance measurements were linearly interpolated to the time points of the temperature measurements to allow for direct comparison (Fig. 5c). The resistance increased with temperature, at a rate that slowed as temperature increased. The temperatures that were observed multiple times, during the initial heating, the low-power cooling cycle, and the final heating, had largely consistent impedance measurements, indicating that the impedance changes seen here were primarily due to the temperature change, not changes in tissue structure. The deviation from a strict relationship between temperature and impedance may be due to the fact that the temperature readings are only taken at a single point, or it may indicate some permanent impedance changes due to tissue necrosis.
At 460 kHz, tissue conductivity has been observed to increase by 2%/°C for heating below the point of coagulation necrosis [13]. The temperature coefficient in our experiment cannot be directly quantified due to the uneven nature of the heating. Using the single-point measurement of the temperature probe, the observed resistance decreased at approximately 0.4%/°C until 50°C, after which it approached an asymptote. While we cannot make a numeric comparison, the shape of the resistance response matches the known response at 460 kHz.
B. Temperature maps
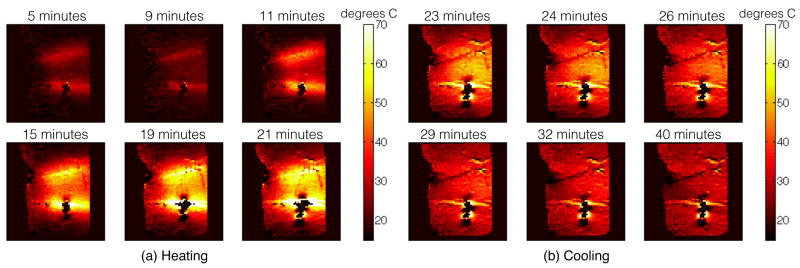
The temperature maps (Fig. 6) were taken on the sagittal slice that incorporated most of the electrodes. The temperature rise originated at the electrodes where the current density in the tissue was strongest. While there were strong magnetic fields seen in the insulated (anterior) portion of the electrodes (seen in Fig. 9), there was no heating observed there, indicating that the currents were well contained within the electrodes and did not enter the tissue.
Fig. 6.
Sagittal temperature maps during the ablation (a) and during cooling (b). Heating initially occurs localized to the ablation electrodes and spreads through thermal conduction. Heating is not induced on the insulated (anterior) portion of the ablation electrodes. Cooling during the low power period from 5 to 9 minutes is observed in the temperature map taken at 9 minutes. The peak temperature observed is about 70°C, with several minutes spent at temperatures over 50°C ensuring sufficient heating for successful ablation.
Fig. 9.
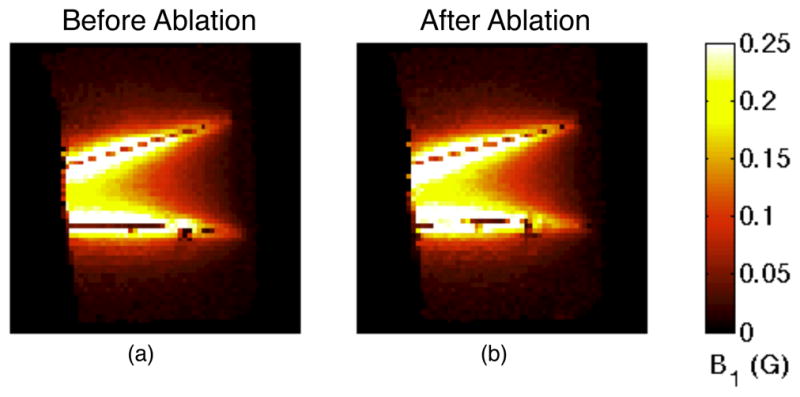
Maximum intensity projections (MIPs) of sagittal B1 maps before (a) and after (b) ablation. The fields are strongest near the electrodes. The field strength decreases posteriorly as the current level in the electrodes decreases due to current entering the adjacent tissue. The post-ablation image (b) shows greater field strength due to increased current.
There were some artifacts in the temperature maps, particularly around the inferior electrode that were likely due to movement between the reference image and the subsequent temperature maps. The movement was probably due to tissue contraction as it desiccated during heating. There was a phase shift across the electrodes in the raw images, so a shift in the electrode location would cause a significant artifact in the phase-based temperature maps. Artifacts like these might be avoided by using referenceless thermometry [38].
C. RF magnetic field maps
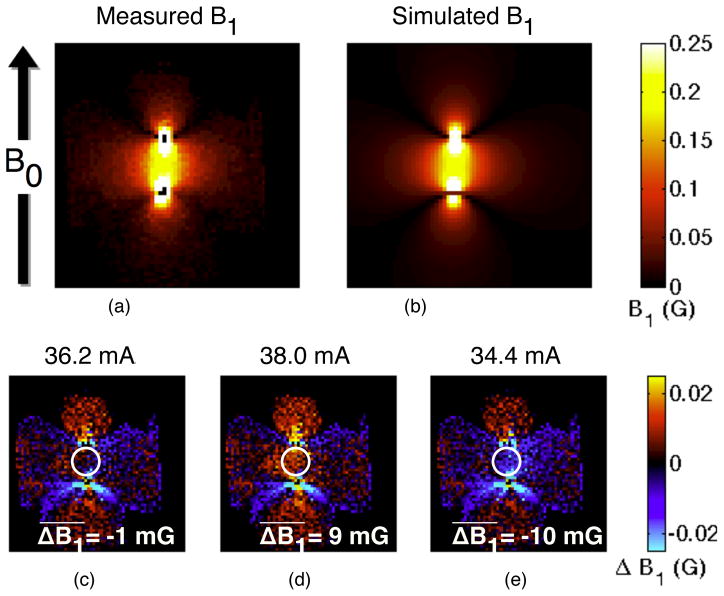
The current density was most concentrated at the electrodes, so the RF field maps were dominated by the fields associated with that current. To estimate the current in the electrodes, we performed a 2D simulation with through-plane current-carrying wires. The pre-ablation simulated and experimental RF field distributions are shown in Fig. 7. The fields are strongest near the wires and decrease with distance. The null field regions extending from the wires are due to the orientation of the magnetic field along B0. The fields that are aligned with the main magnetic field B0 cannot be visualized with B1 mapping because they do not excite magnetization.
Fig. 7.
Comparison of observed (a) and simulated (b) RF fields in a coronal slice, pre-ablation. The simulated fields assume all of the fields are due to two wires carrying opposing through-plane current. The null field regions near the wires are due to the field orientation along B0, which cannot be imaged. The experimental data matches well with the simulation, as seen by the difference between the two images (c). The low field regions show strong differences between the experiment and simulation due to partial volume effects and the inaccuracy of AFI at low flip angles. Increasing (d) or decreasing (e) the estimated current by 5% shows a clear increase in the difference between simulation and experiment, establishing a lower bound on the accuracy of the current estimate. To quantify this difference, the mean difference between the simulated and the measured B1 was calculated in a central region, selected to avoid partial volume effects in the rapidly varying regions while maintaining large signal levels. In the slice shown, the estimated current level creates simulated fields very similar to the measured fields, different by an average of −1 mG (c). Increasing (d) or decreasing (e) the simulated current level by 5% creates a significantly larger difference between the simulated and the measured fields, indicating that the error bound on the current level estimate is less than 5%.
The wire locations and current levels for the simulation were chosen to minimize the difference between the simulated fields and the experimental field maps. Different current levels and wire locations were used for the before and after ablation simulations to account for slight wire movement and changed current levels. The most anterior slice within the phantom was used to estimate the total current in the electrodes, as the current had not departed into the tissue yet at that location.
The post-ablation calculations show approximately 6% stronger current than the pre-ablation simulation (38.7 and 36.2 mA, respectively). To evaluate the accuracy of these estimates, we ran additional simulations with a 5% positive or negative change to the current level (Fig. 7d–e). The increased and decreased current level simulations showed observably stronger and weaker fields, respectively, than the experimental fields, indicating that the current level estimates are accurate to within 5%. Measurements from the current port of the coupler during imaging showed a 3% increase in current for the post-ablation images. Due to the approximate nature of the image-based current estimates, these changes are in good agreement.
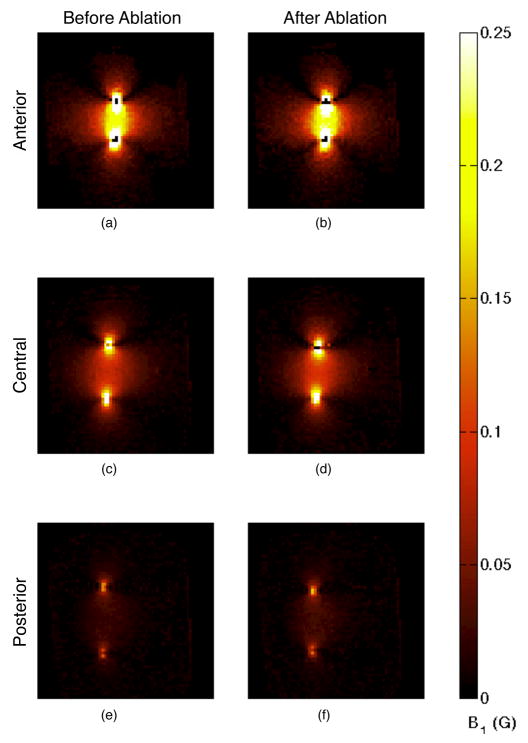
A comparison of different coronal slices (Fig. 8) shows that the current level in the electrodes decreased along their length in the posterior direction as the current departed the electrode and entered the tissue. The diminishing fields along the length of the electrodes are also observed in the sagittal field maps (Fig. 9). The distance between the two electrodes’ locations, as indicated by the strongest fields, decreased after the ablation. This was likely caused by shrinking of the ablated tissue drawing the electrodes closer together.
Fig. 8.
Coronal B1 maps before (a, c, and e) and after (b, d, and f) ablation. Slices are located at the anterior edge of the phantom where the electrodes are insulated (a and b), at a central location where the electrodes are active (c and d), and at the most posterior location that still contains the electrodes (e and f). The field strength (and current quantity) decreased along the length of the electrodes. The post-ablation images (b, d, and f) show increased field strength and a contraction of the distance between the electrodes.
The sagittal B1 maps are presented as maximum intensity projections (MIPs) (Fig. 9) because the electrodes were not contained entirely within one slice. The fields are strongest in the immediate vicinity of the electrodes, so selecting the slice with the strongest field for a given location will select the slice that is closest to the electrode for that location. MIPs are used instead of acquiring projection images because the partial volume effects due to variations in field strength make B1 mapping unsuitable for a projection acquisition. The fields were strongest at locations closest to the electrodes, so the MIP effectively shows an oblique slice that contains the electrodes.
All of the post-ablation maps showed greater field strength, indicating higher current levels, consistent with the measurements taken from the current port of the coupler. The current increase was both a global and a local phenomenon.
The global increase in current can be explained by the increased temperature of the phantom after ablation. While time was allowed for cooling of the phantom after the ablation before imaging, the final temperature was higher than the initial temperature due to overall heating of the sample. The final temperature was close to uniform as seen in the temperature maps (Fig. 6). This higher uniform temperature would be expected to cause a homogenous increase in conductivity of the phantom, leading to higher currents at the same forward transmit power.
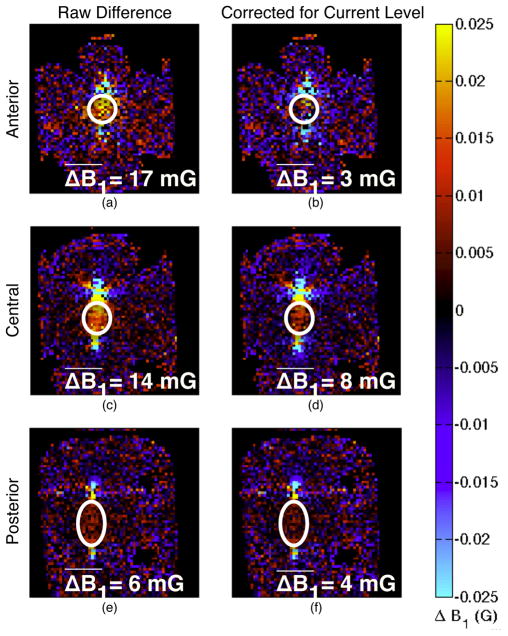
The local changes in field pattern indicate a change in current pathways. Subtracting the pre-ablation fields from the post-ablation fields shows the regions where the field patterns changed due to the ablation (Fig. 10). Taking the difference without accounting for the overall change in current magnitude primarily shows the increase in field strength due to the increased overall current, obscuring the change in field shape. To compensate for this, we scaled the fields proportionally to the level of current determined by the simulation comparison. After this scaling, the anterior slice (Fig. 10b), where the electrodes were insulated, shows no change in field pattern, while the other slices, where the electrodes were active, show stronger residual fields between the electrodes. The effect is stronger in the central slice (Fig. 10d) where the fields are stronger than the posterior slice (Fig. 10f). The local field enhancement indicates a higher local current density.
Fig. 10.
Change in coronal B1 maps from ablation. The images in the left column (a, c, and e) are the raw difference in the post-ablation images from the pre-ablation images, with red and yellow tinted regions indicating higher fields after ablation. The differences are quantified by taking the mean of the difference in a central region indicated by the white ovals. The region was selected for each slice to comprise the region between the electrodes while avoiding partial volume effects in regions with rapidly varying fields. Each slice shows field enhancement due to the stronger current magnitude in the electrodes as well as in the tissue. The right column (b, d, and f) shows the difference after scaling the fields based on the overall current level to highlight changes in strong field regions. The anterior slice (a and b), where the electrodes were insulated, shows little to no difference in field pattern, particularly after correction for current level. The central slice (c and d) shows field enhancement between the electrodes, indicating stronger current in the tissue in the ablated region between the electrodes, which remains after accounting for the increased current level. The posterior slice (e and f) shows slight field enhancement between the electrodes, commensurate with the lower overall fields in that slice.
The change in current distribution along the length of the electrodes can be seen by examining the ratio of the post-ablation field map to the pre-ablation map (Fig. 11). There are stronger fields post-ablation in the entire region between the electrodes, but it is concentrated primarily posteriorly. This is the region that was ablated, as indicated by the temperature maps in Fig. 6. Previous studies at 460 kHz [14] and between 10 Hz and 1 MHz [15] have shown increased tissue conductivity after ablation due to tissue structure changes. Increased conductivity and therefore current in the ablated region would create the observed localized increase in the magnetic field.
Fig. 11.
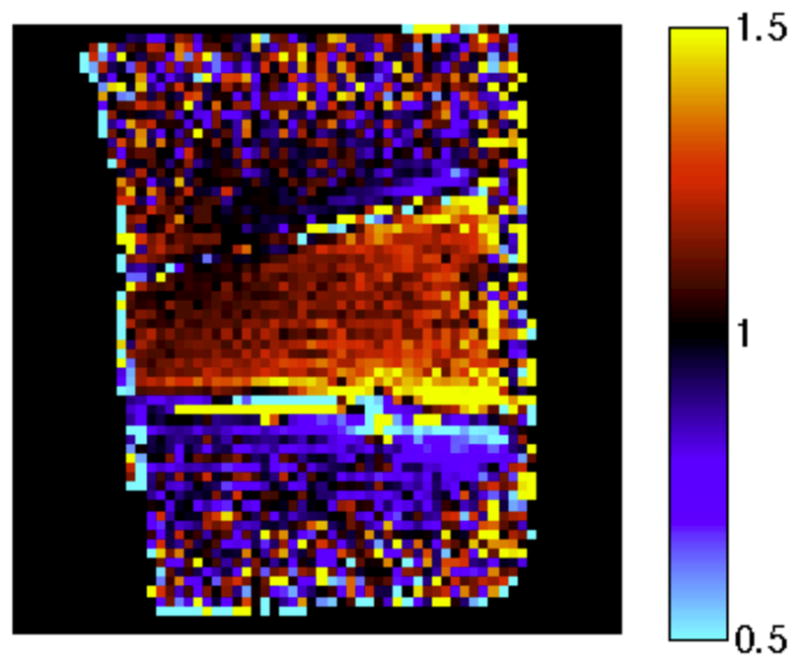
Ratio of the post-ablation sagittal B1 MIPs to the pre-ablation maps. Red tint, seen primarily between the electrodes, indicates stronger fields post-ablation, while blue tint, observed inferior to the inferior electrode, indicates a decrease in field strength. The larger overall field strength indicates higher current levels overall, while the concentration of the stronger fields to the posterior indicates that the currents were more concentrated there. This is consistent with increased conductivity in the ablated region. The region between the electrodes shows an increase in field strength post-ablation, whereas the region exterior to the electrodes shows a decrease in field strength. The large observed ratio at the periphery of the sample is due to domination of noise over the low fields.
Observation of the exact geometry of the changes in the magnetic field is confounded by the movement of the electrodes. The ablated tissue contracted, drawing the electrodes closer together. This made the fields outside the electrodes, in the direction away from the movement, appear weaker because the same region was then more distant from the electrode. The lower exterior fields are more apparent on the inferior electrode due to the greater movement of this electrode. The decreased fields exterior to the electrodes may also be caused by the concentration of currents between the electrodes, leading to decreased currents in the exterior.
IV. Discussion
RF ablation at 64 MHz can be integrated with 1.5T interventional MRI, allowing direct imaging of the magnetic fields from the ablation current. Lower field strengths common in interventional settings would have ablation currents nearer to the typical RFA frequency of 460 kHz, but would suffer from lower SNR. Ablation at 64 MHz appears to have many of the same properties as ablation at the typical frequency of 460 kHz, including increased conductivity of ablated tissue. The impedance changes with heating and ablation at 64 MHz are not well studied but seem to act in a similar manner as during ablation at 460 kHz. Performing the ablation at the Larmor frequency could allow magnetic field mapping to be added to MRI monitoring of RF ablations without significant detriment to the efficacy of the ablation.
Greater knowledge of the current distribution during RFA could lead to more robust treatments, predicting incomplete ablations and potentially allowing larger ablated regions or tailored geometries through real-time switching of current pathways. Field mapping of the ablation current shows clear changes in the current carried on each lead, and could even serve as a valuable design tool to improve electrode design. Experimentally quantifying the device behavior will show where the greatest concentrations of current enter the tissue for a given device geometry. For multi-tined and multi-polar ablation electrodes, more control becomes feasible. With a multipolar electrode, power could be diverted to leads that have lower current to provide more even heating. Field mapping could help predict unsafe levels of current concentrated near ground pads, helping to prevent ground pad burns, particularly as ablation power levels increase.
Potentially, RF current density imaging (RFCDI) [39]–[43] could be used to directly visualize the RF ablating current in the tissue. For a full volumetric vector reconstruction, RFCDI requires all three components of the magnetic field, including the field parallel to B0. Acquiring this extra field component requires rotating the subject [41], [44] but could potentially be estimated without any subject rotations [45]. The necessary SNR is difficult to achieve due to the low fields produced by the distributed current density and the overwhelming fields from the currents in the electrodes. Indeed, the high current and power density at the electrode suggest that field mapping the electrode current alone and inferring the orthogonal leakage current by Kirchoff’s current law could suffice. The imaging region and time could then be reduced to a few slices sufficient to cover the deployed extent of the electrode and shaft.
The current levels used for imaging are within an order of magnitude of the ablation currents used here, and the duty cycle was only 28%. By utilizing a high duty-cycle imaging sequence like AFI, it may be possible to incorporate the imaging currents into the ablation. An in vivo ablation will likely require higher currents due to active cooling through perfusion. While the imaging currents alone will likely not provide enough power for effective ablation, currents at frequencies a few megahertz away from the Larmor frequency could provide part of the power deposition. These currents would follow the same current pathways but not excite magnetization. They could be followed by a brief Larmor frequency excitation which would excite the magnetization. As long as the duty cycle of power deposition is low enough to allow for gradient readouts, it would be possible to image and ablate simultaneously.
The B1 mapping sequence will need to be faster to be practical in a clinical setting. Even for the simple electrode geometry used here, the large dynamic range of B1 presents challenges for using slice selective B1 mapping. Slice profiles in the vicinity of the electrodes will be distorted due to the very large fields violating the small tip angle approximation, hampering accurate B1 mapping. The field strength 1 mm from the electrode will be about 10 times larger than at a 1 cm distance. AFI can image flip angles from approximately 30° to 90°, achieving nearly a factor of 3 range in B1 values. This will require at least two acquisitions with different transmit current magnitudes just to cover this local region, with more transmit magnitudes required to extend the imaging region. Reconstruction of data sets with multiple B1 magnitudes is more reliable if the dynamic ranges of subsequent images overlap. Scaling the current magnitude by a factor of 2 for each acquisition is a reasonable compromise between speed and accuracy, requiring 4 separate acquisitions to cover the full range of B1 in the vicinity of the electrodes. Using an adiabatic partial passage pulse [46] in the AFI sequence will allow coverage of this entire B1 range if the pulse is suitably tuned to the expected field amplitudes.
Standard MRI acceleration techniques could also be used. We used a simple 2DFT readout. Using EPI, spiral, or other fast k-space acquisition strategies will reduce the number of sequence repetitions greatly. The amount of readout acceleration is limited by the TR length of the AFI sequence and the need for long spoiling gradients, but significant speed up is still possible with the TR length used here. Compressed sensing [47] could also reduce the number of TRs needed. Parallel imaging [48], [49] is less likely to be useful due to the limited field of view.
At current acquisition times, B1 mapping of the fields from ablation electrodes could still be useful outside of clinical settings. Phantom experiments could provide a great deal of information about the current distribution of various electrode geometries, providing a useful design analysis tool. The potential to apply parallel transmit techniques [50] with a multipolar electrode to tailor the lesion shape could be explored ex vivo, helping to design electrodes for particular lesion geometries.
Monitoring RFA with temperature and B1 mapping in vivo will entail further considerations beyond acquisition time. Most studies that examine the thermal dependence of the electrical properties of tissues use ex vivo tissue. While tissue conductivity has been observed to change after excision [51], the trend of an increase in conductivity as the tissue is heated has been commonly observed in vivo [6], [52]–[54]. The observed persistent increase in conductivity after cooling ex vivo may or may not occur in vivo.
Tissue movement due to tissue desiccation was a significant source of artifacts in this ex vivo experiment. While less desiccation would be expected in vivo due to perfusion from the surrounding tissue, more overall movement would be expected. This would require modification of the temperature imaging sequence, such as using referenceless thermometry [38]. Additionally, direct comparison of the B1 maps would be more difficult.
Future experiments are needed to further examine the tissue electrical property changes at 64 MHz in comparison to 460 kHz. Tissue properties during RF ablation at 64 MHz can be expected to fall between typical RF ablation at 460 kHz and microwave ablation at 915 MHz or 2.45 GHz [55]. Tissue impedance at 460 kHz undergoes a steep impedance rise when temperatures reach 100°C as tissue vaporization prohibits electrical contact, limiting the ablation [52]. Microwave ablation has been shown to create larger ablation lesions than RFA because displacement current progressively dominates over conduction current as the frequency transitions to the microwave regime, allowing higher temperatures while still effectively ablating [56]. Future 64 MHz RFA experiments should investigate the tissue electrical properties at higher temperatures to evaluate the effect of temperatures near 100°C on the impedance. Additional experiments could be done to directly measure tissue conductivity and permittivity at 64 MHz for a variety of temperatures rather than relying on impedance measurements from ablation electrodes. Alternatively, electrical properties tomography [57] could be used to directly visualize the electrical properties at 64 MHz at various temperatures.
V. Conclusion
We have demonstrated that RF ablation at 64 MHz is feasible and can be well integrated with 1.5 T MRI. MRI guidance of RF ablation provides good tumor visualization and allows imaging of the temperature distribution. If the ablation is performed at the Larmor frequency, RF field mapping provides new information about the location of the ablation currents, showing changing current pathways due to the ablation process. Adding knowledge of the field patterns could improve the effectiveness of RFA, particularly for large ablations where the treatment process is longer and will create varied tissue changes.
Acknowledgments
The authors would like to thank M. Etezadi-Amoli, Dr. M. Zanchi, E. Johnson, and D. Lee for their valuable comments on our research.
This work was supported in part by the National Institutes of Health under Grant R01EB008108, Grant R33CA118276, and Grant R21EB007715, and by the Whitaker Foundation under Grant RG-01-0110.
Contributor Information
Kim Shultz, Email: kshultz@mrsrl.stanford.edu.
Pascal Stang, Email: pstang@gmail.com.
Adam Kerr, Email: akerr@stanford.edu.
John Pauly, Email: pauly@stanford.edu.
Greig Scott, Email: greig@mrsrl.stanford.edu.
References
- 1.McGahan J, Schneider P, Brock J, Tesluk H. Treatment of liver tumors by percutaneous radiofrequency electrocautery. Semin Intervent Radiol. 1993;10:143–149. [Google Scholar]
- 2.Solbiati L, Ierace T, Goldberg SN, Sironi S, Livraghi T, Fiocca R, Servadio G, Rizzatto G, Mueller P, Del Maschio A, Gazelle GS. Percutaneous US-guided radiofrequency tissue ablation of liver metastasis: Treatment and follow-up in 16 patients. Radiology. 1997;202:195–203. doi: 10.1148/radiology.202.1.8988211. [DOI] [PubMed] [Google Scholar]
- 3.Livraghi T, Goldberg S, Monti F, Bizzini A, Lazzaroni S, Meloni F, Pellicano S, Solbiati L, Gazelle G. Saline-enhanced radio-frequency tissue ablation in the treatment of liver metastases. Radiology. 1997 Jan;202:205–210. doi: 10.1148/radiology.202.1.8988212. [DOI] [PubMed] [Google Scholar]
- 4.Rossi S, Di Stasi M, Buscarini E, Quaretti P, Garbagnati F, Squassante L, Paties CT, Silverman DE, Buscarini L. Percutaneous RF interstitial thermal ablation in the treatment of hepatic cancer. Am J Roentgenol. 1996;167:759–768. doi: 10.2214/ajr.167.3.8751696. [DOI] [PubMed] [Google Scholar]
- 5.Solbiati L, Goldberg SN, Ierace T, Livraghi T, Meloni F, Dellanoce M, Sironi S, Gazelle GS. Hepatic metastases: Percutaneous radio-frequency ablation with cooled-tip electrodes. Radiology. 1997;205:367–373. doi: 10.1148/radiology.205.2.9356616. [DOI] [PubMed] [Google Scholar]
- 6.Curley SA, Izzo F, Delrio P, Ellis LM, Granchi J, Vallone P, Fiore F, Pignata S, Daniele B, Cremona F. Radiofrequency ablation of unresectable primary and metastatic hepatic malignancies: Results in 123 patients. An Surg. 1999;230:1–8. doi: 10.1097/00000658-199907000-00001. [DOI] [PMC free article] [PubMed] [Google Scholar]
- 7.Rossi S, Buscarini E, Garbagnati F, Di Stasi M, Quaretti P, Rago M, Zangrandi A, Andreola S, Silverman D, Buscarini L. Percutaneous treatment of small hepatic tumors by an expandable RF needle electrode. Am J Roentgenol. 1998;170:1015–1022. doi: 10.2214/ajr.170.4.9530052. [DOI] [PubMed] [Google Scholar]
- 8.Livraghi T, Goldberg SN, Lazzaroni S, Meloni F, Solbiati L, Gazelle GS. Small hepatocellular carcinoma: Treatment with radio-frequency ablation versus ethanol injection. Radiology. 1999;210:655–661. doi: 10.1148/radiology.210.3.r99fe40655. [DOI] [PubMed] [Google Scholar]
- 9.Miao Y, Ni Y, Yu J, Marchal G. A comparative study on validation of a novel cooled-wet electrode for radiofrequency liver ablation. Invest Radiol. 2000;35:438–444. doi: 10.1097/00004424-200007000-00007. [DOI] [PubMed] [Google Scholar]
- 10.Chen M, Yang W, Yan K, Zou M, Solbiati L, Liu J, Dai Y. Large liver tumors: Protocol for radiofrequency ablation and its clinical application in 110 patients - mathematic model, overlapping mode, and electrode placement process. Radiology. 2004;232:260–271. doi: 10.1148/radiol.2321030821. [DOI] [PubMed] [Google Scholar]
- 11.Goldberg S, Solbiati L, Halpern E, Gazelle G. Variables affecting proper system grounding for radiofrequency ablation in an animal model. J Vasc Interv Radiol. 2000;11:1069–1075. doi: 10.1016/s1051-0443(07)61341-4. [DOI] [PubMed] [Google Scholar]
- 12.Curley S, Izzo F, Ellis L, Vauthey J, Vallone P. Radiofrequency ablation of hepatocellular cancer in 110 patients with cirrhosis. An Surg. 2000;232:381–391. doi: 10.1097/00000658-200009000-00010. [DOI] [PMC free article] [PubMed] [Google Scholar]
- 13.Huang S. Radiofrequency Catheter Ablation of Cardiac Arrhythmia -Basic Concepts and Clinical Applications. Armonk, NY: Futura; 1995. [Google Scholar]
- 14.Pop M, Molckovsky A, Chin L, Kolios MC, Jewett MAS, Sherar MD. Changes in dielectric properties at 460 kHz of kidney and fat during heating: Importance for radio-frequency thermal therapy. Phys Med Bio. 2003;48:2509–2525. doi: 10.1088/0031-9155/48/15/317. [DOI] [PubMed] [Google Scholar]
- 15.Haemmerich D, Schutt DJ, Wright AS, Webster JG, Mahvi DM. Electrical conductivity measurement of excised human metastatic liver tumours before and after thermal ablation. Physiol Meas. 2009;30:459–466. doi: 10.1088/0967-3334/30/5/003. [DOI] [PMC free article] [PubMed] [Google Scholar]
- 16.Gazelle G, Goldberg S, Solbiati L, Livraghi T. Tumor ablation with radio-frequency energy. Radiology. 2000;217:633–646. doi: 10.1148/radiology.217.3.r00dc26633. [DOI] [PubMed] [Google Scholar]
- 17.Lencioni R, Goletti O, Armillotta N, Paolicchi A, Moretti M, Cioni D, Donati F, Cicorelli A, Ricci S, Carrai M, Conte P, Cavina E, Bartolozzi C. Radiofrequency thermal ablation of liver metastases with a cooled-tip electrode needle: Results of a pilot clinical trial. Eur Radiol. 1998;8:1205–1211. doi: 10.1007/s003300050536. [DOI] [PubMed] [Google Scholar]
- 18.Lorentzen T, Christensen N, Nolsle C, Torp-Pedersen S. A cooled needle electrode for radiofrequency tissue ablation: Thermodynamic aspects of improved performance compared with conventional needle design. Acad Radiol. 1996;3:556–563. doi: 10.1016/s1076-6332(96)80219-4. [DOI] [PubMed] [Google Scholar]
- 19.Tungjitkusolmun S, Haemmerich D, Cao H, Tsai J, Choy Y, Vorperian V, Webster J. Modeling bipolar phase-shifted multielectrode catheter ablation. IEEE Trans Biomed Eng. 2002;49:10–17. doi: 10.1109/10.972835. [DOI] [PubMed] [Google Scholar]
- 20.Haemmerich D, Staelin S, Tungjitkusolmun S, Lee F, Mahvi D, Webster J. Hepatic bipolar radio-frequency ablation between separated multiprong electrodes. IEEE Trans Biomed Eng. 2001;48:1145–1152. doi: 10.1109/10.951517. [DOI] [PubMed] [Google Scholar]
- 21.Haemmerich D, Lee F, Schutt D, Sampson L, Webster J, Fine J, Mahvi D. Large-volume radiofrequency ablation of ex vivo bovine liver with multiple cooled cluster electrodes. Radiology. 2005;234:563–568. doi: 10.1148/radiol.2342031122. [DOI] [PubMed] [Google Scholar]
- 22.Jain M, Wolf P. Temperature-controlled and constant-power radio-frequency ablation: What affects lesion growth. IEEE Trans Biomed Eng. 1999;46:1405–1412. doi: 10.1109/10.804568. [DOI] [PubMed] [Google Scholar]
- 23.Jain M, Tomassoni G, Riley R, Wolf P. Effect of skin electrode location on radio-frequency ablation lesions: An in vivo and three-dimensional finite element study. J Cardiovas Electrophys. 1998;9:1325–1335. doi: 10.1111/j.1540-8167.1998.tb00108.x. [DOI] [PubMed] [Google Scholar]
- 24.Ishihara Y, Calderon A, Watanabe H, Okamoto K, Suzuki Y, Kuroda K, Suzuki Y. A precise and fast temperature mapping using water proton chemical shift. Magn Reson Med. 1995;34:814–823. doi: 10.1002/mrm.1910340606. [DOI] [PubMed] [Google Scholar]
- 25.Poorter JD, Wagter CD, Deene YD, Thomsen C, Stahlberg F, Achten E. Noninvasive MRI thermometry with the proton resonance frequency PRF method: In vivo results in human muscle. Magn Reson Med. 1995;33:74–81. doi: 10.1002/mrm.1910330111. [DOI] [PubMed] [Google Scholar]
- 26.Chung A, Hynynen K, Colucci V, Oshio K, Cline H, Jolesz F. Optimization of spoiled gradient-echo phase imaging for in vivo localization of a focused ultrasound beam. Magn Reson Med. 1996;36:745–752. doi: 10.1002/mrm.1910360513. [DOI] [PubMed] [Google Scholar]
- 27.Chung Y-C, Duerk JL, Lewin JS. Generation and observation of radio frequency thermal lesion ablation for interventional magnetic resonance imaging. Invest Radiol. 1997 Aug;32(8):466–474. doi: 10.1097/00004424-199708000-00006. [DOI] [PubMed] [Google Scholar]
- 28.Yarnykh VL. Actual flip-angle imaging in the pulsed steady state: A method for rapid three-dimensional mapping of the transmitted radiofrequency field. Magn Reson Med. 2007;57:192–200. doi: 10.1002/mrm.21120. [DOI] [PubMed] [Google Scholar]
- 29.Stollberger R, Wach P, McKinnon G, Justich E, Ebner F. RF-field mapping in vivo,” in. Proc 7th SMRM. 1988:106. [Google Scholar]
- 30.Sacolick LI, Wiesinger F, Hancu I, Vogel MW. B1+ mapping by Bloch-Siegert shift. Magn Reson Med. 2010;63:1315–1322. doi: 10.1002/mrm.22357. [DOI] [PMC free article] [PubMed] [Google Scholar]
- 31.Stang P, Conolly S, Pauly J, Scott G. MEDUSA: A scalable MR console for parallel imaging,” in. Proc 15th ISMRM. 2007:925. [Google Scholar]
- 32.Scott GC, Stang P, Overall W, Kerr A, Pauly J. A vector modulation transmit array system,” in. Proc 14th ISMRM. 2006:128. [Google Scholar]
- 33.Stang P, Zanchi M, Grissom W, Kerr A, Pauly J, Scott G. RF sensor considerations for input predistortion correction of transmit arrays,” in. Proc 19th ISMRM. 2010:44. [Google Scholar]
- 34.Gabriel S, Lau RW, Gabriel C. The dielectric properties of biological tissues: II. Measurements in the frequency range 10 Hz to 20 GHz. Phys Med Bio. 1996;41:2251–2269. doi: 10.1088/0031-9155/41/11/002. [DOI] [PubMed] [Google Scholar]
- 35.Kraft KA, Fatouros PP, Clarke GD, Kishore PRS. An MRI phantom material for quantitative relaxometry. Magn Reson Med. 1987;5:555–562. doi: 10.1002/mrm.1910050606. [DOI] [PubMed] [Google Scholar]
- 36.Yarnykh VL. Optimal radiofrequency and gradient spoiling for improved accuracy of T1 and B1 measurements using fast steady-state techniques. Magn Reson Med. 2010;63:1610–1626. doi: 10.1002/mrm.22394. [DOI] [PubMed] [Google Scholar]
- 37.Schenck JF. The role of magnetic susceptibility in magnetic resonance imaging: MRI magnetic compatibility of the first and second kinds. Med Phys. 1995;23(6):815–850. doi: 10.1118/1.597854. [DOI] [PubMed] [Google Scholar]
- 38.Rieke V, Vigen KK, Sommer G, Daniel BL, Pauly JM, Butts K. Referenceless PRF shift thermometry. Magn Reson Med. 2004;51:1223–1231. doi: 10.1002/mrm.20090. [DOI] [PubMed] [Google Scholar]
- 39.Scott GC, Joy ML, Armstrong RL, Henkelman RM. RF current density imaging in homogeneous media. Magn Reson Med. 1992 Dec;28(2):186–201. doi: 10.1002/mrm.1910280203. [DOI] [PubMed] [Google Scholar]
- 40.Scott GC, Joy ML, Armstrong RL, Henkelman RM. Rotating frame RF current density imaging. Magn Reson Med. 1995;33(3):355–369. doi: 10.1002/mrm.1910330309. [DOI] [PubMed] [Google Scholar]
- 41.Scott GC, Joy ML, Armstrong RL, Henkelman RM. Electromagnetic considerations for RF current density imaging. IEEE Trans Med Imag. 1995 Sep;14(3):515–524. doi: 10.1109/42.414617. [DOI] [PubMed] [Google Scholar]
- 42.Scott G, Chen A, Vigen K, Butts K. RF ablation electrode current imaging at 0.5T. Proc. 5th Interventional MRI Symp.; Boston. Oct. 2004; p. 41. [Google Scholar]
- 43.Wang D, DeMonte TP, Ma W, Joy MLG, Nachman AI. Multi-slice radio frequency current density imaging. IEEE Trans Med Imag. 2009;28(7):1803–1892. doi: 10.1109/TMI.2008.2012161. [DOI] [PubMed] [Google Scholar]
- 44.Wang D, Ma W, DeMonte TP, Nachman AI, Joy MLG. Radio-frequency current density imaging based on a 180° sample rotation with feasibility study of full current density vector reconstruction. IEEE Trans Med Imag. 2011 Feb;30(2):327–37. doi: 10.1109/TMI.2010.2078513. [DOI] [PubMed] [Google Scholar]
- 45.Shultz K, Scott G, Pauly J. Feasibility of full RF current-vector mapping for MR guided RF ablations,” in. Proc 15th ISMRM. 2007:1131. [Google Scholar]
- 46.Shultz K, Scott G, Barral J, Pauly J. Simultaneous B0 and high dynamic range B1 mapping using an adiabatic partial passage pulse,” in. Proc 19th ISMRM. 2010:2834. [Google Scholar]
- 47.Lustig M, Donoho D, Pauly JM. Sparse MRI: The application of compressed sensing for rapid MR imaging. Magn Reson Med. 2007;58(6):1182–1195. doi: 10.1002/mrm.21391. [DOI] [PubMed] [Google Scholar]
- 48.Pruessmann KP, Weiger M, Scheidegger MB, Boesiger P. SENSE: Sensitivity encoding for fast MRI. Magn Reson Med. 1999;42(5):952–962. [PubMed] [Google Scholar]
- 49.Griswold MA, Jakob PM, Heidemann RM, Nittka M, Jellus V, Wang J, Kiefer B, Haase A. Generalized autocalibrating partially parallel acquisitions (GRAPPA) Magn Reson Med. 2002;47(6):1202–1210. doi: 10.1002/mrm.10171. [DOI] [PubMed] [Google Scholar]
- 50.Katscher U, Börnert P. Parallel RF transmission in MRI. NMR in Biomed. 2006;19:393–400. doi: 10.1002/nbm.1049. [DOI] [PubMed] [Google Scholar]
- 51.Haemmerich D, Ozkan OR, Tsai J-Z, Staelin ST, Tungjitkusolmun S, Mahvi DM, Webster JG. Changes in electrical resistivity of swine liver after occlusion and postmortem. Med Biol Eng Comput. 2002;40(1):29–33. doi: 10.1007/BF02347692. [DOI] [PubMed] [Google Scholar]
- 52.Haemmerich D. Biophysics of radiofrequency ablation. Crit Reviews Biomed Eng. 2010;38(1):53–63. doi: 10.1615/critrevbiomedeng.v38.i1.50. [DOI] [PubMed] [Google Scholar]
- 53.Paulet E, Aubé C, Pessaux P, Lebigot J, Lhermitte E, Oberti F, Ponthieux A, Calès P, Ridereau-Zins C, Pereira PL. Factors limiting complete tumor ablation by radiofrequency ablation. Card Interv Radiol. 2008;31:107–115. doi: 10.1007/s00270-007-9208-1. [DOI] [PubMed] [Google Scholar]
- 54.Gersing E. Monitoring temperature-induced changes in tissue during hyperthermia by impedance methods. Ann N Y Acad Sci. 1999;873:13–20. doi: 10.1111/j.1749-6632.1999.tb09444.x. [DOI] [PubMed] [Google Scholar]
- 55.Simon C, Dupuy D, Mayo-Smith W. Microwave ablation: Principles and applications. Radiographics. 2005;25:S69–S83. doi: 10.1148/rg.25si055501. [DOI] [PubMed] [Google Scholar]
- 56.Andreano A, Huang Y, Meloni MF, Lee FT, Jr, Brace C. Microwaves create larger ablations than radiofrequency when controlled for power in ex vivo tissue. Med Phys. 2010;37(6):2967–2973. doi: 10.1118/1.3432569. [DOI] [PMC free article] [PubMed] [Google Scholar]
- 57.Katscher U, Voigt T, Findeklee C, Vernickel P, Nehrke K, Dössel O. Determination of electric conductivity and local SAR via B1 mapping. IEEE Trans Med Imag. 2009;28(9):1365–1374. doi: 10.1109/TMI.2009.2015757. [DOI] [PubMed] [Google Scholar]


