Abstract
Glycosylated proteins play important roles in a broad spectrum of biochemical and biological processes, and prior reports have suggested that changes in protein glycosylation occur during cancer initiation and progression. Ovarian cancer (OC) is a fatal malignancy, most commonly diagnosed after the development of metastases. Therefore, early detection of OC is key to improving survival. To this end, specific changes of the serum glycome have been proposed as possible biomarkers for different types of cancers. In this study, we extend this concept to OC. To characterize differences in total N-glycan levels, serum samples provided by 20 healthy control women were compared to those acquired from patients diagnosed with late-stage recurrent OC who were enrolled in an experimental treatment trial prior to receiving therapy (N = 19) and one month later, prior to the second treatment cycle (N = 11). Additionally, analyses of the N-glycans associated with IgG and characterization of the relative abundance levels of core vs. outer-arm fucosylation were also performed. The N-linked glycomic profiles revealed increased abundances of tri- and tetra-branched structures with varying degrees of sialylation and fucosylation and an apparent decrease in the levels of “bisecting” glycans in OC samples compared to controls. Increased levels of a-galactosylated structures were observed on N-linked glycans derived from IgG, which were independent of the presence of fucose residues. Elevated levels of outer-arm fucosylation were also identified in the OC samples. These results allowed the control samples to be distinguished from the baseline ovarian cancer patients prior to receiving the experimental treatment. In some cases, the pre-treatment samples could be distinguished from the post-experimental treatment samples, as many of those patients showed a further progression of the disease.
Keywords: ovarian cancer, permethylation, disease markers, fucosylation, IgG, glycomics, exoglycosidase digestion
Introduction
It has long been recognized that changes in glycosylation occur in different cancer cell types and tissues,1-6 although it has been less clear which glycoproteins are affected and which specific glycan structures are involved in the normal vs. pathological distinction of different cancer types. While both the membrane-bound and soluble glycoproteins can acquire unusual types of glycosylation in pathological tissues, a certain fraction of these biomolecules may enter the blood stream where they potentially may be detected as distinct components of plasma or serum fractions. If carefully detected and/or quantified, these glycoproteins or their controlled-degradation products, i.e. different released glycan structures, could be utilized as disease markers for early detection or, alternatively, as criteria of disease progression/regression during different treatments.
During the last several years, mass-spectrometric (MS) glycomic measurements have been pursued as a structurally-informative adjunct to the more clinically-established immunological assays7-11 and array approaches9,12-17 to biomarker discovery. Interestingly, one FDA-approved cancer biomarker is CA-125, a large mucinous glycoprotein abundantly secreted in the serum of women with OC.18-20 While the mucin-type molecules currently remain poorly characterized from the structural point of view, there are additional blood serum glycoproteins, including different globulins and acute-phase proteins which bear glycosylation changes that could be indicative of the presence or state of cancer.4,21-25 This has been demonstrated recently with hepatocellular,26-28 breast,29,30 esophageal,31 and prostate cancers,32 where the ratios of certain N-linked oligosaccharides appear indicative of different patients’ conditions. Due to the recent advances in sample treatment/glycan permethylation/MS methodologies, microliter volumes of serum now suffice for reliable profiling of numerous glycans. Blood serum has thus become a convenient sample medium for glycomic measurements pertaining to cancer investigations.
OC is an aggressive malignancy with high fatality rate, which has been attributed to difficulty in detection at early stage, when the disease is largely asymptomatic or frequently misdiagnosed.19,20 Over 70% of new OC cases are detected after the disease has already metastasized and the five-year survival for patients with stage III-IV ovarian cancer is significantly lower (15-30%)18-20 than that for women diagnosed at early stage (80-95%).18-20 The need for developing non-invasive technologies to enable the early detection of OC is thus critical. While the recognized biomarker CA-125 has the utility of monitoring a response to therapy and disease progression in women with ovarian cancer, its low specificity limits its suitability for detection of an early-stage ovarian cancer.19,20,33 Interestingly, CA-125 is a large glycoprotein featuring extensive O-linked glycosylation, whose carbohydrate structures have been at least partially characterized.34
While several current attempts at developing additional tests for ovarian cancer have centered around proteomics,35-39 quantitative glycomic profiling provides another promising avenue of investigation, as shown by Lebrilla and co-workers in their preliminary studies.40,41 Using 1-ml aliquots of blood serum and β-elimination as the glycan release procedure, these authors tentatively identified both N- and O- linked oligosaccharides in the MS-based measurements. In comparing their results with the CA-125 test, the authors deemed their glycomic procedure as superior to the measurements based only on CA-125. Further studies employing liquid-chromatographic separation and fluorescence detection conducted by Saldova et. al. have also highlighted increased levels of outer-arm fucosylation associated with the so-called “acute-phase” proteins and a decrease in galactosylation levels in IgG-derived glycans.23
In this report, we focus on the quantitative profiling of asparagine-linked oligosaccharides (N-linked glycans) extracted from only microliter volumes of blood serum samples provided by patients diagnosed with late-stage recurrent OC before and after receiving an experimental drug treatment (i.e. a combination of docetaxel and imatinib mesylate).42 Following the treatment, many of the patients enrolled in the experimental study showed increased tumor burden.42 These samples were used to evaluate the possibility of employing glycomic methods to monitor disease progression. Additionally, the glycans associated with immunoglobulin G (IgG) were profiled using a similar technique. A further structural elucidation of the fucosylated N-glycan structures through the use of selective enzymatic digestions and MS measurements was also performed. This quantitative methodology takes advantage of the recent technical improvements in glycan extraction and permethylation, which ensures reliable detection of sialylated structures.30,43
Following the sequence of statistical comparisons of the different states-of-health established for MS glycan profiling in our laboratory for other cancer investigations,26,29,31,32 baseline OC blood serum samples from 19 women, who were enrolled in an experimental drug trial prior to receiving the treatment, and 11 samples, obtained from patients prior to commencing a second treatment cycle and most frequently coinciding with disease progression, were rigorously compared with 20 aged-matched control samples.42 In the original experimental treatment study, a total of 23 patients were enrolled, with 14 patients demonstrating increased tumor burden at first tumor assessment, ultimately leading to a discontinuation of the experimental treatment.42 The resulting data were first subjected to a one-way analysis-of-variance test (ANOVA) and information for those structures providing acceptable results (p-values less than 0.05) were further processed by a receiver-operator characteristics test, resulting in an area-under-the-curve (AUC) value. Since certain sialylated and fucosylated structures were prominently displayed in these comparisons, the data were also evaluated through the notched-box plots44 as the general structural types.
The results presented in this communication further support the notion that the information gathered from various glycomic analyses potentially could be a beneficial addition to the frequently-used CA-125 test for OC detection.23,40 Furthermore, it is possible that such glycomic changes can be useful as biomarkers for early cancer detection, though further testing of serum from women diagnosed with earlier stages of OC needs to be performed. Further structural characterization of the disease-associated N-glycans may provide some information toward understanding the pathogenesis of OC.
Experimental
Materials
N-Glycanase F (PNGase F), used to enzymatically-release oligosaccharides from their protein backbones, was acquired from Northstar Bioproducts (East Falmouth, MA), while the additional exoglycosidases, a non-specific sialidase gene from Arthobacter ureafaciens, expressed in E. coli (Sialidase A) and a β1-4,6 galactosidase isolated from the jack bean, were purchased from Prozyme (Hayward, CA). Sodium hydroxide beads, methyl iodide, ammonia-borane complex, and β-mercaptoethanol were products of Sigma Chemical Co. (St. Louis, MO). The empty micro-spin columns used to construct the permethylation reactors, along with the graphite columns employed for sample purification, were obtained from Harvard Apparatus (Holliston, MA). The MALDI matrix, 2,5-dihydroxybenzoic acid (2,5-DHB), was received from Alfa Aesar (Ward Hill, MA). Sodium dodecyl sulfate (SDS) was acquired from Bio-Rad Laboratories (Hercules, CA), while Nonidet P-40 was purchased from Roche Diagnostics (Indianapolis, IN). EMD Chemicals, Inc. (Gibbstown, NJ) was the source of HPLC-grade water and trifluoroacetic acid (TFAA), while HPLC-grade acetonitrile (ACN), chloroform, and N,N-dimethylformamide were acquired from Mallinckrodt Baker (Phillipsburg, NJ).
Blood Serum Samples
Blood samples were collected from healthy women (control samples), or from patients diagnosed with late-stage recurrent OC who were enrolled in an experimental clinical trial using docetaxel in combination with imatinib mesylate.42 The patient samples were collected using standard operating procedures at two time points: before receiving a first round of the treatment (baseline) and prior to the beginning of the second cycle.42 Blood was collected into sterile Vacutainer tubes and allowed to clot for 30 min at the ambient temperature. The serum layer was removed, centrifuged, aliquoted, and stored at -80° C until its use. Blood collection was approved through institutional review board-approved clinical protocols (HOG-Breast120 and HOG-Gyn062).
Isolation of IgG
The Agilent Multiple Affinity Removal System (MARS) column (Agilent Technologies, Palo Alto, CA) was utilized in this study to isolate immunoglobulin G (IgG), along with albumin, from the blood serum samples. Aliquots of blood serum (20 μl) were first diluted to 200 μl using a proprietary buffer recommended by the manufacturer (buffer A) and filtered using low-retention 0.22 μm cellulose acetate filters to remove any insoluble particles. The samples were next injected onto the column at flow rate of 0.25 ml/min and the flow-through fractions containing the albumin- and IgG- depleted blood serum were collected. The bound proteins (albumin and IgG) were subsequently eluted from the column using the proprietary buffer B at a flow-rate of 1.0 ml/min and this fraction was also collected. Each sample was then desalted and buffer-exchanged into 10 mM sodium phosphate solution (pH = 7.5) using 5 kDa molecular-weight cut-off spin filters (Agilent Technologies, Palo Alto, CA). The protein concentration of each fraction was estimated against bovine serum albumin by a bicinchoninic acid (BCA) test (Thermo Fisher Scientific, Rockford, IL).
PNGase F Digestion, Solid-phase Extraction, and Reduction
Aliquots of blood-serum proteins (5 μl of blood serum or a total of 50 μg of albumin and IgG) were diluted to 25 μl with a buffer composed of 10 mM sodium phosphate (pH = 7.5) containing 0.1% β-mercaptoethanol, and 0.1% SDS. The samples were denatured and their disulfide bonds were reduced by incubating the samples at 60° C for 60 min. After allowing the samples to cool to the ambient room temperature, a 2.5-μl aliquot of 10% Nonidet P-40, a non-ionic, non-denaturing detergent, was added and allowed to equilibrate for 5-10 min to ensure that the SDS molecules had been sufficiently partitioned into the surfactant micelles. The N-linked glycans were liberated from their protein backbones by adding 5 mU of PNGase F and incubating the samples for 18 hrs at 37° C.
Following the digestion, the released glycans were isolated from the digestion-buffer components and deglycosylated proteins by employing graphite micro-spin columns. The medium was first conditioned with three 300-μl aliquots of a solution composed of 85%/15%/0.1% ACN/water/TFAA (solution B), then re-equilibrated with three 300-μl aliquots of a solution composed of 5%/95%/0.1% ACN/water/TFAA (solution A). The samples were first diluted to 250 l with solution A, then loaded onto the graphite medium, centrifuged, and reapplied to the same material a second time, and centrifuged again. The medium then was washed twice with 200-μl aliquots of solution A. Next, the glycans were eluted using two 200-μl aliquots of a solution consisting of 25%/75%/0.1% ACN/water/TFAA (solution C). Each sample was then fractionated into two equal aliquots and dried completely using a vacuum centrifuge. (The IgG samples were not fractionated; they were only dried.)
After being completely dried, the glycan samples were reduced to their alditol forms by adding a 10-μl aliquot of an aqueous 10 mg/ml solution of ammonia-borane complex and incubating the samples for 60 min at 60° C. After allowing the samples to cool to the ambient temperature, excess ammonia-borane complex was disrupted by the addition of three 1-μl aliquots of glacial acetic acid, added over a 3-hour time period. The samples were then dried under vacuum and borate salts were removed as their methyl esters by the addition of three 100-μl aliquots of methanol, followed by drying under vacuum.
Exoglycosidase Digestion
The exoglycosidase digestions required a re-release of the glycans from their respective proteins, as previously described in this communication. These samples were also purified with graphite spin columns. However, following the loading of the samples onto the medium and a thorough washing with solution A, any neutral structures were eluted with two 200-μl aliquots of a solution composed of 25%/75% ACN/water (no acid was included). Following this elution step, a further elution of the acidic structures was performed, as previously described. The elution of the neutral oligosaccharides was deemed necessary, since structures generated by the exoglycosidase digestion were also attached to IgG (for example, the glycan present at an m/z value of 1851.96, a core-fucosylated, a-galactosylated bi-antennary glycan). After drying, the samples were reconstituted in a 10-μl aliquot of a 10-mM sodium acetate buffer (pH = 5.5). To determine the location of a fucose unit, which could be located on either the chitobiose core of the glycan or on an outer arm, a non-specific sialidase, capable of removing both α2,3- and α2,6- linked sialic acids, (5 mU) and a β1-4,6 galactosidase (0.05 U) were added and the samples were incubated for 36 hrs at 37° C. Following the digestion, the samples were dried under vacuum and permethylated.
Solid-phase Permethylation
The N-linked glycans from each analysis (total N-linked, exoglycosidase digestions, or IgG) were permethylated statically in N,N-dimethylformamide (DMF), according to our previously published protocol.30 Briefly, microscale spin-column reactors were prepared by first loading the empty spin-columns (Harvard Apparatus, Hollister, MA) with sodium hydroxide beads that were suspended in ACN. The reactors were then thoroughly washed with DMF. Concurrently, the dried N-linked glycan samples were resuspended in a reaction solution consisting of 70 μl of DMF, 25 μl of methyl iodide, and 5 μl of water. The samples were then applied to each reactor and incubated for 15 min at room temperature. Next, the samples were centrifuged at a low speed and a second 25-μl aliquot of methyl iodide was added. Subsequently, the reaction solutions were reapplied to the reactors for a second 15-min period, after which time, they were collected by centrifugation. The permethylated structures were recovered from the reaction solution by a liquid/liquid extraction procedure using chloroform and repeatedly washed with a 0.5 M NaCl solution and HPLC-grade water. Following the extraction, the chloroform layer containing the permethylated N-linked glycans was dried in a vacuum centrifuge.
MALDI-TOF Mass-spectrometric Analysis
Prior to their MALDI MS analyses, the samples were reconstituted in a 5-μl aliquot of an 80%/20% water/methanol solution. A 0.5-μl aliquot of each sample was spotted on a standard MALDI plate and allowed to dry. Subsequently, a 0.5-μl aliquot of the matrix solution, 2,5-DHB prepared at a concentration of 10 mg/ml in a 50%/50% water/methanol solution and supplemented with 1 mM of sodium acetate, was spotted and dried under vacuum, resulting in a uniform layer of thin, fine crystals. Each sample was spotted in triplicate. The samples were interrogated automatically in a “batch mode” by an Applied Biosystems 4800 MALDI-TOF/TOF mass spectrometer (Forster City, California), operated in its positive-ion mode, monitoring the m/z range spanning from 1500 to 5000. A total of 5,000 laser shots were acquired for each sample spot.
Data Processing and Statistical Analysis
The resulting MALDI MS spectra were base-line corrected, a noise filter was applied, and exported as text files using Data Explorer (version 4.0), a software tool included with the instrumental software package. The data were then normalized by expressing the intensity of each glycan ion as a percent of the total intensity for all glycans included in this study. (For a list of these glycans, see Table 1.) Following normalization, the three spectra for each sample were averaged, and then subjected to a battery of statistical tests. The “diagnostic potential” of the individual glycans was assessed by first performing a one-way analysis-of-variance (ANOVA) using Microsoft Excel. Glycomic data resulting in statistically-significant p-values (less than 0.05) were further processed by the receiver-operator characteristics (ROC) test using Origin 8.5 (OriginLab Corporation, Northampton, MA). In this test, the true-positive rate, also called the “sensitivity,” was plotted against the false-positive rate, or the “1-specificity.” The resulting area-under-the-curve (AUC) value ranged from 0-1, where 0 was a perfectly negative test for the condition and 1 was a perfectly positive test. Using a slight modification to the arbitrary guidelines proposed by Swets,45 the significance of the remaining AUC values was assigned. Using these recommendations, if the AUC value was greater than 0.9 (indicating a “positive” test) or less than 0.1 (suggesting a “negative” test), the tests were considered “highly accurate,” while values between 0.8-0.9 or 0.1-0.2 were deemed “accurate.” When the AUC value was between 0.7-0.8 or between 0.2-0.3, the test was concluded to be “moderately accurate.” An “uninformative” test resulted in an AUC value that was between 0.5 and 0.7 or between 0.3 and 0.5.
Table 1.
Blood serum protein-derived glycans detected in this study. Additionally included are the p-values and area-under-the-curve (AUC) scores for the comparisons of the control samples to the baseline ovarian cancer samples and for the baseline ovarian cancer samples to the post-experimental treatment samples.
| AVG REL INT | AVG REL INT | AVG REL INT | p-value | p-value | AUC | AUC | ||
|---|---|---|---|---|---|---|---|---|
| Control | Base-line Cancer | Post-treatment | (Control vs Cancer) | (Cancer vs. Post-treatment | (Control vs Cancer) | (Cancer vs. Post-treatment) | ||

|
1595.81 | 2.571 | 2.472 | 1.710 | 0.846 | 0.253 | ||
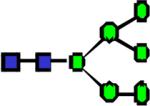
|
1799.91 | 3.055 | 2.440 | 1.907 | 0.195 | 0.343 | ||

|
1840.94 | 0.399 | 0.393 | 0.189 | 0.927 | 0.017 | 0.413 | 0.134 |

|
1851.93 | 8.200 | 8.458 | 5.729 | 0.836 | 0.0539 | ||

|
1922.99 | 0.299 | 0.251 | 0.231 | 0.383 | 0.69 | ||
|
|
1998.02 | 0.043 | 0.054 | 0.060 | 0.0738 | 0.51 | ||

|
2004.02 | 0.596 | 0.567 | 0.375 | 0.847 | 0.325 | ||

|
2045.04 | 0.314 | 0.216 | 0.128 | 0.00866 | 0.0195 | 0.255 | 0.489 |

|
2056.03 | 8.801 | 5.883 | 4.757 | 0.000204 | 0.122 | 0.166 | 0.34 |

|
2086.06 | 0.319 | 0.249 | 0.216 | 0.00626 | 0.361 | 0.242 | 0.364 |

|
2127.08 | 0.315 | 0.230 | 0.226 | 0.0109 | 0.925 | 0.245 | 0.445 |
|
|
2202.49 | 0.067 | 0.078 | 0.076 | 0.29 | 0.878 | ||

|
2208.12 | 0.910 | 0.834 | 0.589 | 0.731 | 0.393 | ||

|
2243.14 | 0.226 | 0.187 | 0.248 | 0.295 | 150 | ||

|
2260.16 | 3.071 | 1.711 | 1.506 | 0.000186 | 0.434 | 0.15 | |

|
2301.27 | 1.761 | 1.206 | 0.842 | 0.00248 | 0.0644 | 0.247 | 0.321 |

|
2331.2 | 0.076 | 0.054 | 0.049 | 0.00444 | 0.407 | 0.213 | 0.435 |

|
2406.22 | 0.118 | 0.130 | 0.110 | 0.287 | 0.108 | ||

|
2412.23 | 0.923 | 0.768 | 0.853 | 0.0441 | 0.232 | 0.332 | 0.651 |

|
2447.23 | 7.066 | 7.004 | 6.514 | 0.885 | 0.384 | ||

|
2505.27 | 0.550 | 0.431 | 0.317 | 0.0572 | 0.0797 | ||
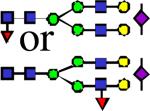
|
2621.33 | 2.796 | 2.546 | 2.110 | 0.391 | 0.222 | ||

|
2662.36 | 0.097 | 0.133 | 0.089 | 0.132 | 0.154 | ||

|
2692.38 | 0.286 | 0.239 | 0.195 | 0.252 | 0.282 | ||

|
2808.41 | 32.082 | 33.949 | 37.078 | 0.205 | 0.101 | ||

|
2866.44 | 1.787 | 1.963 | 1.199 | 0.652 | 0.12 | ||

|
2896.46 | 0.384 | 0.437 | 0.417 | 0.219 | 0.623 | ||

|
2982.5 | 3.233 | 3.449 | 3.784 | 0.36 | 0.193 | ||

|
3070.55 | 0.104 | 0.118 | 0.111 | 0.112 | 0.538 | ||

|
3227.63 | 0.539 | 0.631 | 0.427 | 0.304 | 0.0715 | ||

|
3257.65 | 0.573 | 0.733 | 0.743 | 0.029 | 0.921 | 0.689 | 0.469 |
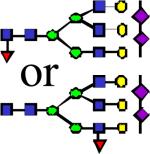
|
3431.71 | 0.066 | 0.139 | 0.148 | 0.00144 | 0.0767 | 0.824 | 0.589 |

|
3618.82 | 3.233 | 3.738 | 4.910 | 0.17 | 0.0401 | 0.608 | 0.678 |

|
3706.86 | 0.053 | 0.089 | 0.128 | 3.16E-04 | 0.0268 | 0.824 | 0.732 |
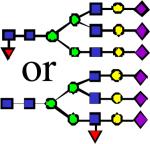
|
3792.91 | 0.658 | 1.810 | 2.802 | 3.42E-05 | 0.0143 | 0.887 | 0.775 |
|
3882.97 | 0.025 | 0.056 | 0.074 | 1.52E-03 | 0.275 | 0.866 | 0.725 |

|
4068.04 | 0.029 | 0.080 | 0.162 | 1.02E-05 | 0.00594 | 0.824 | 0.67 |

|
4243.13 | 0.022 | 0.065 | 0.095 | 0.000504 | 0.159 | 0.916 | 0.7 |

|
4429.22 | 0.038 | 0.170 | 0.379 | 4.29E-04 | 0.0149 | 0.895 | 0.713 |
Results
Serum samples were provided by healthy, control individuals (N = 20) and patients with late-stage recurrent OC (N = 19, baseline) and prior to the second cycle (N = 11).42 Many of the patients demonstrated increased tumor burden during the treatment course, ultimately leading to a discontinuation of the treatment.42 Reasoning that the trends observed between the control samples and those provided before the treatment should be accentuated in the patients following the treatment, the post-treatment samples were included in this study to evaluate the hypothesis that glycomic methods could be helpful in monitoring disease progression. The serum samples were subjected to a battery of glycomic tests, based on a combination of quantitative solid-phase permethylation and MALDI MS analysis. These tests included a comprehensive N-linked glycomic analysis to determine which subclasses of glycans (for example, fucosylated and sialylated or sialylated-only) and which specific glycans were altered in their relative abundances between the different sample sets. An analysis of the IgG-associated glycans was also performed, in addition to a study utilizing a non-specific sialidase and a β1-4,6 galactosidase to examine potential changes in the abundances of the possible locations of fucose units in the glycans of the pathological sample sets. The resulting data for each experiment were compared using a series of statistical measurements to evaluate the significance of any alterations between the different sample sets, which could indicate the overall state-of-health of an individual.
In any study of a comparative nature, several analytical figures-of-merit need to be considered. Perhaps most importantly, these are the reproducibility and repeatability of the methods employed. Through the development of our permethylation methodology employed in this study, we have previously refined our approach to result in average relative standard deviations for the glycans derived from blood-serum glycoproteins to be approximately 5%,30 a value which seems to be suitable for disease-related glycomic comparisons.
N-linked Glycomic Analyses
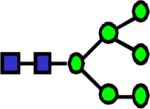
The N-linked glycomic analyses of serum samples resulted in the detection of nearly 50 distinct mass signals that corresponded to the generally recognized glycan structures (for a list of the oligosaccharides detected in this study, see Table 1.) Many of the individual signals observed may be the compilation of a mixture of isomeric structures; for example, the signal observed at an m/z value of 3792.9 can be due to triantennary trisialylated structures with either core or outer-arm fucosylation. This type of positional isomer does not alter the overall level of branching. However, isomers that result from the different locations of a GlcNAc residue, being located on the α1,3 or the α1,6 branched mannose of the core, or linked in a β1-4 manner to the core mannose, yielding the so-called “bisecting” structures, that will resulting in carbohydrates with differing levels of branching (for example a triantennary glycan or a bisected biantennary oligosaccharide.) Such possibilities could result in some problems with assigning a definitive structure to a given m/z value. To address this issue, our laboratory, in the past, has conducted extensive studies based on exoglycosidase digestions, capillary electrophoretic separations, and high- and low-energy collision-induced dissociation tandem MS experiments to confirm the nature of the structure observed at a given m/z value.
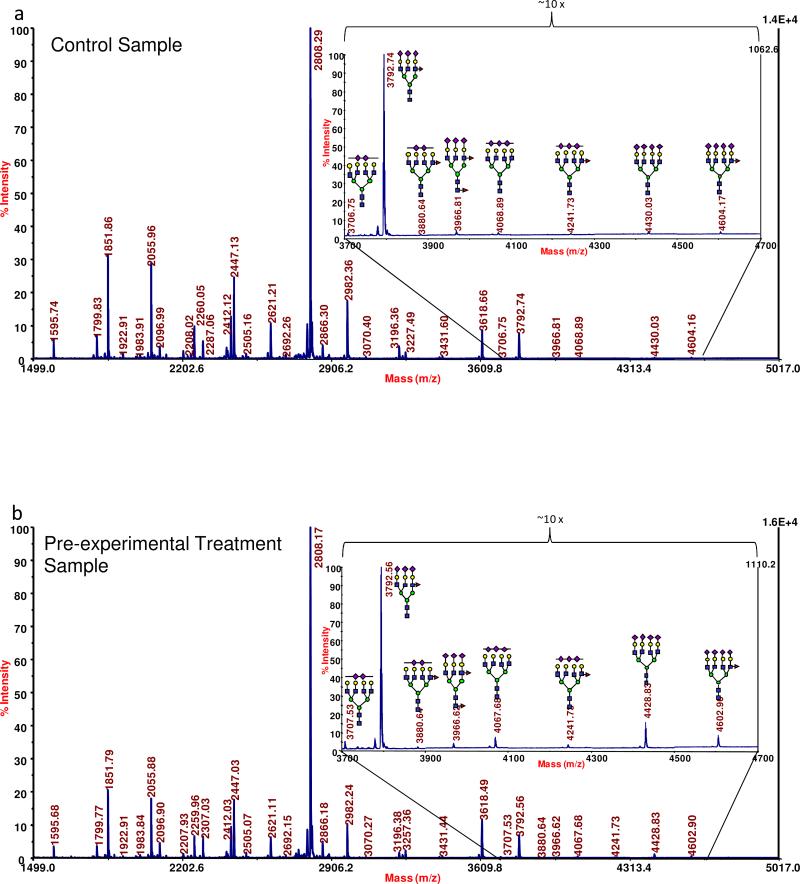
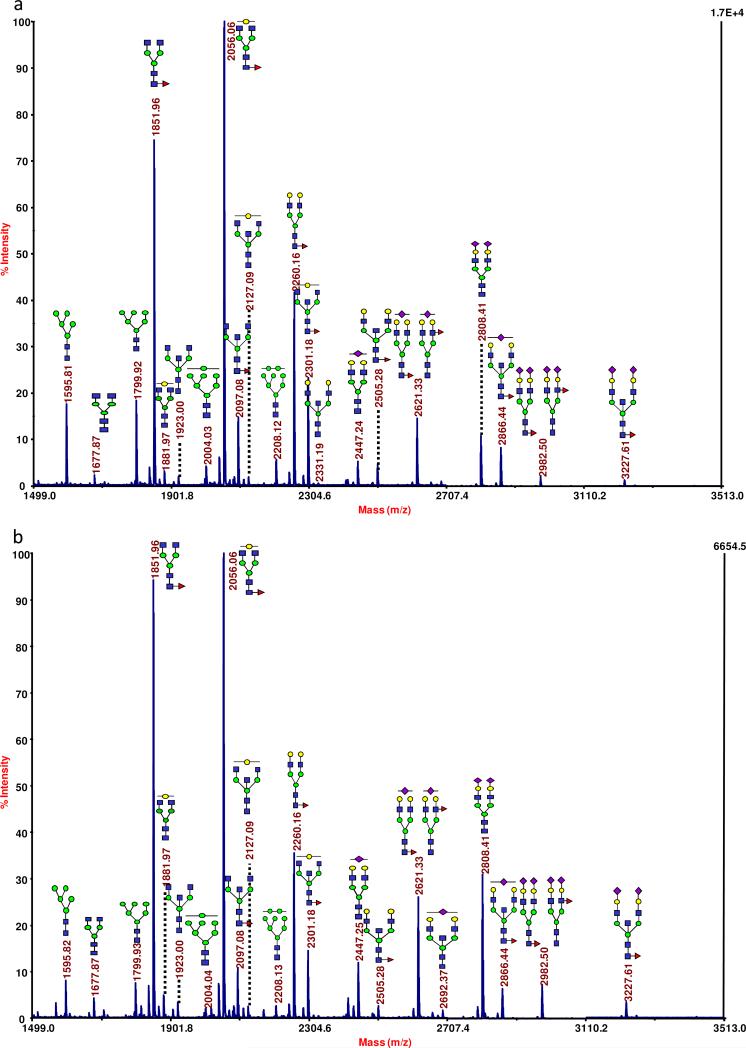
The observed MS peaks were associated with high-mannose type glycans, various neutral structures (both fucosylated and a-fucosylated), bisecting oligosaccharides, fucosylated and sialylated glycans, and sialylated-only analytes. These types of oligosaccharides can be seen as a profile in in Figure 1a and b, which presents a representative MALDI mass spectrum for the N-linked glycomic profile acquired for a control individual and an OC patient, respectively. In general, a comparison of these types of spectra for the different sample sets indicated that they appeared to be quite similar in the relative intensities of many of the more intense ions. (Compare Figure 1a and b.) However, several structures producing lower ion signals seemed to be capable of distinguishing the different states-of-health. Several of these key oligosaccharides appeared in the higher end of the mass range (see the insets of Figure 1a and b), where many of the tri- and tetra-antennary structures, with varying degrees of sialylation and fucosylation, were detected. While these higher-mass analytes were barely detectable in control sample (Figure 1a), their levels were significantly elevated in the baseline samples from OC patients (Figure 1b). Interestingly, many of these structures appear to be further increased in their intensities in the samples provided by the patients following the first cycle of experimental treatment (data not shown).
Figure 1.
A representative MALDI MS-based N-linked profile acquired for (a) a control individual, the high-mass region of the spectrum collected for a control individual is shown as the inset; (b) a baseline ovarian cancer patient, the inset depicts the high-mass region of the spectrum. Symbols: blue square, N-acetylglucosamine; green circle, mannose; yellow circle, galactose; purple diamond, N-acetylneuraminic acid; red triangle, fucose.
Analysis of Different Glycan Subclasses
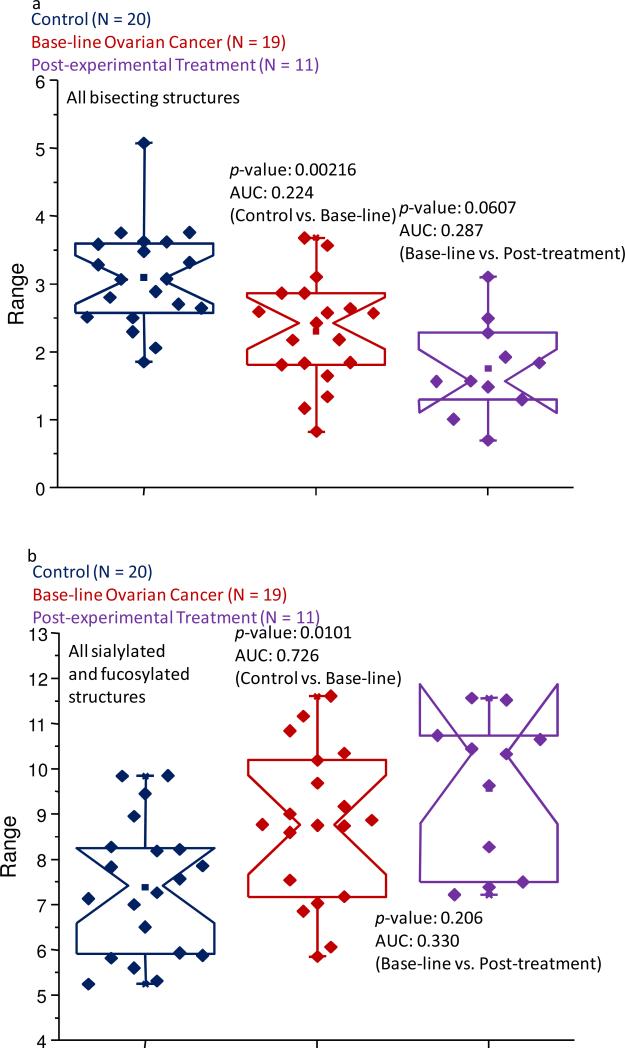
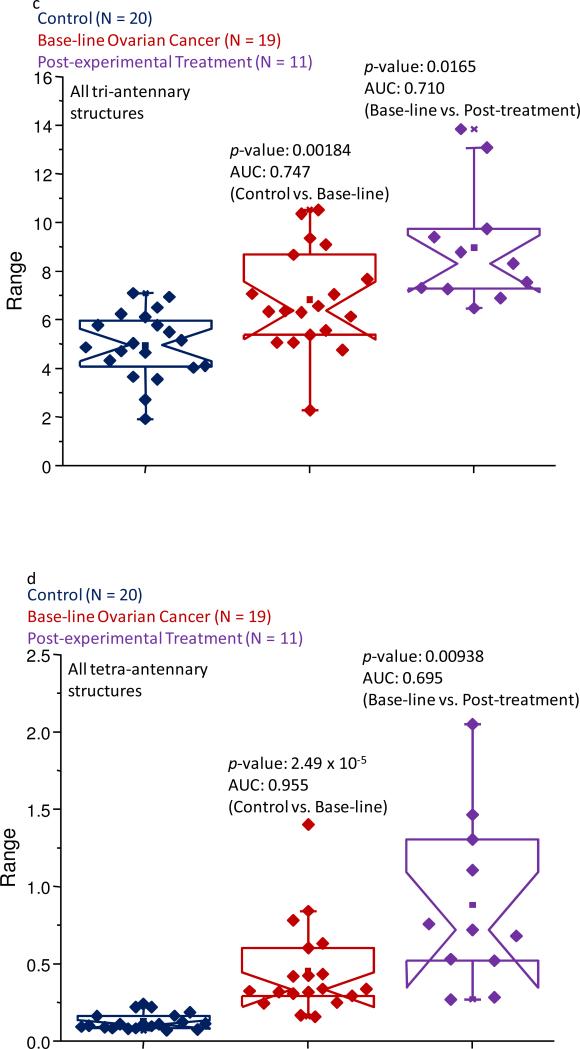
As an initial test to identify potential differences between the different sample sets, the pool of approximately 50 structures was divided into specific subclasses based on characteristic structural features. These subclasses included glycans that were bisecting, neutral fucosylated, sialylated and fucosylated, sialylated-only, tri-antennary, and tetra-antennary structures. After summing the normalized intensities of each subclass’ constituents and performing the statistical analyses on these resulting values, only the bisecting, sialylated and fucosylated, tri-antennary, and tetra-antennary subclasses passed both statistical criteria (p-values less than 0.05 and AUC scores that were at least moderately accurate) when the control samples were compared to the baseline OC samples. The bisecting, tri- and tetra-antennary subclasses appeared to be further altered in their relative intensities when the baseline ovarian cancer samples were compared to the post-treatment cohort. The comparisons for these subclasses are displayed as the notched-box plots in Figure 2a-d, respectively.
Figure 2.
Notched-box plots depicting changes in the relative abundances of (a) the bisecting subclass of glycans; (b) the fucosylated and sialylated oligosaccharide subclass; (c) the tri-antennary subclass of carbohydrates; and (d) the tetra-antennary subclass of structures for the control samples, baseline ovarian cancer samples, and the post-experimental treatment cohort. The symbols are the same as those described in Figure 1.
As shown in Figure 2a, a decrease in the relative abundance of the bisecting structures appeared to be associated with late-stage recurrent ovarian cancer, which is further supported by a p-value of 0.00216 and an AUC score of 0.224, a moderately accurate result. While such statistical comparisons could be viewed as somewhat debatable, there seemed to be a further trend in the suppression of these structures in the samples collected following the first cycle of the trial treatment. Further studies using a larger number of specimens or techniques that specifically target these types of structures need to be undertaken to verify this class of glycans as a potential indicator of cancer progression. It will be also important to understand the effects of the drug combinations on the various glycosyltransferases and acute-phase proteins synthesized and secreted by the liver.
The opposite trend was observed for the sialylated and fucosylated subclass, which can be seen in Figure 2b. These types of glycans appeared to be increased in their relative abundance in the baseline ovarian cancer samples. The data collected for this subclass produced a p-value of 0.0101 and a moderately accurate AUC score of 0.726, when this sample set was compared to the control specimens. Interestingly, these types of glycans did not appear to be further elevated in post-experimental treatment samples.
Additionally, the tri-antennary glycans (given as Figure 2c) also appeared to be increased in their relative abundance in the baseline serum OC samples, and further elevated in the samples following the experimental treatment. The p-value associated with this class was determined to be 0.00184 and the calculated AUC score was 0.747, classified as moderately accurate, when the control samples were compared to the baseline set of samples. When the baseline pool was compared to the post-experimental treatment samples, a p-value of 0.0165 was calculated and the AUC score was determined to be 0.710, indicating these types of glycans could potentially be used to follow disease progression, though further more detailed studies may need to be conducted to verify the validity of these results.
As suggested by the representative MALDI mass spectra presented as Figure 1a and b, the tetra-antennary subclass was significantly elevated in its relative abundance in the larger groups of the pathological samples (see Figure 2d). In the control cohort, these structures contributed only about 0.13% to the total normalized intensity, while in the baseline ovarian cancer sample set, this value was 0.45% and was further increased to 0.88% in the post-experimental treatment sample set. The data collected for these types of structures resulted in a p-value of 2.49 × 10⁻⁵ and an AUC score of 0.955 (highly accurate) when the baseline ovarian cancer samples were compared to the control pool. However, the samples collected following the first cycle of the experimental treatment resulted in a wide spread of the data, and while the p-value was acceptable at 0.00938, the AUC score was only 0.695. This value is just outside the cut-off for a moderately accurate test and was therefore classified as uninformative when this set of samples was compared to the baseline ovarian cancer cohort. However, these results suggest that a more targeted monitoring of these types of structures at least shows potential to track disease progression.
Analysis of Specific Structures
A more detailed examination of the mass-spectral data indicated that a total of 15 structures were altered in their expression levels between the control samples and the baseline ovarian cancer set. The results for the statistical comparisons are listed in Table 1. The data for five glycans produced p-values that were less than 0.05 and AUC figures that were moderately accurate, while 10 others resulted in acceptable p-values and accurate or highly accurate AUC scores. From these ten structures, two were neutral, fucosylated biantennary oligosaccharides possessing one or two galactose units and were observed at m/z values of 2056.03 and 2260.16, respectively. Both of these oligosaccharides appeared to be suppressed in their abundance levels in the baseline pathological samples, when compared to the control samples, with their p-values both being in the 10-4 range and their associated AUC scores which were both deemed to be accurate at 0.166 and 0.150, respectively. However, these structures did not appear to be different between the baseline ovarian cancer samples and those collected following the experimental treatment. These two structures were also observed in the analysis of the IgG-associated glycans and their normalized relative intensities were similarly determined to be suppressed in both pathological sample sets in this study.
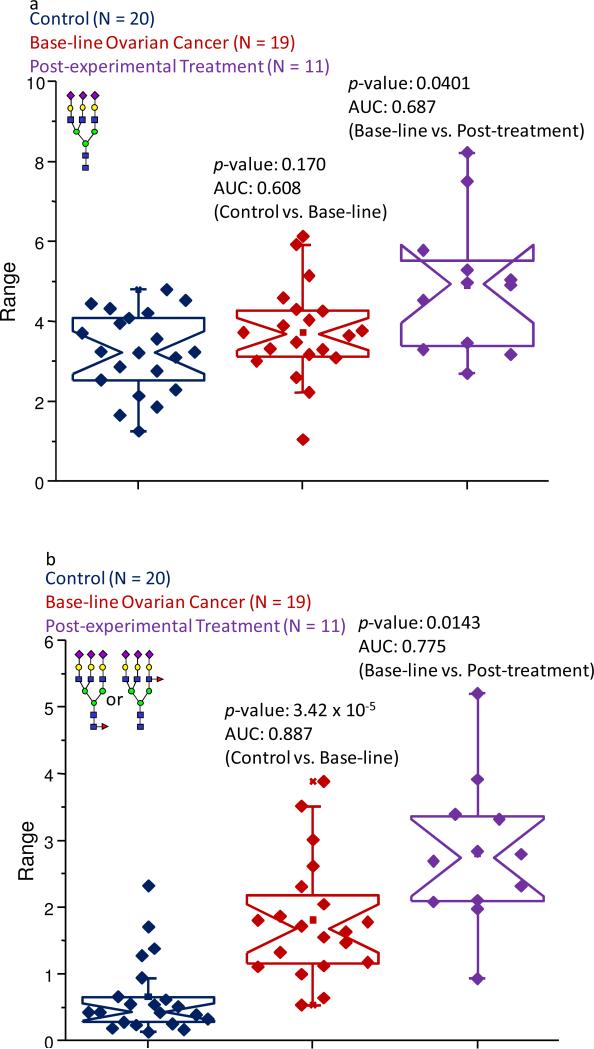
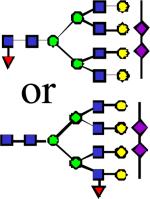
The remaining eight glycans were all tri- or tetra-branched structures with varying levels of sialylation and fucosylation. Each of these structures was increased in their relative abundance in the baseline ovarian cancer samples. For the tri-antennary structures, fucosylation appeared to be a key feature (refer to Figure 3a and b) in determining the altered abundance levels in these pathological samples. Neither of the a-fucosylated, tri-antennary structures (present at m/z values of 3257.65 and 3618.82 for bi- and tri-sialylated oligosaccharides, respectively) appeared to be significantly changed in their expression levels between the different sample sets. This was highlighted by the structure present at an m/z value of 3618.82, shown as Figure 3a, which resulted in average normalized intensities of 3.23% in the control samples, 3.74% in the baseline ovarian cancer samples, and 4.91% in the samples collected following the first cycle of the experimental treatment. A statistical comparison of the data associated with this structure produced p-values that were greater than 0.05, indicating that the apparently increased abundance levels in the baseline pathological sample set was not a reliable indicator of an individual's state-of-health, nor could it accurately reflect disease progression or regression. Further comparisons between the pre- and post- experimental treatment samples did not produce satisfactory statistical figures. (Refer to Table 1.)
Figure 3.
Notched-box plots showing the relative abundances of (a) the tri-sialylated tri-antennary structure (observed at an m/z value of 3618.82); and (b) the fucosylated tri-sialylated tri-antennary oligosaccharide (observed at an m/z value of 3792.91). The symbols are the same as those described in Figure 1.
The presence of a fucose moiety seemed to result in increased normalized abundances in the pre- and post- experimental treatment sample sets for the fucosylated, di- and tri-sialylated, tri-antennary glycans (observed at m/z values of 3431.71 and 3792.91, respectively). This finding was exemplified by the structure producing an ion observed at an m/z value of 3792.91, as is demonstrated in Figure 3b. This particular glycan accounted for an average normalized intensity of about 0.66% in the control samples and was responsible for about 1.8% of the total intensity in the baseline ovarian cancer samples. This oligosaccharide was further elevated in its abundance in the samples obtained following the first cycle of the experimental therapy and contributed about 2.8% to the total intensity in this sample set. Further evidence supporting these increased abundances was provided by the statistical calculations, which resulted in a p-value of 3.42 × 10⁻⁵ and an AUC score of 0.887, when the baseline ovarian cancer samples were compared to the control cohort. When the post-experimental treatment samples were compared to the baseline ovarian cancer samples, a p-value of 0.0143 was determined and an AUC value of 0.775 was returned, indicating this structure could be a key analyte to monitor the disease progression.
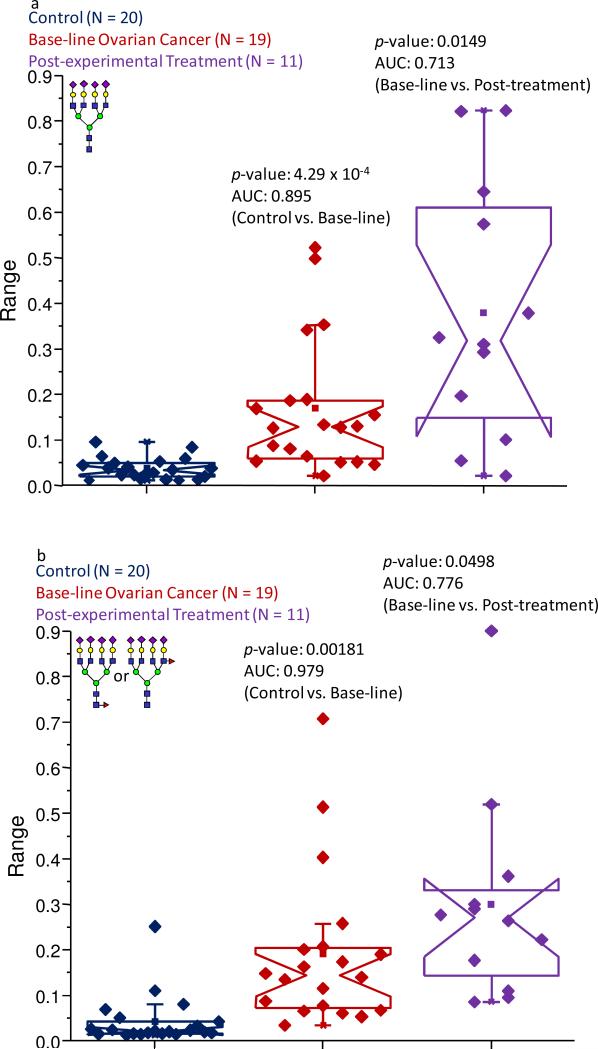
A total of six tetra-antennary structures were observed in this study and appeared to be key oligosaccharides in differentiating the different states-of-health. Three of these glycans were sialylated-only, featuring two, three, or four sialic acid units and were present in the MALDI spectra at m/z values of 3706.86, 4068.04, and 4430.03 respectively. The remaining tetra-branched structures were fucosylated and also possessed two, three, or four sialic acids that were recorded at m/z values of 3880.97, 4243.13, and 4603.32, respectively. All six of these highly-branched structures were observed at very low intensities in the control samples, oftentimes barely detectable. However, many of them appeared to be significantly elevated in their abundance levels in the baseline ovarian cancer samples, and were further increased in their expressions in the samples obtained following the first cycle of the experimental treatment. This trend was demonstrated for the a-fucosylated, tetra-antennary tetra-sialylated glycan (observed at an m/z value of 4428.22), the analogue of which produced the most intense average signal among the a-fucosylated tetra-branched structures, as can be seen in Figure 4a. This oligosaccharide contributed only 0.038% of the normalized intensity in the control pool and was not present in many of these samples. However, this structure accounted for 0.17% and 0.38% of the normalized intensities in the baseline ovarian cancer and post-experimental treatment cohorts, respectively. A statistical comparison of the data for this structure between the control samples and baseline ovarian cancer pool generated a p-value of 4.29 × 10⁻⁴ and an AUC score of 0.895, suggesting a high probability of this analyte to accurately predict presence of the pathological condition. Similarly, the statistical evaluation for this structure between pre-experimental treatment samples and those collected following the experimental therapy resulted in a p-value of 0.0149 and a moderately accurate AUC score of 0.713, which may allow the progression of the pathological condition to be followed. The statistical calculations for the bi- and tri-sialylated versions of this glycan also indicated a diagnostic potential to distinguish the control sample set from the ovarian cancer samples, based on p-values between 10-4 and 10-5 and accurate AUC scores. While the p-values were acceptable for the comparison between baseline ovarian cancer and the post-experimental treatment samples, only the information pertaining to the di-sialylated structure generated an adequate AUC score and was determined to be moderately accurate.
Figure 4.
Notched-box plots showing the relative abundances of (a) the tetra-sialylated tetra antennary structure (observed at an m/z value of 4429.22); and (b) the fucosylated tetra-sialylated tetra-antennary oligosaccharide (observed at an m/z value of 4603.32). The symbols are the same as those described in Figure 1.
Similarly to the tri-antennary structures, fucosylated tetra-antennary analytes were detected with elevated abundance levels in the baseline ovarian cancer samples and their abundances could be possibly correlated with the progression of the disease. This finding was reflected by the fucosylated tetra-antennary tetra-sialylated structure (recorded at an m/z value of 4603.32), representing an oligosaccharide that was present at very low intensities in the control samples, contributing only 0.015% to the total intensity. However, its abundance was increased to 0.083% and 0.172% of the normalized intensity in the baseline ovarian cancer samples and post-experimental treatment samples, respectively, as shown in Figure 4b. Further statistical analyses for this glycan added additional support for the observed increased expression levels; a p-value of 0.00181 and an AUC score of 0.979 were calculated when the control samples were compared to the baseline ovarian cancer set. The comparison demonstrating the progression of the disease resulted in a p-value of 0.0498 and an AUC value of 0.766. The other fucosylated tetra-antennary structures also seemed capable of distinguishing the control samples from the baseline ovarian cancer cohort. A statistical comparison between these sample sets for these analytes (observed at m/z values of 3882.97 and 4243.13) resulted in p-values less than 0.05 and accurate or highly accurate AUC scores. However, a comparison between baseline ovarian cancer samples and those acquired following the first cycle of the experimental treatment resulted in p-values greater than 0.05, indicating a limited potential for these incompletely-sialylated structures to follow disease progression.
Glycomic Analysis of IgG
IgG was co-isolated with albumin from blood serum samples using an Agilent albumin/IgG depletion column. While the glycans associated with IgG were observed in the conventional glycomic profiles, the possibility also existed that many of these structures may be associated with other proteins, hindering a more definitive analysis of the glycomic changes associated only with IgG. Therefore, a more reliable understanding of the possible glycomic alterations associated with this protein required its isolation from the remaining glycoproteins present in blood serum samples.
In the circulatory system, one of the primary roles of serum albumin is to function as a “transporter” of various small and macromolecular entities. To ensure that the observed glycans originated only from IgG and that the contributions from glycoproteins potentially complexed with albumin were minimal, a total of eight samples, chosen at random, were subjected to a tryptic digestion procedure and subsequently separated by nano-flow LC and detected and characterized by a Thermo LTQ-FT MS instrument. Based on our label-free quantitation method,46 more than 99.5% of the total signal observed in these runs were associated with albumin and IgG. On average, 32.5 peptides were observed for albumin, while about 8 peptides in each analysis were associated with IgG. Only an average of 0.5 peptides were observed from other proteins; these were all associated with tax1-binding protein 1. Therefore, we are confident that the particular glycans of interest in this part of the study (primarily neutral structures with varying degrees of galactosylation, as discussed later), originate only from IgG. Supplementary Table 1 presents the results of these runs, along with further details concerning data-base searching.
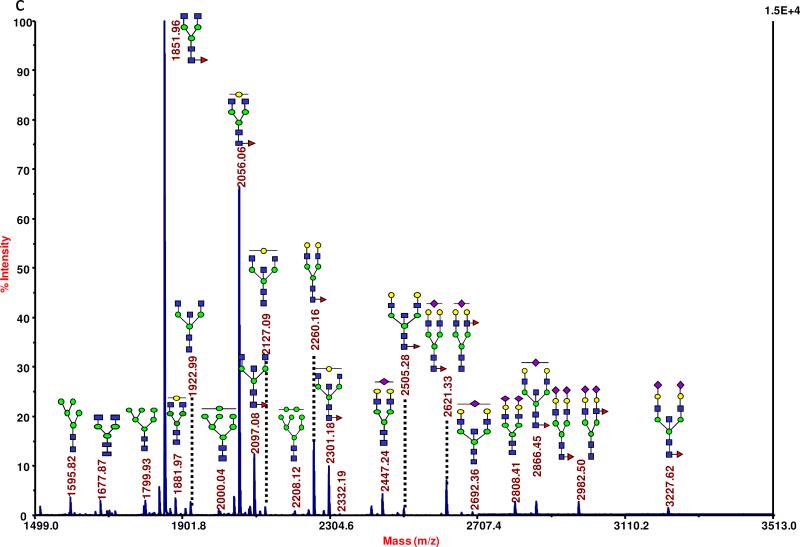
In total, 28 ions corresponding to known glycan structures were observed in the analysis of the IgG glycans. From this larger pool, 20 structures were neutral and could be further classified into high-mannose type structures (five were observed), galactosylated (nine of these structures were observed) and a-galactosylated (six of this type were detected). The remaining eight oligosaccharides were sialylated. In total, 13 different oligosaccharides possessed a fucose monosaccharide and these types of structures were sialylated, galactosylated, or a-galactosylated. Representative MALDI mass spectra for a control individual, a woman with late-stage OC prior to receiving the experimental treatment and following the first round of the experimental therapy, are presented as Figure 5a-c, showing many of these types of glycans.
Figure 5.
Representative MALDI MS-based profiles of IgG-associated glycans collected for (a) a control individual; (b) a baseline ovarian cancer sample; and (c) a post-experimental treatment sample. The symbols are the same as those described in Figure 1.
When the baseline ovarian cancer sample set was compared to the control cohort, 10 structures passed both criteria (a p-value less than 0.05 and an AUC score that was at least moderately accurate). Six of these structures were galactosylated, three glycans were a-galactosylated, and one oligosaccharide was sialylated. The information collected for three of these 10 structures resulted in AUC values that were accurate or highly accurate, while the remaining seven were determined to be moderately accurate. None of these glycans associated with IgG appeared to be significantly altered when the baseline ovarian cancer samples were compared to those collected following the first cycle of the experimental treatment. Table 2 summarizes the statistical figures for the IgG glycans and includes average normalized intensities, p-values, and AUC scores.
Table 2.
IgG-associated glycans detected in this study. Additionally included are the p-values and area-under-the-curve (AUC) scores for the comparisons of the control samples to the baseline ovarian cancer samples and for the baseline ovarian cancer samples to the post-experimental treatment samples.
| m/z | AVG REL INT (Control) | AVG REL INT (Ovarian Cancer) | AVG REL INT (End-stage) | p-value (Control v. Ovarian cancer) | p-value (Ovarian cancer v. End-stage) | AUC (Control vs. Ovarian cancer) | AUC (Ovarian cancer vs. End-stage) | |
|---|---|---|---|---|---|---|---|---|

|
1595.822 | 1.91 | 2.67 | 2.4 | 0.161 | 0.717 | ||

|
1677.875 | 0.892 | 1.03 | 1.14 | 0.486 | 0.762 | ||
|
1799.932 | 1.96 | 2.36 | 2.26 | 0.376 | 0.861 | ||

|
1810.946 | 0.155 | 0.243 | 0.243 | 2.92E-03 | 0.163 | 0.81 | 0.349 |

|
1840.952 | 0.524 | 0.752 | 0.579 | 0.015 | 0.129 | 0.737 | 0.311 |

|
1851.955 | 28.7 | 36.2 | 32.2 | 5.35E-03 | 0.184 | 0.753 | 0.345 |

|
1881.97 | 1.57 | 1.24 | 1.55 | 0.166 | 0.534 | ||

|
1922.996 | 0.434 | 0.702 | 0.723 | 3.47E-03 | 0.865 | 0.774 | 0.512 |

|
2004.033 | 0.441 | 0.563 | 0.539 | 0.343 | 0.887 | ||

|
2056.057 | 30.0 | 25.4 | 26 | 7.13E-05 | 0.608 | 0.142 | 0.541 |

|
2086.062 | 0.955 | 0.712 | 0.84 | 0.031 | 0.513 | 0.316 | 0.44 |

|
2097.075 | 4.5 | 5.51 | 4.85 | 0.056 | 0.379 | ||

|
2127.09 | 0.521 | 0.524 | 0.56 | 0.949 | 0.614 | ||

|
2208.121 | 0.525 | 0.622 | 0.601 | 0.544 | 0.918 | ||

|
2260.157 | 10.6 | 6.81 | 7.8 | 3.62E-04 | 0.301 | 0.179 | 0.641 |

|
2301.176 | 5.23 | 4.06 | 4.19 | 8.47E-03 | 0.769 | 0.252 | 0.454 |

|
2331.192 | 0.134 | 0.097 | 0.1 | 0.018 | 0.831 | 0.297 | 0.541 |

|
2412.217 | 0.0516 | 0.0995 | 0.112 | 0.037 | 0.673 | 0.687 | 0.622 |

|
2417.233 | 0.703 | 0.514 | 0.647 | 5.07E-03 | 0.115 | 0.213 | 0.698 |
|
|
2447.242 | 1.15 | 1.29 | 1.63 | 0.476 | 0.197 | ||

|
2505.279 | 0.849 | 0.543 | 0.573 | 0.013 | 0.772 | 0.282 | 0.646 |

|
2621.326 | 3.54 | 2.72 | 3.33 | 0.046 | 0.195 | 0.324 | 0.641 |

|
2692.36 | 0.208 | 0.183 | 0.197 | 0.598 | 0.790 | ||

|
2808.409 | 1.41 | 2.1 | 3.51 | 0.021 | 0.004 | 0.671 | 0.789 |

|
2866.441 | 1.69 | 1.04 | 1.03 | 0.618 | 0.978 | ||

|
2982.491 | 0.424 | 0.449 | 0.581 | 0.758 | 0.251 | ||

|
3227.612 | 0.249 | 0.235 | 0.274 | 0.798 | 0.534 |
Interestingly, no significant differences in the level of fucosylation were observed between the various sample types. Rather, for IgG-associated glycans, the presence (or lack thereof) of galactose residues appeared to be the more important factor for determining alterations in the relative intensity levels of glycans between the different sample sets. In this study, a total of nine galactosylated structures were detected and five of these oligosaccharides were statistically verified to be decreased in their relative abundances in the pathological sample sets (relative to the control samples). However, these structures appeared at similar abundances in both pre- and post- experimental treatment sample sets.
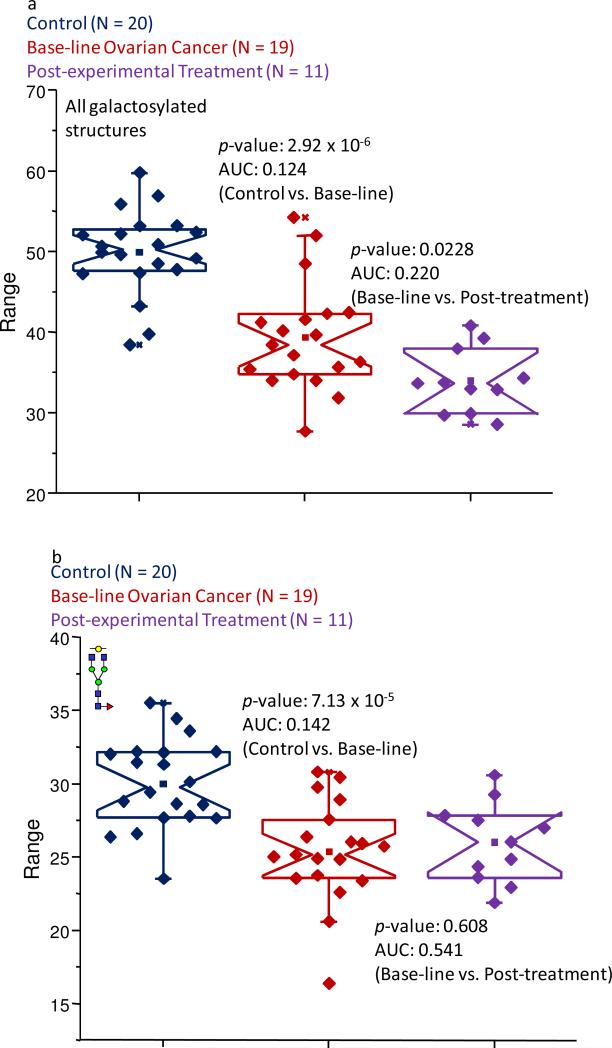
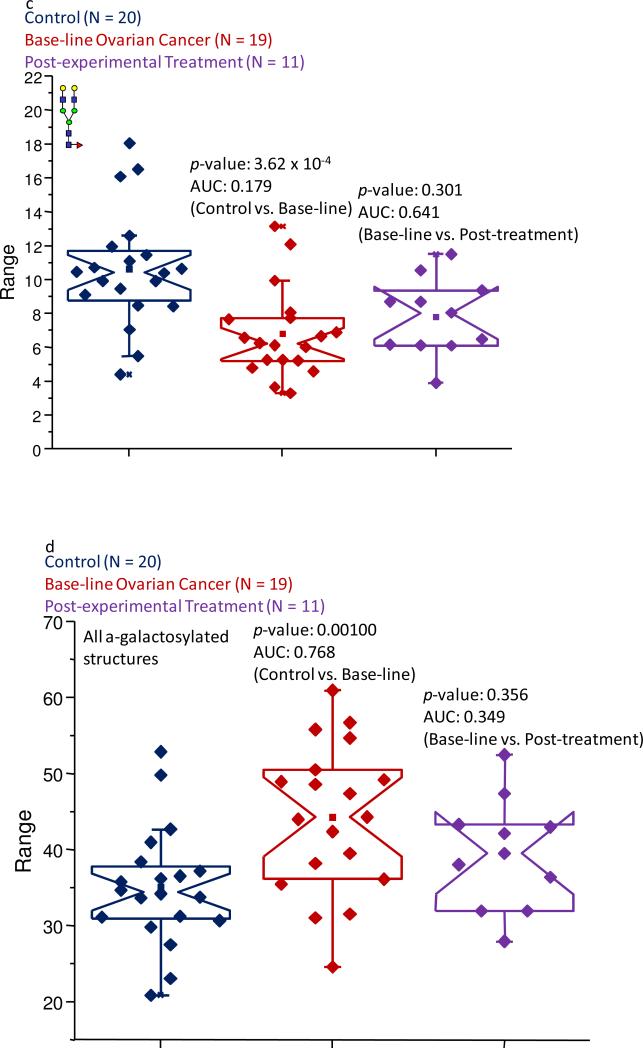
Further evidence of a significant decrease in the level of galactosylated glycans was observed by summing the normalized intensities of the nine members of this subclass. After performing this procedure, an average value of 49.9% was associated with these structures in the control pool, while only 39.4% of the normalized intensity was contributed by these glycans in the baseline ovarian cancer samples. Interestingly, this value was further decreased to 34.0% in the patients following the experimental treatment for the pathological condition. These decreases were shown to be statistically relevant, as based on a p-value of 2.92 × 10⁻⁶ and an AUC score of 0.124 when the control samples were compared to the baseline ovarian cancer set. When the baseline ovarian cancer and post-experimental treatment samples were compared, a p-value of 0.0228 was calculated and an AUC score of 0.220 was calculated. The results of these comparisons are presented as Figure 6a.
Figure 6.
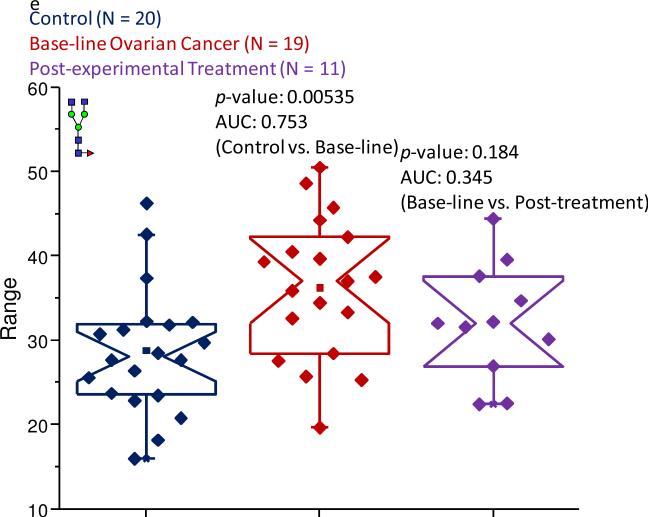
Notched-box plots demonstrating (a) the overall decreased abundance of galactosylated structures in the baseline ovarian cancer and post-experimental treatment sample sets; (b) the decreased abundance of the mono-galactosylated biantennary structure due to the pathological condition; (c) the decrease level of the di-galactosylated glycan in the disease samples; (d) the increased abundance of the a-galactosylated structures in the pathological samples; and (d) the increased level of the core-fucosylated, a-galactosylated bi-antennary structure in the samples associated with the baseline ovarian cancer samples and the post-experimental treatment set. All of these subclasses and structures were derived from IgG. The symbols are the same as those described in Figure 1.
Among the glycans that contributed the most to the decreased expression levels were those that were observed at m/z values of 2056.03 and 2260.16, and are shown as Figure 6b-c, respectively. These structures are both neutral fucosylated bi-antennary glycans with one or two galactose units, respectively. In the control samples, these structures contributed 30.0% and 10.6% to the total ion intensity, while in the baseline ovarian cancer samples, these values were 24.4% and 6.81%, respectively. These figures for the specific glycans were approximately the same in the samples that were provided by the women following the experimental treatment. The data collected for these structures resulted in p-values in the 10-4-10-5 range and accurate AUC values, when the baseline ovarian cancer patients were compared to the control group of women. However, since the information collected for these glycans resulted in p-values greater than 0.05, when the baseline ovarian cancer samples were compared to those collected following the first cycle of the experimental treatment, it appears that these structures could not be used to follow the disease progression.
Conversely, the level of a-galactosylated glycans appeared to be increased in their relative abundances in the baseline ovarian cancer samples, as shown in Figure 6d. Four of these types of glycans were observed, however, only two passed both statistical tests and the resulting AUC scores were determined to be moderately accurate. To determine the changes associated with all four structures, their normalized intensity values were summed and statistically compared. This procedure demonstrated that 34.3% of the total signal was associated with these structures in the control sample set, while these oligosaccharides were responsible for 44.5% of the total signal in the baseline ovarian cancer samples. This value was about 39.5% for those samples obtained from the patients following the first cycle of the experimental treatment. The increased values between the control samples and baseline ovarian cancer appeared to be statistically significant, based on a p-value of 1.00 × 10⁻³ and an AUC score of 0.768, while the apparent decrease between the baseline ovarian cancer samples and those collected following the first cycle of the experimental therapy was determined to be insignificant.
The core-fucosylated, a-galactosylated biantennary structure was a representative glycan of this class that demonstrated an increased abundance of a-galactosylated structures in the pathological samples. In the control cohort, this structure contributed 28.7% to the total ion intensity, while in the baseline ovarian cancer samples, this glycan contributed 36.2% and was approximately the same in the samples provided by the women following the experimental treatment for the disease. The observed increased expression level between the control and baseline ovarian cancer samples was statistically supported by a p-value in the 10-3 range and a moderately accurate AUC score. Because of the very similar abundances of this oligosaccharide in both sets of pathological sample types, the information collected for this structure did not provide a reliable p-value. Figure 6e presents the notched-box plots comparing the normalized intensities of this structure for each state-of-health.
Analysis of Fucosylated Structures
The levels of fucosylation have been shown to be elevated in a number of cancers22,23,26,27,29,31,32 and some evidence indicates increased fucosylation occurs in ovarian cancer as well.23 Moreover, changes in the abundances of the location of the fucose unit may also be important in cancer progression, since this monosaccharide is important in sialyl Lewis epitopes. To understand in more detail the abundances of fucose units in its different locations (either on the reducing terminal GlcNAc of the chitobiose core or on an outer-arm), the previously-released glycan samples were subjected to an exoglycosidase digestion using a non-specific sialidase and a β1-4,6 galactosidase. During this digestion, fucose monosaccharides located on an outer-arm inhibit the action of the β-galactosidase, leaving the galactose attached to its GlcNAc. Therefore, two isomeric structures that differed only in the location of a fucose moiety will acquire different molecular masses as a result of the digestion procedure. This mass difference is observable by MALDI MS and allows changes in the ratios of core- to outer-arm fucosylation to be monitored.
Following the exoglycosidase digestion and subsequent permethylation and mass-spectral interrogation, a total of 11 distinct m/z values were observed that could be correlated to products of the digestion procedure. Three a-fucosylated products were observed, which were determined to be bi-, tri-, and tetra-antennary features, while their three core- and outer-arm fucosylated analogues were also seen. Additionally, signals were observed that could be associated with tri- and tetra-antennary doubly-fucosylated (both core and outer-arm) structures.
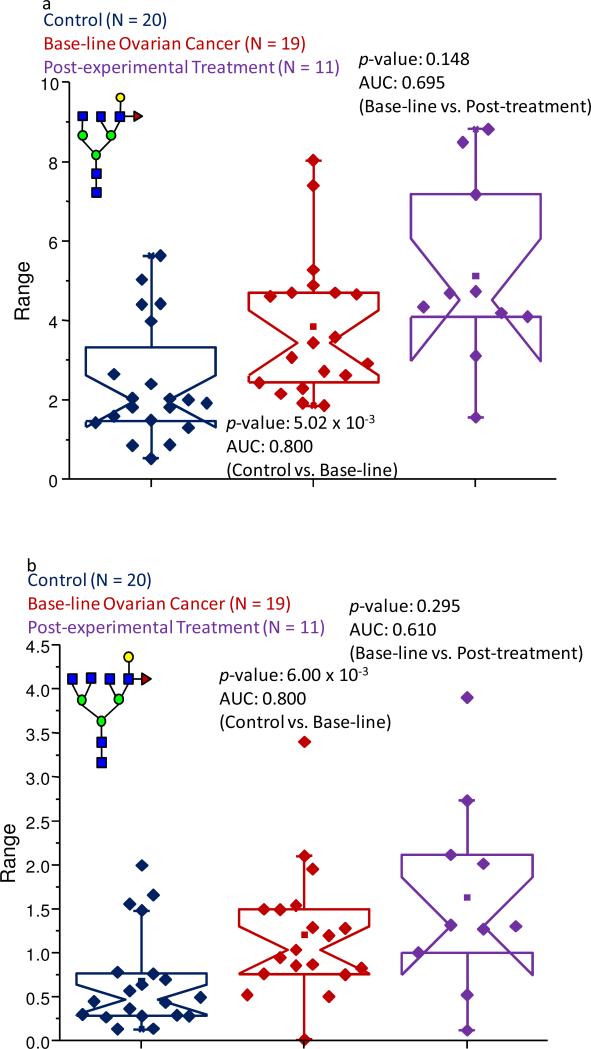
The data collected for two structures were observed to be elevated in the baseline ovarian cancer samples relative to the control set, as is shown in Figure 7a-b. These two ions were detected at m/z values of 2301.18 and 2546.31, i.e. the masses which corresponded to tri- and tetra-branched structures possessing an outer-arm fucose unit. However, the abundance levels of both of these structures appeared to be approximately equal in the baseline cancer and post-experimental treatment sample sets. In the control sample set, the ion observed at an m/z value of 2301.18 (shown as Figure 7a) accounted for only 2.0% of the average normalized intensity, while in the baseline ovarian cancer sample set, this structure contributed on average nearly 4% to the total intensity. Further statistical testing resulted in a p-value of 5.02 × 10⁻³ and an AUC score of 0.800. While an average intensity value of nearly 5.0% was seen in the samples collected from the individuals following the first cycle of the experimental treatment, any further elevated levels of this structure could not be statistically supported.
Figure 7.
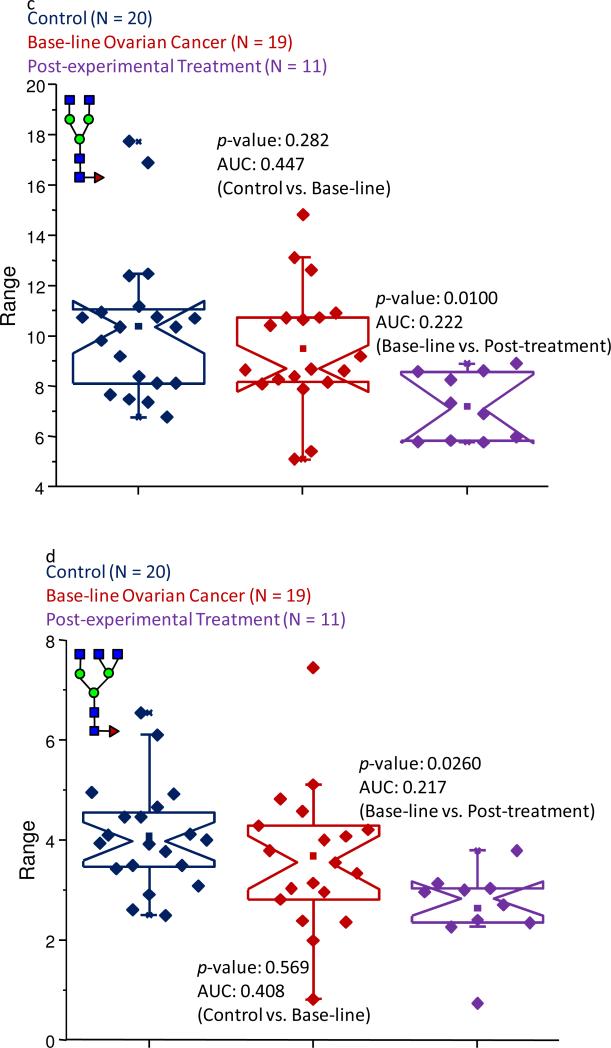
Notched-box plots presenting changes in abundance levels of structures generated by the exoglycosidase digestion of glycans using a non-specific sialidase and a β1-4,6 galactosidase. The increased levels of outer-arm fucosylation are shown in (a) for the tri-antennary digestion product; and (b) for the tetra-antennary structure. Decreased levels of core fucosylation in the post-experimental treatment samples were observed for (c) the bi-antennary product; and (d) the tri-antennary structure. The symbols are the same as those described in Figure 1.
Similar results were obtained for the ion recorded at an m/z value of 2546.31 (refer to Figure 7b). In the control sample set, this ion accounted for an average of 0.68% of the total intensity and was responsible for nearly 1.3% of the total intensity in the baseline ovarian cancer sample set. The statistical calculations for the comparison between these two cohorts resulted in a p-value of 6.00 × 10⁻³ and an AUC score of 0.800. Similarly to the ion observed at an m/z value of 2301.18, the ion appearing at an m/z value of 2530.31 seemed to be further enhanced in its expression level in the samples provided by the women following the experimental therapy, but once again, the comparison between the different pathological sample sets did not meet the statistical criteria for significance.
The analysis of the products of the exoglycosidase digestions revealed that two core-fucosylated structures, observed at m/z values of 1851.96 and 2097.08, which corresponded to core-fucosylated bi- and tri-antennary structures, respectively, were suppressed in their expression levels in the post-treatment sample cohort, when compared to the baseline ovarian cancer sample set. This trend is depicted in Figure 7c-d. Interestingly, the abundance levels of both of these structures did not appear to be different when the control sample set was compared to the baseline ovarian cancer samples. The bi-antennary feature (see Figure 7c) accounted for average normalized intensity values of 10.9% and 9.5% in the control and baseline ovarian cancer cohorts, respectively, and this structure contributed an average of only 7.2% to the total intensity in the samples collected following the first cycle of the experimental treatment. The subsequent statistical comparison between the pre- and post- experimental treatment sample cohorts produced a p-value of 0.0100 and AUC score of 0.222.
The core-fucosylated tri-antennary digestion product (see Figure 7d) followed a similar trend as the bi-antennary feature. This structure was associated with average normalized intensity values of 4.1% and 3.8% in the control and the baseline ovarian cancer sample sets, respectively, while a statistical evaluation of the data indicated that such a slight decrease was not significant. This particular structure contributed only an average normalized intensity of 2.6% in the post-experimental treatment samples and when this group was compared to the baseline ovarian cancer sample set, acceptable statistical figures were calculated. For this comparison, the p-value was determined to be 0.0260, while the AUC score was 0.217.
Discussion
In this study, microliter volumes of serum samples were sufficient for extracting meaningful glycomic profiles. The samples were provided by healthy individuals and women with recurrent OC and significant alterations in their glycomic profiles were identified.42 The highly reproducible measurements were subjected to a battery of statistical evaluations to determine the significance of any glycomic alterations between the various sample sets. Each sample was analyzed by a “traditional” glycomic profiling experiment,43 as well as an investigation of the glycans associated with IgG, and a more detailed assessment of the location of fucose residues has also been added. Each of these tests demonstrated several variations in their respective MALDI MS recordings of the oligosaccharide patterns that could distinguish the various states-of-health.
Perhaps most notably, the N-linked glycomic profiles revealed increased expression levels of the tri- and tetra-antennary oligosaccharides with varying degrees of sialylation and fucosylation in the baseline samples provided by women diagnosed with ovarian cancer before receiving the experimental treatment. This trend was oftentimes further accentuated in the samples following the first cycle of the experimental treatment. Concomitantly, the abundance levels of the bisecting structures were suppressed and could be tentatively correlated with the progression of the pathological condition, while, conversely, the overall level of fucosylation was increased in the samples provided by ovarian cancer patients. The analysis of the IgG-associated glycans demonstrated an increased expression level of a-galactosylated structures, while the galactosylated oligosaccharides generally appeared to be suppressed in their abundances, which is in good agreement with a previous (methodologically different) study of blood serum samples provided by patients diagnosed with ovarian cancer.23 However, in this study, the total levels of both of these classes of IgG-derived glycans were very similar in both the pre- and post- experimental treatment sample sets. This study also demonstrates that the level of outer-arm fucosylation increases due to the pathological condition, as also noted in the previous investigation using a different analytical methodology.23 Interestingly, following the experimental treatment, patients with advanced ovarian cancer appeared to feature lowered abundance levels of core fucosylation.
While many of the patients enrolled in the experimental drug trial did not respond favorably to the drug combination, resulting in cancer progression,42 which may be reflected in the glycomic data presented here, the ability of the drug combination (imatinib and docetaxel) to induce an apparent acute-phase protein response and alter glycosylation patterns is unknown, and their combined effects on the liver cannot be discounted. However, when different abundance levels of various glycans or their subclasses were observed, the trend between the control samples and the baseline ovarian cancer samples were often accentuated in the post-experimental treatment samples, at least partly suggesting a further progression of the disease. Further experiments using these drugs in tandem conducted on liver cell lines may provide some insight into their effects on the glycobiology of the liver.
The glycomic changes observed in this study most likely occurred due to the altered activity of various glycosyltransferases. The mRNA expression levels of several of these enzymes have been studied in both healthy ovarian and cancer tissues.47 According to this study, the transcripts encoding the gene for GlcNAc-transferase III (GnT III), which catalyzes the addition of the “bisecting” GlcNAc, were elevated in the diseased tissue, along with those for GlcNAc-transferases IV and V, the enzymes which create the tri- and tetra-antennary structures.47 To confirm that the enhanced mRNA expression abundances resulted in different oligosaccharides levels in the different tissues, the products of the glycosyltransferase actions were quantitated by monitoring differential binding levels of tissue-derived glycoproteins to various lectins. These studies indicated that the relative abundances of the bisecting structures, tri- and tetra-antennary oligosaccharides, and the highly-branched structures possessing a core-attached fucose were increased in the pathological tissues. Further targeted glycoproteomic studies of blood serum revealed increased levels of core fucosylation associated with the protein POSTN in samples provided by women diagnosed with ovarian cancer.48 The core-fucosylated analogue of this protein was only observed in the cancer patients; thus, this protein most likely originated from the tumor cells after being released into the circulatory system.48
With the current state-of-the-art glycomic technology, it seems unlikely that alterations of the carbohydrate patterns of proteins directly associated with the tumor, which are expected to present in the serum at pg/ml concentrations,49 will be observed in whole serum containing many glycoproteins present at low- to mid-mg/ml concentrations. Therefore, the altered abundance levels of the glycans are observed in this work are most likely associated with glycoproteins synthesized and secreted by the liver, whose glycosylation machinery is oftentimes altered by various diseases, including various cancers and inflammatory conditions.4 Altered glycosylation patterns have been demonstrated by stimulating the hepatic cell line HuH-7 with interleukin 6,50 a signaling molecule also secreted by the ovarian cancer cells. Following stimulation, increased levels of more highly-branched α1-acid glycoprotein (AGP) were observed,51 which seems to suggest the increased levels of tri- and tetra-branched structures observed in this study could be partly associated with aberrantly glycosylated AGP. Additionally, increased branching and elevated levels of fucosylation have also been reported for haptoglobin in the sera of patients diagnosed with ovarian cancer,52-54 which may also partially explain the increased levels of the more highly-branched structures observed in our work. These previous studies seem to hint that increased abundances of the highly-branched oligosaccharides observed in this study may be at least partly associated with an acute-phase response.
A rigorous evaluation of the changes in the oligosaccharide patterns associated with the acute-phase glycoproteins and their abundances appears to be an important next step, since a number of these types of analytes have been implicated to be altered in various diseases. While haptoglobin is often observed to have increased levels of fucosylation associated with its glycan chains in several different cancers,55-59 their degree of branching also appears to be enhanced in several examples. A recent report demonstrated that increased levels of tri-antennary structures were present in serum samples provided by the patients diagnosed with prostate cancer and were not readily observable in control individuals or those with benign prostate conditions.58 Interestingly, the same research group reported that haptoglobin did not appear to be modified with increased levels of tri-branched structures in colorectal cancer,59 indicating that there might be a certain level of specificity that is associated with the glycan profiles associated with individual glycoproteins for different pathological conditions. Increased abundances of tri- and tetra-branched structures and fucosylation of glycans attached to haptoglobin have also been recently reported for lung cancer.55,56 Using a complementary technique, increased levels of sialylation, which may suggest increased branching, have also been observed for haptoglobin derived from the sera of lung cancer patients and were found to be correlated to the stage of malignancy.60
Increased branching has also been observed on other acute-phase proteins. Elevated levels of fucosylated- and a-fucosylated-triantennary glycans and tetra-branched structures were previously reported for transferrin in serum samples collected from hepatocellular carcinoma patients and their levels significantly lower in control samples.61 Using an ultra-sensitive fluorescence-based detection scheme, increased levels of tetra-antennary oligosaccharides were detected on hemopexin purified from serum samples provided by patients diagnosed with hepatocellular carcinoma.62 Hemopexin isolated from sera donated by control individuals and those with confirmed cirrhosis did not exhibit this type of structure.62
At the present time, the specific glycoproteins which are responsible for the increased levels of tri- and tetra-antennary structures detected in this study remain unknown. However, an active area of research in our laboratory is the development of suitable microscale methods to study in more detail the classes of glycoproteins and, ultimately, the specific proteins that feature the enhanced glycosylation patterns for OC and other pathological conditions.
The increased levels of tri- and tetra-antennary structures may also at least partially explain the decreased abundances of the bisecting structures. The enzymes that catalyze the addition of the bisecting GlcNAc (GnT III) and the addition of the third branching monosaccharide (GnT IV) compete for the same substrate. Once becoming bisected, the action of GnT IV is inhibited and, conversely, tri- and tetra-branched structures appear to inhibit the activity of GnT III. Therefore, increased levels of tri- and tetra-antennary structures should correlate with a decrease in the abundances of bisected glycans. Interestingly, in this study, the bisected structures associated with IgG did not appear to be altered among the various states-of-health; only in the N-linked profiles were these types of glycans lowered in their abundances.
Even though the bisecting structures associated with IgG did not appear to be altered in the different states-of-health, differences in the glycomic profiles provided by this protein were observed. The main alteration to the IgG-associated profiles was a general increase in the levels of a-galactosylated structures, most notably for the core-fucosylated, a-galactosylated bi-antennary structure observed at an m/z value of 1851.96. A similar increase in the level of this IgG-associated glycan has been previously reported for ovarian cancer24,63 and it appears that this structure is also elevated in a number of diseases, including prostate cancer,64 as well as rheumatoid arthritis.65 Therefore, elevated levels of this particular structure may be associated more generally with chronic inflammation. Immunoglobulins possessing this feature have been proposed as possible substrates for the mannose-binding lectin (MBL). After binding, MBL may activate the complement factor response system. Increased levels of these types of glycans associated with IgG may aid in this response system.
A primary topic of investigation in our laboratory focuses on the specificity of the glycomic changes associated with a particular cancer. Considering that late-stage cancer typically induces an acute-phase response that mimics inflammation,4 where the levels of several highly-abundant serum glycoproteins are increased in the concentrations (and a few abundant glycoproteins, most notably transferrin, are decreased in their amounts), it may seem logical that certain alterations may be shared among different cancers. This observation was noted for a comparison between our previous serum-based analyses for breast cancer patients29,30 and the present OC study, in which the patients enrolled in both studies were approximately the same age. Perhaps most significantly, our data for both pathological conditions indicates an increased abundance of fucosylated and sialylated glycans in both ovarian and breast cancers.29,30 Interestingly, a fucosylated, tri-antennary tri-sialylated structure was observed to be significantly elevated in both conditions,29,30 indicating that its increased levels in pathological conditions is not specific to any given cancer. This particular glycan was also observed to be increased in its relative abundance in breast cancer blood serum samples in a study conducted by a different laboratory using different detection methods.22 Additionally, this structure was also observed as elevated in a breast cancer cell line and upon treatment with antibody drugs, its abundance level was suppressed.66 This seems to hint that even though similar trends for some structures may exist between different diseases, glycomic measurements based on mass spectrometry show potential to track disease progression and regression.
However, a comparison of the results with our breast cancer studies29,30 to those presented in this report indicate that alterations associated with certain classes of glycans did appear to be unique to ovarian cancer, when compared to breast cancer. The glycomic testing of blood serum samples provided by the patients diagnosed with breast cancer indicated that the levels of the tri-antennary structures were decreased in their expression levels and their abundances could be correlated to disease progression.29,30 The results of the present study demonstrate that these types of structures were increased in their abundances in ovarian cancer. Additionally, the glycomic studies of breast cancer reported that the amounts of total sialylation decreased as the breast cancer progressed to its later stages.29,30 Even though the trend could not be statistically confirmed for ovarian cancer, the total level of sialylation appeared to be increased in its abundance level during its apparent progression in the samples used in this study, perhaps due to the increased levels of tri- and tetra-branched structures, which would provide additional locations for sialylation. Further, another class of glycans that may potentially differentiate ovarian and breast cancers is the group composed of the neutral fucosylated structures.30 In breast cancer, these types of glycans appeared to be increased in their relative abundances, while patients diagnosed with ovarian cancer tended to feature decreased expression levels of these carbohydrates. This finding was significantly different in the later stages of breast cancer. Our breast cancer results also showed a general increase in the bisecting class of glycans, which could be correlated with disease progression, while the results presented here indicate that these types of structures are actually decreased in their abundance levels and their levels may potentially be associated with the progression of the disease. A comparison of these two studies seems to indicate that the possibility exists that glycomic measurements may be capable of distinguishing different disease states, though a more in-depth investigation is warranted.
Conclusions
In this study, serum samples were obtained from control individuals and patients with late-stage recurrent ovarian cancer enrolled in an experimental therapeutic trial (before and after first cycle of treatment). Each of these specimens was subjected to a battery of glycomic tests, including a comprehensive N-linked glycomic analysis, an investigation of IgG-associated glycans, and a more in-depth analysis of the location of the fucose units. The N-linked glycomic analysis indicated a general increase in the level of tri- and tetra-antennary structures with varying degrees of sialylation and fucosylation. A concomitant decrease in the levels of the bisecting oligosaccharides was also observed in these profiles. The analysis of the IgG-associated glycans demonstrated an increase in their abundance levels of a-galactosylated structures in the cancer samples, which is in good agreement with previous glycomic analyses of ovarian cancer patient sera. The levels of galactosylated oligosaccharides derived from IgG appeared to be decreased in their expression levels in the pathological samples. Using a non-specific sialidase and a β1-4,6 galactosidase, the location of the fucose monosaccharides were monitored. In the cancer samples, outer-arm fucosylation appeared to be the favored location. Interestingly, the levels of core-fucosylated structures appeared to be decreased in their expression levels and this change was only observed in samples following the experimental treatment. While these results were obtained from samples provided by women diagnosed with late-stage ovarian cancer, further studies utilizing serum from women with stage I/II disease are warranted to determine if changes in glycomic profiles or the abundance levels of various glycoproteins can be used for early detection of OC.
Supplementary Material
Acknowledgements
This work was supported by the following grants: UO1 CA128535-03 (awarded to MVN with a subcontract to the Hoosier Oncology Group, Inc.) from the National Cancer Institute; GM24349 (awarded to MVN) from the National Institute of General Medical Sciences, RR018942 from the National Center for Research Resources for the National Center for Glycomics and Glycoproteomics at Indiana University, and NCT00216112 from the U.S. Department of Health and Human and Services (awarded to DEM). Further support was provided by a Mentored Research Scholar Grant from the American Cancer Society (awarded to DEM).
Footnotes
Supporting Information. Supporting Information Available: This material is available free of charge via the Internet at http://pubs.acs.org.
References
- 1.Dube DH, Bertozzi CR. Glycans in cancer and inflammation--potential for therapeutics and diagnostics. Nat. Rev. Drug Discov. 2005;4:477–88. doi: 10.1038/nrd1751. [DOI] [PubMed] [Google Scholar]
- 2.Varki A. Biological roles of oligosaccharides: all of the theories are correct. Glycobiology. 1993;3:97–130. doi: 10.1093/glycob/3.2.97. [DOI] [PMC free article] [PubMed] [Google Scholar]
- 3.Ohtsubo K, Marth JD. Glycosylation in cellular mechanisms of health and disease. Cell. 2006;126:855–67. doi: 10.1016/j.cell.2006.08.019. [DOI] [PubMed] [Google Scholar]
- 4.Arnold JN, Saldova R, Hamid UM, Rudd PM. Evaluation of the serum N-linked glycome for the diagnosis of cancer and chronic inflammation. Proteomics. 2008;8:3284–93. doi: 10.1002/pmic.200800163. [DOI] [PubMed] [Google Scholar]
- 5.Pan S, Chen R, Aebersold R, Brentnall TA. Mass spectrometry based glycoproteomics--from a proteomics perspective. Mol. Cell. Proteomics. 2011;10:R110 003251. doi: 10.1074/mcp.R110.003251. [DOI] [PMC free article] [PubMed] [Google Scholar]
- 6.Reis CA, Osorio H, Silva L, Gomes C, David L. Alterations in glycosylation as biomarkers for cancer detection. J. Clin. Pathol. 2010;63:322–9. doi: 10.1136/jcp.2009.071035. [DOI] [PubMed] [Google Scholar]
- 7.Scholler N, Crawford M, Sato A, Drescher CW, O'Briant KC, Kiviat N, Anderson GL, Urban N. Bead-based ELISA for validation of ovarian cancer early detection markers. Clin. Cancer Res. 2006;12:2117–24. doi: 10.1158/1078-0432.CCR-05-2007. [DOI] [PMC free article] [PubMed] [Google Scholar]
- 8.Patel S, Sumitra G, Koner BC, Saxena A. Role of serum matrix metalloproteinase-2 and -9 to predict breast cancer progression. Clin. Biochem. 2011;44:869–72. doi: 10.1016/j.clinbiochem.2011.04.019. [DOI] [PubMed] [Google Scholar]
- 9.Yue T, Goldstein IJ, Hollingsworth MA, Kaul K, Brand RE, Haab BB. The prevalence and nature of glycan alterations on specific proteins in pancreatic cancer patients revealed using antibody-lectin sandwich arrays. Mol. Cell. Proteomics. 2009;8:1697–707. doi: 10.1074/mcp.M900135-MCP200. [DOI] [PMC free article] [PubMed] [Google Scholar]
- 10.Weivoda S, Anderson JD, Skogen A, Schlievert PM, Fontana D, Schacker T, Tuite P, Dubinsky JM, Jemmerson RJ. ELISA for human serum leucine-rich alpha-2-glycoprotein-1 employing cytochrome c as the capturing ligand. J. Immunol. Methods. 2008;336:22–9. doi: 10.1016/j.jim.2008.03.004. [DOI] [PMC free article] [PubMed] [Google Scholar]
- 11.Schorge JO, Drake RD, Lee H, Skates SJ, Rajanbabu R, Miller DS, Kim JH, Cramer DW, Berkowitz RS, Mok SC. Osteopontin as an adjunct to CA125 in detecting recurrent ovarian cancer. Clin. Cancer Res. 2004;10:3474–8. doi: 10.1158/1078-0432.CCR-03-0365. [DOI] [PubMed] [Google Scholar]
- 12.Blixt O, Head S, Mondala T, Scanlan C, Huflejt ME, Alvarez R, Bryan MC, Fazio F, Calarese D, Stevens J, Razi N, Stevens DJ, Skehel JJ, van Die I, Burton DR, Wilson IA, Cummings R, Bovin N, Wong CH, Paulson JC. Printed covalent glycan array for ligand profiling of diverse glycan binding proteins. Proc. Natl. Acad. Sci. USA. 2004;101:17033–8. doi: 10.1073/pnas.0407902101. [DOI] [PMC free article] [PubMed] [Google Scholar]
- 13.Chen P, Liu Y, Kang X, Sun L, Yang P, Tang Z. Identification of N-glycan of alpha-fetoprotein by lectin affinity microarray. J. Cancer Res. Clin. Oncol. 2008;134:851–60. doi: 10.1007/s00432-008-0357-7. [DOI] [PMC free article] [PubMed] [Google Scholar]
- 14.Jacob F, Goldstein DR, Bovin NV, Pochechueva T, Spengler M, Caduff R, Fink D, Vuskovic MI, Huflejt ME, Heinzelmann-Schwarz V. Serum antiglycan antibody detection of nonmucinous ovarian cancers by using a printed glycan array. Int. J. Cancer. 2012;130:138–46. doi: 10.1002/ijc.26002. [DOI] [PMC free article] [PubMed] [Google Scholar]
- 15.Liang CH, Wu CY. Glycan array: a powerful tool for glycomics studies. Expert Rev. Proteomics. 2009;6:631–45. doi: 10.1586/epr.09.82. [DOI] [PubMed] [Google Scholar]
- 16.Lu KH, Patterson AP, Wang L, Marquez RT, Atkinson EN, Baggerly KA, Ramoth LR, Rosen DG, Liu J, Hellstrom I, Smith D, Hartmann L, Fishman D, Berchuck A, Schmandt R, Whitaker R, Gershenson DM, Mills GB, Bast RC., Jr. Selection of potential markers for epithelial ovarian cancer with gene expression arrays and recursive descent partition analysis. Clin. Cancer Res. 2004;10:3291–300. doi: 10.1158/1078-0432.CCR-03-0409. [DOI] [PubMed] [Google Scholar]
- 17.Reid JD, Parker CE, Borchers CH. Protein arrays for biomarker discovery. Curr. Opin. Mol. Ther. 2007;9:216–21. [PubMed] [Google Scholar]
- 18.Duffy MJ, Bonfrer JM, Kulpa J, Rustin GJ, Soletormos G, Torre GC, Tuxen MK, Zwirner M. CA125 in ovarian cancer: European Group on Tumor Markers guidelines for clinical use. Int. J. Gynecol. Cancer. 2005;15:679–91. doi: 10.1111/j.1525-1438.2005.00130.x. [DOI] [PubMed] [Google Scholar]
- 19.Badgwell D, Bast RC., Jr. Early detection of ovarian cancer. Dis. Markers. 2007;23:397–410. doi: 10.1155/2007/309382. [DOI] [PMC free article] [PubMed] [Google Scholar]
- 20.Bast RC, Jr., Badgwell D, Lu Z, Marquez R, Rosen D, Liu J, Baggerly KA, Atkinson EN, Skates S, Zhang Z, Lokshin A, Menon U, Jacobs I, Lu K. New tumor markers: CA125 and beyond. Int. J. Gynecol. Cancer. 2005;15(Suppl 3):274–81. doi: 10.1111/j.1525-1438.2005.00441.x. [DOI] [PubMed] [Google Scholar]
- 21.Arnold JN, Royle L, Dwek RA, Rudd PM, Sim RB. Human immunoglobulin glycosylation and the lectin pathway of complement activation. Adv. Exp. Med. Biol. 2005;564:27–43. doi: 10.1007/0-387-25515-X_9. [DOI] [PubMed] [Google Scholar]
- 22.Abd Hamid UM, Royle L, Saldova R, Radcliffe CM, Harvey DJ, Storr SJ, Pardo M, Antrobus R, Chapman CJ, Zitzmann N, Robertson JF, Dwek RA, Rudd PM. A strategy to reveal potential glycan markers from serum glycoproteins associated with breast cancer progression. Glycobiology. 2008;18:1105–18. doi: 10.1093/glycob/cwn095. [DOI] [PubMed] [Google Scholar]
- 23.Saldova R, Royle L, Radcliffe CM, Abd Hamid UM, Evans R, Arnold JN, Banks RE, Hutson R, Harvey DJ, Antrobus R, Petrescu SM, Dwek RA, Rudd PM. Ovarian cancer is associated with changes in glycosylation in both acute-phase proteins and IgG. Glycobiology. 2007;17:1344–56. doi: 10.1093/glycob/cwm100. [DOI] [PubMed] [Google Scholar]
- 24.Saldova R, Wormald MR, Dwek RA, Rudd PM. Glycosylation changes on serum glycoproteins in ovarian cancer may contribute to disease pathogenesis. Dis. Markers. 2008;25:219–32. doi: 10.1155/2008/601583. [DOI] [PMC free article] [PubMed] [Google Scholar]
- 25.Andersen JD, Boylan KL, Xue FS, Anderson LB, Witthuhn BA, Markowski TW, Higgins L, Skubitz AP. Identification of candidate biomarkers in ovarian cancer serum by depletion of highly abundant proteins and differential in-gel electrophoresis. Electrophoresis. 2010;31:599–610. doi: 10.1002/elps.200900441. [DOI] [PMC free article] [PubMed] [Google Scholar]
- 26.Kang P, Madera M, Alley WR, Jr., Goldman R, Mechref Y, Novotny MV. Glycomic alterations in the highly-abundant and lesser-abundant blood serum protein fractions for patients diagnosed with hepatocellular carcinoma. Int. J. Mass. Spectrom. 2011;305:185–198. doi: 10.1016/j.ijms.2010.11.007. [DOI] [PMC free article] [PubMed] [Google Scholar]
- 27.Goldman R, Ressom HW, Varghese RS, Goldman L, Bascug G, Loffredo CA, Abdel-Hamid M, Gouda I, Ezzat S, Kyselova Z, Mechref Y, Novotny MV. Detection of hepatocellular carcinoma using glycomic analysis. Clin. Cancer Res. 2009;15:1808–13. doi: 10.1158/1078-0432.CCR-07-5261. [DOI] [PMC free article] [PubMed] [Google Scholar]
- 28.Callewaert N, Van Vlierberghe H, Van Hecke A, Laroy W, Delanghe J, Contreras R. Noninvasive diagnosis of liver cirrhosis using DNA sequencer-based total serum protein glycomics. Nat. Med. 2004;10:429–34. doi: 10.1038/nm1006. [DOI] [PubMed] [Google Scholar]
- 29.Kyselova Z, Mechref Y, Kang P, Goetz JA, Dobrolecki LE, Sledge GW, Schnaper L, Hickey RJ, Malkas LH, Novotny MV. Breast cancer diagnosis and prognosis through quantitative measurements of serum glycan profiles. Clin. Chem. 2008;54:1166–75. doi: 10.1373/clinchem.2007.087148. [DOI] [PubMed] [Google Scholar]
- 30.Alley WR, Jr., Madera M, Mechref Y, Novotny MV. Chip-based reversed-phase liquid chromatography-mass spectrometry of permethylated N-linked glycans: a potential methodology for cancer-biomarker discovery. Anal. Chem. 2010;82:5095–106. doi: 10.1021/ac100131e. [DOI] [PMC free article] [PubMed] [Google Scholar]
- 31.Mechref Y, Hussein A, Bekesova S, Pungpapong V, Zhang M, Dobrolecki LE, Hickey RJ, Hammoud ZT, Novotny MV. Quantitative serum glycomics of esophageal adenocarcinoma and other esophageal disease onsets. J. Proteome Res. 2009;8:2656–66. doi: 10.1021/pr8008385. [DOI] [PMC free article] [PubMed] [Google Scholar]
- 32.Kyselova Z, Mechref Y, Al Bataineh MM, Dobrolecki LE, Hickey RJ, Vinson J, Sweeney CJ, Novotny MV. Alterations in the serum glycome due to metastatic prostate cancer. J. Proteome Res. 2007;6:1822–32. doi: 10.1021/pr060664t. [DOI] [PMC free article] [PubMed] [Google Scholar]
- 33.Jacobs I, Bast RC., Jr. The CA 125 tumour-associated antigen: a review of the literature. Hum. Reprod. 1989;4:1–12. doi: 10.1093/oxfordjournals.humrep.a136832. [DOI] [PubMed] [Google Scholar]
- 34.Jankovic MM, Milutinovic BS. Glycoforms of CA125 antigen as a possible cancer marker. Cancer Biomark. 2008;4:35–42. doi: 10.3233/cbm-2008-4104. [DOI] [PubMed] [Google Scholar]
- 35.Kong F, White CN, Xiao X, Feng Y, Xu C, Xe D, Zhang Z, Yu Y. Using proteomic approaches to identify new biomarkers for detection and monitoring of ovarian cancer Gynecol. Onocol. 2006;100:247–53. doi: 10.1016/j.ygyno.2005.08.051. [DOI] [PubMed] [Google Scholar]
- 36.Kozak KR, Su F, Whitelegge JP, Faull K, Reddy S, Farias-Eisner R. Characterization of serum biomarkers for detection of early stage ovarian cancer. Proteomics. 2005;5:4589–96. doi: 10.1002/pmic.200500093. [DOI] [PubMed] [Google Scholar]
- 37.Li B, An HJ, Kirmiz C, Lebrilla CB, Lam KS, Miyamoto S. Glycoproteomic analyses of ovarian cancer cell lines and sera from ovarian cancer patients show distinct glycosylation changes in individual proteins. J. Proteome Res. 2008;7:3776–88. doi: 10.1021/pr800297u. [DOI] [PubMed] [Google Scholar]
- 38.Lin YW, Lin CY, Lai HC, Chiou JY, Chang CC, Yu MH, Chu TY. Plasma proteomic pattern as biomarkers for ovarian cancer. Int. J. Gynecol. Cancer. 2006;16(Suppl 1):139–46. doi: 10.1111/j.1525-1438.2006.00475.x. [DOI] [PubMed] [Google Scholar]
- 39.Mor G, Visintin I, Lai Y, Zhao H, Schwartz P, Rutherford T, Yue L, Bray-Ward P, Ward DC. Serum protein markers for early detection of ovarian cancer. Proc. Natl. Acad. Sci. USA. 2005;102:7677–82. doi: 10.1073/pnas.0502178102. [DOI] [PMC free article] [PubMed] [Google Scholar]
- 40.An HJ, Miyamoto S, Lancaster KS, Kirmiz C, Li B, Lam KS, Leiserowitz GS, Lebrilla CB. Profiling of glycans in serum for the discovery of potential biomarkers for ovarian cancer. J. Proteome Res. 2006;5:1626–35. doi: 10.1021/pr060010k. [DOI] [PubMed] [Google Scholar]
- 41.Leiserowitz GS, Lebrilla C, Miyamoto S, An HJ, Duong H, Kirmiz C, Li B, Liu H, Lam KS. Glycomics analysis of serum: a potential new biomarker for ovarian cancer? Int. J. Gynecol. Cancer. 2008;18:470–5. doi: 10.1111/j.1525-1438.2007.01028.x. [DOI] [PMC free article] [PubMed] [Google Scholar]
- 42.Matei D, Emerson RE, Schilder J, Menning N, Baldridge LA, Johnson CS, Breen T, McClean J, Stephens D, Whalen C, Sutton G. Imatinib mesylate in combination with docetaxel for the treatment of patients with advanced, platinum-resistant ovarian cancer and primary peritoneal carcinomatosis : a Hoosier Oncology Group trial. Cancer. 2008;113:723–32. doi: 10.1002/cncr.23605. [DOI] [PubMed] [Google Scholar]
- 43.Kang P, Mechref Y, Klouckova I, Novotny MV. Solid-phase permethylation of glycans for mass spectrometric analysis. Rapid Commun. Mass Spectrom. 2005;19:3421–8. doi: 10.1002/rcm.2210. [DOI] [PMC free article] [PubMed] [Google Scholar]
- 44.McGill R, Tukey JW, Larsen WA. Variations of Box Plots. Am. Stat. 1978:32. [Google Scholar]
- 45.Swets JA. Measuring the accuracy of diagnostic systems. Science. 1988;240:1285–93. doi: 10.1126/science.3287615. [DOI] [PubMed] [Google Scholar]
- 46.Mann B, Madera M, Sheng Q, Tang H, Mechref Y, Novotny MV. ProteinQuant Suite: a bundle of automated software tools for label-free quantitative proteomics. Rapid Commun. Mass Spectrom. 2008;22:3823–34. doi: 10.1002/rcm.3781. [DOI] [PubMed] [Google Scholar]
- 47.Abbott KL, Nairn AV, Hall EM, Horton MB, McDonald JF, Moremen KW, Dinulescu DM, Pierce M. Focused glycomic analysis of the N-linked glycan biosynthetic pathway in ovarian cancer. Proteomics. 2008;8:3210–20. doi: 10.1002/pmic.200800157. [DOI] [PMC free article] [PubMed] [Google Scholar]
- 48.Abbott KL, Lim JM, Wells L, Benigno BB, McDonald JF, Pierce M. Identification of candidate biomarkers with cancer-specific glycosylation in the tissue and serum of endometrioid ovarian cancer patients by glycoproteomic analysis. Proteomics. 2010;10:470–81. doi: 10.1002/pmic.200900537. [DOI] [PMC free article] [PubMed] [Google Scholar]
- 49.Anderson NL, Anderson NG. The Human Plasma Proteome. Mol. Cell. Proteomics. 2002;1:845–867. doi: 10.1074/mcp.r200007-mcp200. [DOI] [PubMed] [Google Scholar]
- 50.Azuma Y, Murata M, Matsumoto K. Alteration of sugar chains on alpha(1)-acid glycoprotein secreted following cytokine stimulation of HuH-7 cells in vitro. Clin. Chim. Acta. 2000;294:93–103. doi: 10.1016/s0009-8981(99)00248-x. [DOI] [PubMed] [Google Scholar]
- 51.Higai K, Miyazaki N, Azuma Y, Matsumoto K. Interleukin-1beta induces sialyl Lewis X on hepatocellular carcinoma HuH-7 cells via enhanced expression of ST3Gal IV and FUT VI gene. FEBS Lett. 2006;580:6069–75. doi: 10.1016/j.febslet.2006.09.073. [DOI] [PubMed] [Google Scholar]
- 52.Katnik I, Jadach J, Krotkiewski H, Berber J. Investigating the glycosylation of normal and ovarian cancer haptoglobins using digoxigenin-labelled lectins. Glycoconjucate J. 1984:97–104. [Google Scholar]
- 53.Thompson S, Dargan E, Turner GA. Increased fucosylation and other carbohydrate changes in haptoglobin in ovarian cancer. Cancer Lett. 1992;66:43–8. doi: 10.1016/0304-3835(92)90278-4. [DOI] [PubMed] [Google Scholar]
- 54.Thompson S, Turner GA. Elevated levels of abnormally-fucosylated haptoglobins in cancer sera. Br. J. Cancer. 1987;56:605–10. doi: 10.1038/bjc.1987.249. [DOI] [PMC free article] [PubMed] [Google Scholar]
- 55.Lin Z, Simeone DM, Anderson MA, Brand RE, Xie X, Shedden KA, Ruffin MT, Lubman DM. Mass spectrometric assay for analysis of haptoglobin fucosylation in pancreatic cancer. J. Proteome Res. 2011;10:2602–11. doi: 10.1021/pr200102h. [DOI] [PMC free article] [PubMed] [Google Scholar]
- 56.Arnold JN, Saldova R, Galligan MC, Murphy TB, Mimura-Kimura Y, Telford JE, Godwin AK, Rudd PM. Novel glycan biomarkers for the detection of lung cancer. J. Proteome Res. 2011;10:1755–64. doi: 10.1021/pr101034t. [DOI] [PubMed] [Google Scholar]
- 57.Takeda Y, Shinzaki S, Okudo K, Moriwaki K, Murata K, Miyoshi E. Fucosylated haptoglobin is a novel type of cancer biomarker linked to the prognosis after an operation in colorectal cancer. Cancer. doi: 10.1002/cncr.26490. In press. [DOI] [PubMed] [Google Scholar]
- 58.Fujimura T, Shinohara Y, Tissot B, Pang PC, Kurogochi M, Saito S, Arai Y, Sadilek M, Murayama K, Dell A, Nishimura S, Hakomori SI. Glycosylation status of haptoglobin in sera of patients with prostate cancer vs. benign prostate disease or normal subjects. Int. J. Cancer. 2008;122:39–49. doi: 10.1002/ijc.22958. [DOI] [PubMed] [Google Scholar]
- 59.Park SY, Yoon SJ, Jeong YT, Kim JM, Kim JY, Bernert B, Ullman T, Itzkowitz SH, Kim JH, Hakomori SI. N-glycosylation status of beta-haptoglobin in sera of patients with colon cancer, chronic inflammatory diseases and normal subjects. Int. J. Cancer. 2010;126:142–55. doi: 10.1002/ijc.24685. [DOI] [PubMed] [Google Scholar]
- 60.Hoagland L. F. t., Campa MJ, Gottlin EB, Herndon JE, 2nd, Patz EF., Jr. Haptoglobin and posttranslational glycan-modified derivatives as serum biomarkers for the diagnosis of nonsmall cell lung cancer. Cancer. 2007;110:2260–8. doi: 10.1002/cncr.23049. [DOI] [PubMed] [Google Scholar]
- 61.Yamashita K, Koide N, Endo T, Iwaki Y, Kobata A. Altered glycosylation of serum transferrin of patients with hepatocellular carcinoma. J. Biol. Chem. 1989;264:2415–23. [PubMed] [Google Scholar]
- 62.Debruyne EN, Vanderschaeghe D, Van Vlierberghe H, Vanhecke A, Callewaert N, Delanghe JR. Diagnostic value of the hemopexin N-glycan profile in hepatocellular carcinoma patients. Clin. Chem. 2010;56:823–31. doi: 10.1373/clinchem.2009.139295. [DOI] [PubMed] [Google Scholar]
- 63.Gercel-Taylor C, Bazzett LB, Taylor DD. Presence of aberrant tumor-reactive immunoglobulins in the circulation of patients with ovarian cancer. Gynecol. Oncol. 2001;81:71–6. doi: 10.1006/gyno.2000.6102. [DOI] [PubMed] [Google Scholar]
- 64.Kanoh Y, Mashiko T, Danbara M, Takayama Y, Ohtani S, Egawa S, Baba S, Akahoshi T. Changes in serum IgG oligosaccharide chains with prostate cancer progression. Anticancer Res. 2004;24:3135–9. [PubMed] [Google Scholar]
- 65.Matsumoto A, Shikata K, Takeuchi F, Kojima N, Mizuochi T. Autoantibody activity of IgG rheumatoid factor increases with decreasing levels of galactosylation and sialylation. J. Biochem. 2000;128:621–8. doi: 10.1093/oxfordjournals.jbchem.a022794. [DOI] [PubMed] [Google Scholar]
- 66.Lattova E, Tomanek B, Bartusik D, Perreault H. N-glycomic changes in human breast carcinoma MCF-7 and T-lymphoblastoid cells after treatment with herceptin and herceptin/Lipoplex. J. Proteome Res. 2010;9:1533–40. doi: 10.1021/pr9010266. [DOI] [PubMed] [Google Scholar]
Associated Data
This section collects any data citations, data availability statements, or supplementary materials included in this article.


