

Abstract
BACKGROUND & AIMS
microRNAs (miRs) can promote or inhibit tumor growth and are therefore being developed as targets for cancer therapies. They are diverse not only in the mRNAs they target but in their production; the same hairpin RNA structure can generate mature products from each strand, termed 5p and 3p, that can bind different mRNAs. We analyzed the expression, functions, and mechanisms of miR-28-5p and miR-28-3p in colorectal cancer (CRC) cells.
METHODS
We measured levels of miR-28-5p and miR-28-3p expression in 108 CRC and 49 normal colorectal samples (47 paired) by reverse transcription, quantitative real-time PCR. The roles of miR-28 in CRC development were studied using cultured HCT116, RKO, and SW480 cells and tumor xenograft analyses in immunodeficient mice; their mRNA targets were also investigated.
RESULTS
miR-28-5p and miR-28-3p were downregulated in CRC samples, compared with normal colon samples. Overexpression of the miRNAs in CRC cells had different effects and the miRNAs interacted with different mRNAs: miR-28-5p altered expression of CCND1 and HOXB3 whereas miR-28-3p bound NM23-H1. Overexpression of miR-28-5p reduced CRC cell proliferation, migration and invasion in vitro, whereas miR-28-3p increased CRC cell migration and invasion in vitro. CRC cells over-expressing miR-28 developed tumors more slowly in mice compared to control cells, but miR-28 promoted tumor metastasis in mice.
CONCLUSION
miR-28-5p and miR-28-3p are transcribed from the same RNA hairpin and are downregulated in CRC cells. Overexpression of each has different effects on CRC cell proliferation and migration. Such information has a direct application for the design of microRNA gene therapy trials.
Keywords: transcript regulation, gene, RNA processing
Introduction
Colorectal (CRC) cancer is the third most commonly diagnosed cancer in men and the second in women.1 In the United States, it is the third leading cause of death by cancer, with 51,371 estimated deaths and 142,570 estimated newly diagnosed cases in 2010.2 Therefore, new therapeutic approaches and prognostic markers are needed. In 2002, new players in cancer biology were identified: microRNAs (miRNAs).3 These are a large family of small non-coding RNAs with approximately 20-nt length that regulate gene expression post-transcriptionally by inhibition of translation or mRNA degradation.4 miRNAs targeting occurs by binding to 3’-untranslated regions, coding sequences or 5’-untranslated regions of target messenger RNAs (mRNA) that can be involved in diverse biological processes such as proliferation, apoptosis, inflammation, differentiation and metastasis.4 miRNAs can function as either oncogenes or tumor suppressor genes depending on the type of tumor or the cellular context.5 In CRC, miRNAs have been involved in tumor susceptibility (as polymorphisms in miRNA-binding sites have been associated with CRC risk) and in diagnosis (as miRNAs can be detected in feces or blood and be used as biomarkers).6 In addition, miRNA expression is dysregulated in CRC, as well as in other cancer types, and miRNAs have emerged as potential new therapeutic targets.6,7 Therefore, understanding the role of miRNAs in CRC is crucial for the development of new therapies.
In the miRNA biogenesis pathway, long primary transcripts (pri-miRNAs) transcribed from the genome are processed by the cellular RNase enzyme III Drosha into a structure of 60 to 110 nt called precursor miRNA (pre-miRNA), which is then exported to the cytoplasm by an Exportin 5-dependent mechanism.4 The pre-miRNA is cleaved by the RNase III enzyme Dicer-1 producing a short, imperfect, double-stranded miRNA duplex, which is unwound by a helicase, creating a mature miRNA.4 In some cases, 2 mature miRNAs can be excised from the same stem-loop pre-miRNA.8 These “5p” and “3p” miRNAs, although generated from a single primary transcript, have different sequences and therefore target different messenger RNAs. In humans, 2 different mature miRNA sequences are excised from opposite arms of the stem-loop pre-miR-28 and generate 2 different miRNAs—hsa-miR-28-5p and hsa-miR-28-3p. Despite nearly a decade of studies on miRNA roles in cancer3, the comparative roles of strand-specific mature miRNAs that originated from the same stem-loop precursor (5p and 3p) have not yet been fully studied.
To our knowledge, the role miR-28-5p and miR-28-3p play in CRC has never been described. Therefore, the purpose of our study was to analyze miR-28-5p and miR-28-3p expression and to use in vitro and in vivo approaches to understand, for the first time, the functions and mechanisms of these 2 miRNAs in CRC.
Materials and Methods
Colorectal samples
Eighty-five CRC samples and 26 normal colorectal tissue samples (of which 24 were paired) were collected between 2003 and 2008 at the University Hospital of Ferrara in Ferrara, Italy (first sample set). Forty-two tumors were classified as microsatellite stable (MSS), and 43 tumors were classified as microsatellite unstable (MSI) (Supplementary Methods). For a confirmation set of samples, we obtained 23 paired samples of tumor and adjacent colorectal tissue that were collected between 2002 and 2005 at the Istituto per lo Studio e la Cura dei Tumori della Romagna in Meldola, Italy (second sample set). Tumors were classified according to the World Health Organization pathologic classification system. All patients provided informed consent, and collection of the samples was approved by the institutional review board at each institution. Patients did not receive any therapy before surgery. Upon resection, fresh surgical specimens were immediately snap-frozen in liquid nitrogen and stored at -80°C. Total RNA from tissue samples was isolated using Trizol reagent (Invitrogen, Carlsbad, CA), according to manufacturer’s instructions (Supplementary Methods).
Reverse Transcription - Quantitative Real-Time Polymerase Chain Reaction
RNA purity was assessed by measuring the absorbance at 260, 280 and 230 nm. Average 260/280 ratio was 1.97+/-0.05, with a range between 1.86 and 2.05, and average 260/230 ratio was 2.17+/-0.11, with a range between 2.00 and 2.31. In addition, as recommended by the “Minimum Information for Publication of Quantitative Real-Time PCR Experiments” (MIQE) guidelines,9,10 we analyzed RNA integrity by gel electrophoresis and clearly defined 28S and 18S ribosomal RNA bands were visualized. Samples with low quality that did not meet these criteria were excluded. We quantified miR-28-5p and miR-28-3p expression with real-time quantitative polymerase chain reaction (RT-qPCR) TaqMan miRNA assays (Applied Biosystems, Foster City, CA), namely assay 000411 for miR-28-5p, assay 002446 for miR-28-3p and assay 001973 for U6 snRNA (Supplementary Methods). The efficiency of the Taqman assays used in this study was determined (Supplementary Figure 1 and Supplementary Table 1). Relative expression levels were calculated using the ΔΔCt11 and the Pfaffl method.12
In Vitro Cell Proliferation Assays
HCT116 and RKO cells transfected with SCR, miR-28-5p, or miR-28-3p were seeded onto a 12-well plate at 1×10⁵ cells/well in triplicate. Cells were harvested and counted at 0, 24, 48, 72, and 96 h after transfection using the Vi-CELL cell viability analyzer (Beckman Coulter, Brea, CA). In order to further confirm our results, a 3-(4,5-dmethylthiazol-2-yl)-2,5-diphenyltetrazolium bromide (MTT) assay was performed (Supplementary Methods). The experiment was repeated twice independently.
In Vitro Cell Migration and Invasion Assays
To determine the effect of miR-28-5p and miR-28-3p on cell migration, we used 6.5-mm diameter transwell chambers with 8-μm pore size polycarbonate membranes (Corning Incorporated, Lowell, MA). To determine the effect of these miRNAs on cell invasion, we used BioCoat growth-factor reduced matrigel invasion chambers (BD Biosciences, Bedford, MA). Cells transfected with SCR, miR-28-5p, or miR-28-3p were resuspended in serum-free medium and plated on the top of the transwell chambers. FBS was used as a chemoattractant on both assays. Each assay was performed in triplicate and in 2 independent experiments. Further details are described in Supplementary Methods.
In vivo Studies of Tumorigenesis and Metastatic Potential
For the in vivo tumorigenesis assay, 1.5 × 10⁶ HCT116-pBABE-miR28 or HCT116-pBABE-empty cells were subcutaneously injected into the flanks of NOD-SCID-IL2Rgamma (NSG)-deficient mice (n=9; stock #005557, The Jackson Laboratory, Bar Harbor, ME). Tumor size was measured every 2 days. Animals were sacrificed 21 days after injection, and final tumor volume was determined. Tumor size was determined by digital caliper measurements (length and width in mm), and tumor volume (mm3) was estimated using the following formula: tumor volume = 1/2(length × width2).
For the in vivo tumor-metastasis assay, 4 × 10⁶ HCT116-pBABE-miR28 and HCT116-pBABE-empty cells were injected into the tail vein of NSG mice (n=11/group). Thirty-five days after injection the mice were sacrificed. All the organs were examined at necropsy. Tumors were sectioned, stained with hematoxylin and eosin (HE), and anti-GFP antibody (Ab13970, Abcam, Cambridge, MA), and examined histologically.
All animal care and handling was approved by The University of Texas M.D.Anderson institutional animal care and use committee.
Statistical Analysis
Shapiro-Wilk test was used to verify the clinical samples’ distribution. Differences were analyzed using the nonparametric test Mann-Whitney-Wilcoxon. To compare the paired groups paired t test was used. For in vitro and in vivo studies, the differences between groups were analyzed using the Student t test (two-tailed), assuming unequal variance. Discrete variables were compared with the Fischer exact test. Graphics represent the average +/- standard deviation (SD), unless otherwise stated. Statistical analysis was performed in R (version 2.11.0). Statistical significance was considered if P < 0.05.
Additional methods including cell culture, STR DNA fingerprinting and miRNA mimics transfection, apoptosis quantification, caspase activity, cell cycle analysis by flow cytometry, establishment of miR-28-expressing cell line, miRNA target prediction, western blot and luciferase reporter assays are available in Supplementary Methods.
Results
miR-28-5p and miR-28-3p Are Downregulated in CRC
Expression levels of miR-28-5p and miR-28-3p were analyzed by qRT-PCR in 85 human CRC specimens and 26 normal human colorectal specimens. In order to ensure that the reference gene snRNA U6 does not change between normal and tumor samples, we calculated the mean Ct values as 2-ct. Levels of U6 did not differ between normal and tumor tissue, 2-CtTumor/2-CtNormal=0.94 (P = 0.41) (Supplementary Figure 2). Both miRNA-28-5p and miR-28-3p were significantly downregulated in CRC samples (miR-28-5p, P < 0.005; miR-28-3p, P < 0.005) (Figure 1A). Both MSS (n=42) and MSI (n=43) tumors showed downregulation of miR-28 expression compared with the normal colon tissue (miR-28-5p normal vs. MSS [P < 0.005] and normal vs. MSI [P < 0.005]; miR-28-3p normal vs. MSS [P < 0.005] and normal vs. MSI [P < 0.005]); however, no significant differences between MSS and MSI tumors were found (miR-28-5p MSS vs. MSI, P = 0.418; miR-28-3p MSS vs. MSI, P = 0.996) (Figure 1B). We also analyzed the expression of these miRNAs in the subset of 24 pairs of normal and tumor tissue samples from the same patients, and in agreement with the above data, we found significant downregulation of miR-28-5p and miR-28-3p in CRC samples (miR-28-5p, P < 0.005; miR-28-3p, P < 0.005) (Supplementary Figure 3). In order to confirm these results, we used a second independent set of CRC samples. In 23 paired samples of tumors and adjacent normal tissue, we also found that both miRNAs were downregulated (miR-28-5p, P< 0.001; miR-28-3p, P < 0.001) (Figure 1C). Values of expression are presented in Supplementary Tables 2 and 3.
Figure 1.
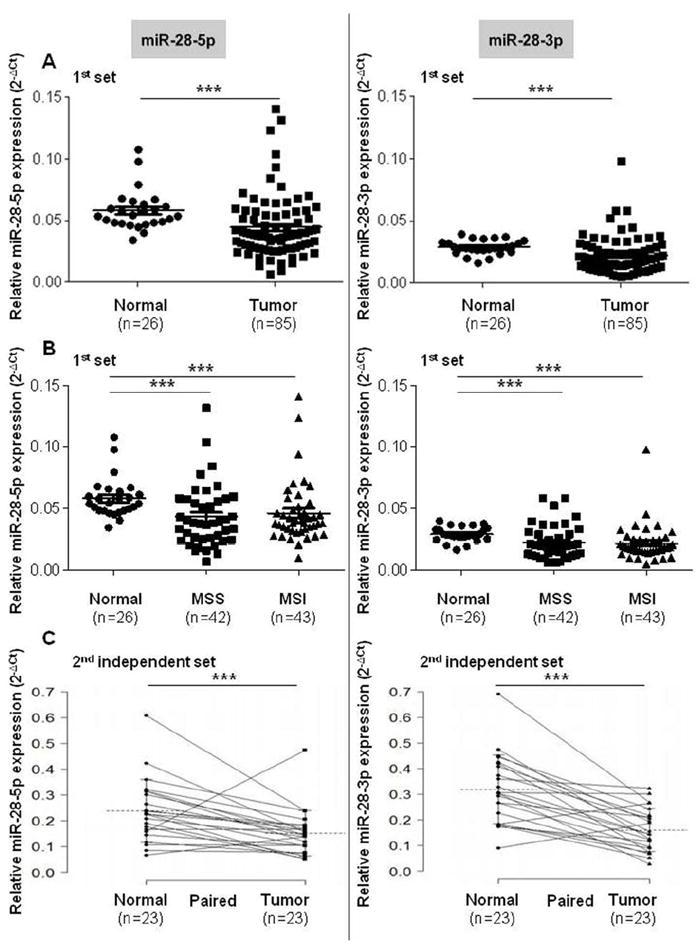
Expression of miR-28-5p and miR-28-3p in colon tissue samples. (A) Quantitative real-time polymerase chain reaction analysis shows that miR-28-5p and miR-28-3p are downregulated in colon cancer samples compared with normal colorectal tissue samples. (B) Both microsatellite stable (MSS) and microsatellite unstable (MSI) tumors express significantly less miR-28-5p and miR-28-3p levels when compared with normal colon tissue. No differences were found when comparing miR-28-5p and miR-28-3p levels of MSS and MSI tumors. (C) miRNAs downregulation in CRC tumors paired with normal tissue from the second set of patients. All values of miRNA expression levels were normalized to small nuclear RNA U6. Mean +/- standard error of the mean (SEM) are represented on the images (***P < 0.005, Mann-Whitney-Wilcoxon test, and paired t test for paired normal vs tumor groups).
miR-28-5p, but not miR-28-3p, Significantly Suppresses Proliferation and Induces Apoptosis and G1 Arrest in CRC Cells
To elucidate the roles of miR-28-5p and miR-28-3p in CRC tumorigenesis, HCT116 and RKO CRC cell lines (endogenous miR-28 expression levels of colon cell lines are shown in Supplementary Fig. 4) were transfected with scrambled control (SCR), pre-miR-28-5p, or pre-miR-28-3p. Expression of miRNAs was confirmed by qRT-PCR (Supplementary Figure 5). In both cell lines, we found that cells overexpressing miR-28-5p grew significantly less (P < 0.005) than did cells transfected with control or miR-28-3p (Figure 2A and B). This result was further confirmed in the HCT116 and RKO cell lines using the MTT assay (Supplementary Figure 6A,B). In contrast, in both cell lines overexpressing miR-28-3p there were no statistically significant differences at any time (HCT116, P = 0.25; RKO, P = 0.81) compared with cells transfected with control (Figure 2A and B). Therefore, the in vitro results suggest that miR-28-5p, but not miR-28-3p, has a biological effect on proliferation.
Figure 2.
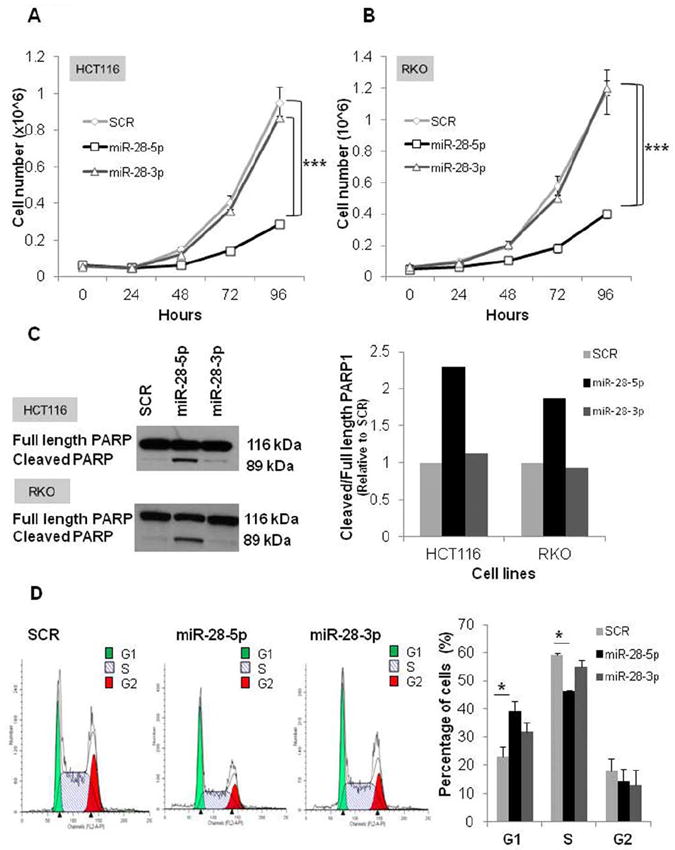
Biological effects of miR-28-5p in proliferation, apoptosis, and cell cycle in vitro. (A and B) Representative experiment of the proliferation effect of miR-28-5p and miR-28-3p in HCT116 and RKO colon cell lines. Cell numbers were counted every 24 h for 4 days posttransfection with scrambled negative control (SCR), miR-28-5p, or miR-28-3p. miR-28-5p, but not miR-28-3p, inhibited growth in both HCT116 and RKO cell lines. Values represent the average of 3 replicates +/- standard deviation (SD) (***P < 0.005, Student t test). Two independent experiments were performed. (C) Immunoblotting with anti-poly(adenosine diphosphate-ribose) polymerase 1 (PARP1) 48 h after transfection of HCT116 and RKO cell lines with SCR, miR-28-5p, or miR-28-3p. Graphic represents the ratio between cleavage and total PARP1 form. miR-28-5p, but not miR-28-3p, increased PARP1 cleavage form. (D) Fluorescent-activated cell sorting (FACS) analysis 48 h posttransfection with SCR, miR-28-5p, or miR-28-3p. Representative experiment was performed in duplicate; average +/- SD (*P < 0.05, Student t test). Two independent experiments were performed.
We then explored the possibility that the effect of miR-28-5p on proliferation could be due to an increase in apoptosis or to defects in the cell cycle. To test whether miR-28-5p had an effect on apoptosis, we measured PARP1 protein which is specifically cleaved by caspases and promotes apoptosis. PARP1 cleavage forms are one of the most reliable apoptotic markers.13,14 Cells transfected with pre-miR-28-5p expressed 2.2, and 1.8 times more cleaved-PARP1 form (relative to total-PARP1 form) than did cells transfected with control in the HCT116 and RKO cell lines, respectively (Figure 2C). In agreement with the results of the proliferation assays, cells transfected with miR-28-3p presented a PARP1 cleaved/total form ratio similar to the control (Figure 2C). Furthermore, our results were confirmed by caspases 3/7, 8, and 9 activities, which were all higher in miR-28-5p-transfected cells than in the SCR-transfected cells (Supplementary Figure 6C). In order to analyze possible differences in the cell cycle, the HCT116 cell line was transfected with either SCR, miR-28-5p, or miR-28-3p and analyzed by FACS. Compared with the control, cells transfected with miR-28-5p had a significantly higher percentage of cells in G1 phase and a significantly lower percentage of cells in S phase, suggesting that miR-28-5p causes G1 arrest (P < 0.05) (Figure 2D). Despite being concomitantly transcribed and being part of the same RNA stem-loop hairpin, these data suggest that miR-28-5p has a tumor-suppressive role in CRC and that miR-28-3p does not have the same biologic role.
miR-28 Disrupts Tumor Growth In Vivo
Since our in vitro studies indicated that miR-28-5p acts as a tumor suppressor in CRC, we analyzed the overall effect of miR-28 in vivo. For that purpose, we generated stable clones overexpressing miR-28, and expression of miR-28-5p and miR-28-3p was verified by qRT-PCR (Supplementary Figure 7). HCT116 colon cancer cells stably transfected with pBABE-empty or pBABE-miR-28 were subcutaneously injected into the left and right flanks of each mouse, respectively (n=9). Both cell lines were injected into the same mice to decrease inter-mouse variability. Tumors derived from the HCT116 stably expressing pBABE-miR-28 cells grew much slower than did tumors derived from the HCT116 stably expressing pBABE-empty cells (Figure 3A). Accordingly, final tumor volume in pBABE-miR-28 tumors was significantly reduced (P < 0.01) compared with pBABE-empty tumors (Figure 3B and C). miR-28 expression levels were confirmed in these tumors. In pBABE-miR-28 tumors, miR-28-5p and miR-28-3p were indeed increased (P < 0.01) when compared with pBABE-empty tumors (Figure 3D). In conclusion, this xenograft experiment revealed that expression of miR-28 disrupts tumor growth in vivo.
Figure 3.

miR-28 decreases tumor volume in mice xenografts. (A and B) HCT116-pBABE-empty (control) and HCT116-pBABE-miR-28 (stably expressing miR-28) were subcutaneously injected in the left and right flanks of 9 mice, and tumor volume was measured during the (A) course of the experiment and (B) at the end of the experiment (21 days postinoculation). The tumor volumes in the HCT116-pBABE-miR-28 group were lower than those in the HCT116-pBABE-empty group (**P < 0.01, Student t test). (C) Photographs show tumors excised from 5 mice in each group. (D) Quantitative real-time polymerase chain reaction analysis shows miR-28-5p and miR-28-3p expression in the tumors extracted from the mice (mean +/- standard deviation) (**P < 0.01, Student t test).
Opposite Effects of miR-28-5p and miR-28-3p in Cell Migration and Invasion
To further understand the biological importance of miR-28-5p and miR-28-3p in CRC, we explored whether these miRNAs could be involved in colon cancer metastasis. To evaluate the migratory capacity of HCT116 cells expressing either miRNA, we used transwell cell migration assays. Overexpression of miR-28-5p led to a significant reduction in cell migration (P < 0.01) whereas overexpression of miR-28-3p led to a significant increase (P < 0.05) in cell migration compared with the control (Figure 4). The same result was obtained when using SW480 transfected cells (miR-28-5p, P < 0.05; miR-28-3p, P < 0.01) (Supplementary Figure 8). To determine whether both miR-28-5p and miR-28-3p also played a role in invasion, we used transwell chambers coated with matrigel. HCT116 cells expressing miR-28-5p had a reduction in invasiveness (P < 0.05) whereas cells expressing miR-28-3p had an increase in invasiveness (P < 0.01) compared with the control (Figure 4). Although no statistically significant differences were obtained for SW480 cell line, the same trend was observed - miR-28-5p overexpressing cells are less invasive and miR-28-3p are more invasive than control (miR-28-5p, P = 0.25; miR-28-3p, P = 0.12) (Supplementary Figure 8). The effect of miR-28-3p, which showed a growth rate similar to the control, on migration and invasion appears to be independent of cell growth. Therefore, although both miRNAs are downregulated in CRC, they play different roles in the migration phenotype.
Figure 4.
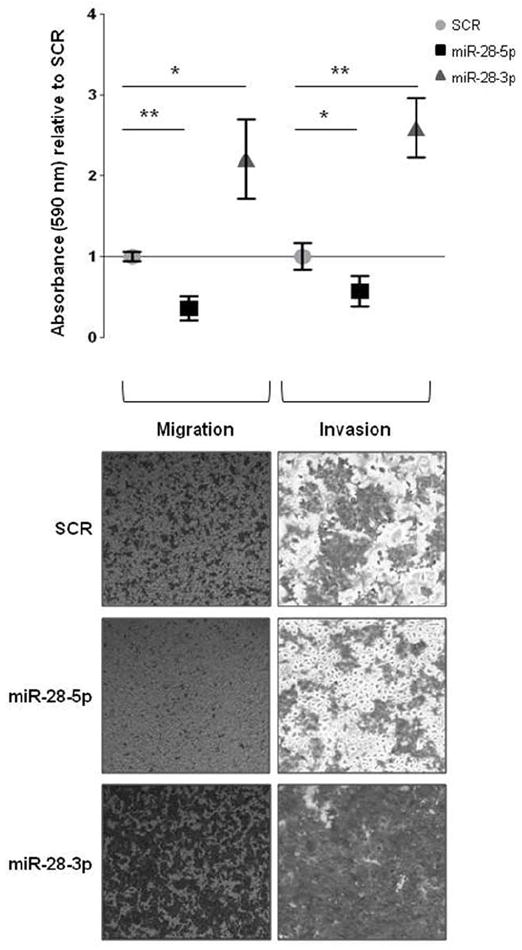
Effect of mir-28-5p and miR-28-3p in migration and invasion in vitro. Absorbance was measured for cells on the bottom of noncoated and matrigel-coated transwell chambers at 24 h (for migration) and 48 h (for invasion) after HCT116 cells expressing miR-28-5p or miR-28-3p were plated. Results are shown relative to scrambled negative control (SCR). A representative experiment is shown. Average (of triplicates) +/- standard deviation is shown (*P < 0.05, **P < 0.01, Student t test). (B) Microscopy images (x50) show the migratory and invasive cells on transwell assays.
mir-28 Increases Metastasis In Vivo
As miR-28-5p and miR-28-3p exert opposite effects on migration and invasion in vitro but are transcribed concomitantly in cells, we further investigated the effect of global miR-28 expression on metastasis in vivo. For this purpose, we intravenously injected mice with pBABE-empty or pBABE-miR-28 cells. After 35 days, the mice were sacrificed. At necropsy, tumors were found in the liver, kidney, lung, and spinal cord. We found increased number of mice with metastases in all tumor sites in the pBABE-miR-28 group compared with the pBABE-empty group (Figure 5A). In particular, metastases in the liver and lung were found at a statistically significant higher frequency in the pBABE-miR-28 group than were in the pBABE-empty group (P < 0.05). Examples of tumor metastases from the 3 most frequent locations—liver, kidney, and lung—are presented with HE staining and anti-GFP labeling (Figure 5B). In addition, the number of tumors in liver and kidney was higher in the pBABE-miR-28 group than in pBABE-empty (Figure 5C). In particular, in the pBABE-miR-28 group, 6 mice presented liver tumors with an average of 1.5 +/- 0.8 tumors per mice, while in the pBABE-empty group there was only 1 mouse that developed only 1 liver tumor. Regarding the kidney, in the pBABE-miR-28 group 10 mice presented kidney tumors with an average of 14.6 +/- 4.2 tumors per mice (considering both kidneys), while in the pBABE-empty group 6 mice developed kidney tumors with an average of 6 +/- 4.2 tumors per mice (P < 0.005). An example of the tumors can be visualized in Figure 5D. Although miR-28-5p and miR-28-3p had contrasting effects on migration and invasion in vitro, and although in vivo subcutaneous tumorigenesis appeared to correlate with the growth-inhibiting effects of miR-28-5p, the overall in vivo results of the metastasis experiments resembled the effects caused by miR-28-3p, indicating that this miRNA may have a predominant effect on metastasis.
Figure 5.
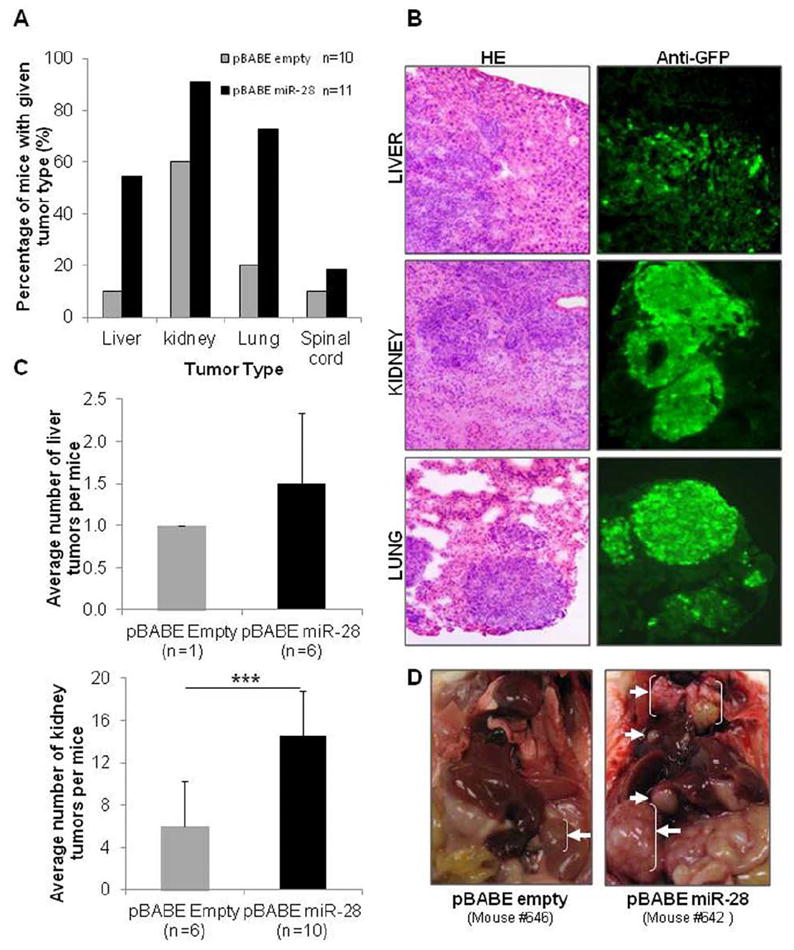
miR-28 increases metastasis in vivo. (A and B) HCT116-pBABE-empty (control) and HCT116-pBABE-miR-28 (stably expressing miR-28) were injected in the vein tail of mice. (A) Thirty-five days postinjection metastases were detected in the liver, kidney, lung, and spinal cord. The percentage of mice with metastases in these organs was consistently higher in miR-28-expressing tumors than in the control. (B) Microscopy images (x100) show hematoxylin and eosin (HE) and anti-green fluorescent protein (GFP) immunohistochemical staining for liver, kidney, and lung metastatic tumors. (C) Number of tumors observed within the liver and kidneys. (D) Photographs of HCT116-pBABE-empty (left panel) and HCT116-pBABE-miR-28 (right panel) mice show the sites with metastasis (white arrows) found in more than 30% of each group of mice.
miR-28-5p and miR-28-3p Targets
To identify miR-28-5p and miR-28-3p targets that could be involved in the biological effects caused by these miRNAs, we first used an in silico approach. By selecting the targets predicted to be regulated by miR-28-5p or miR-28-3p in PITA, TargetScan, and miRanda programs simultaneously, we found 5,784 mRNAs. Of these mRNAs, 2,629 were predicted to be a target of miR-28-5p but not miR-28-3p; 1,305 were predicted to be a target of miR-28-3p but not miR-28-5p; and 925 were predicted to be targets of both miRNAs. To narrow the list of potential targets, we focused on the ones that: 1) have been described as upregulated in colon cancer (given that miR-28 is downregulated), and 2) have been reported to be involved in the biological functions investigated here. Therefore, we searched for miR-28-5p targets involved in proliferation and miR-28-3p targets involved in metastasis, and we considered targets that were predicted by at least 2 programs. In this way, we identified CCND1, HOXB3, and NM23-H1.
We first used immunoblotting to detect changes at the protein level for several predicted targets of interest in cells transfected with SCR, miR-28-5p, or miR-28-3p. We found a 51% reduction in the level of cyclin D1 (encoded by the CCND1 gene) in cells in which miR-28-5p was restored. On the contrary, no differences in cyclin D1 levels were detected in miR-28-3p-expressing cells compared with SCR-transfected cells (Figure 6A). We also found that HOXB3 was a target of miR-28-5p, since this miRNA reduced HoxB3 protein expression by 35% (Figure 6B). Regarding miR-28-3p, we found that the protein Nm23-H1 was downregulated by 52% in cells expressing miR-28-3p (Figure 6C).
Figure 6.
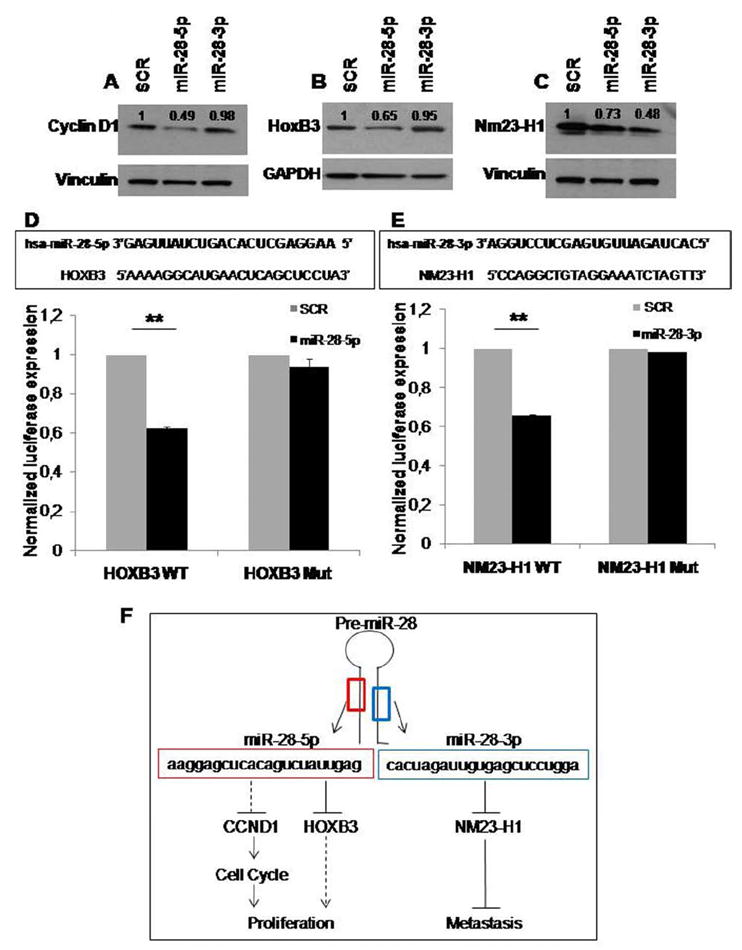
miR-28-5p targets Cyclin D1 and HoxB3, and miR-28-3p targets Nm23-H1. Western blot analysis shows (A) Cyclin D1, (B) HoxB3, and (C) Nm23-H1 expression in scrambled, miR-28-5p, and miR-28-3p transfected HCT116 cells. Expression levels were normalized for vinculin or glyceraldehyde-3-phosphate dehydrogenase (GAPDH) protein levels and were compared to the scrambled negative control transfection (=1). (D and E) The predicted miRNA∷mRNA interaction sites are shown in the top panels. The bottom panels show luciferase activity for the predicted interaction sites (D) PGL3-HOXB3-WT constructs cotransfected with scrambled negative control (n=1) or miR-28-5p and (E) PGL3-NM23-H1-WT construct cotransfected with scrambled negative control (n=1) or miR-28-3p. The same experiment was also performed using constructs with a mutated interaction site—PGL3-HOXB3-Mut and PGL3-NM23-H1-Mut. Values represent the average +/− standard deviation of 2 independent experiments performed in 4 replicates (**P < 0.01, Student t test). (F) The proposed mechanism for miR-28-5p and -3p function in CRC is shown.
To determine whether the effect on these targets was caused by a direct binding of the miRNAs or by an indirect effect, we cloned the predicted mRNA binding sites (Figure 6D and E; Supplementary Figure 9) downstream of the modified coding region of firefly luciferase in pGL3 reporter vector. We found that miR-28-5p significantly reduced luciferase activity in the HOXB3 reporter construct by 38% (P < 0.01) (Figure 6D). Also, miR-28-3p reduced luciferase activity in the NM23-H1 reporter construct by 34% (P < 0.01) (Figure 6E), while no significant differences were found when cells were cotransfected with miR-28-5p and the NM23-H1 construct (Supplementary Figure 10). To confirm this specific interaction, we mutated the miRNA-binding sites, and the luciferase activity for the PGL3-HOXB3 and PGL3-NM23-H1 constructs was restored to the same levels as the control. Regarding CCND1, although we found a significant decrease in luciferase activity in miR-28-5p-transfected cells, the binding site mutation did not fully restore the luciferase activity to the control level (Supplementary Figure 9). In summary, we found that miR-28-5p targeted cyclin D1 and HoxB3 and that miR-28-3p targeted Nm23-H1; this could explain, at least in part, the biological effects observed.
Discussion
In the present study, we analyzed 2 independent sets of human CRC samples, for a total of 108 (47 paired with normal tissue), and found significant downregulation of both mature miR-28 forms. Our study is the first to show downregulation of miR-28 in cancer. In the literature, only 1 study extensively analyzed miR-28 function in cancer, namely in myeloproliferative neoplasms (MPN). Girardot et al. identified miR-28 overexpression in platelets of BCR-ABL negative MPN patients and found MLP to be the main target, which is important for megakaryocyte differentiation.15 In normal colon tissue, in situ hybridization shows that miR-28-5p and miR-28-3p are predominantly expressed in epithelial cells (Supplementary Figure 11). Furthermore, a couple of profiling studies showed miR-28 upregulation in renal cell carcinoma16 and during glioma progression.17 It is well established that miRNAs can function as either tumor suppressors or oncogenes, depending on the tumor tissue and the cell type.5 Therefore, when studying miRNAs, it is essential to take into consideration the cellular context.5,18 One of the best examples is miR-125a/b that has been shown to be downregulated in glioblastoma, breast, prostate, ovarian, and non-small cell lung cancer but upregulated in myelodysplastic syndrome and acute myeloid leukemia patients with t(2;11)(p21;q23) and in urothelial carcinoma.18,19 Noteworthy, miRNA variation levels between normal tissue and tumors of less than 50% are frequently reported, and Volinia et al., which represent the largest miRNA profiling study reported so far, shows as highly significant consistent variations of less than 20%.20
As downregulation miR-28-5p and miR-28-3p had never been described before, we analyzed their roles in CRC in detail. This study provides evidence that strand-specific “5p” and “3p” miRNAs have distinct functions (Figure 6F). Concordantly with the role of a tumor-suppressor gene, miR-28-5p suppressed cell proliferation, causing apoptosis and G1-arrest in the cell cycle; however, miR-28-3p had no effect on proliferation in vitro. Therefore, the overall effect in vivo was, as expected, a significant decrease in tumor volume. In contrast, miR-28-5p and miR-28-3p caused opposite effects in migration and invasion in vitro. The miR-28 injected mice developed more metastases than did the control mice, which is in agreement with the in vitro effect observed for miR-28-3p overexpressing cells. To our knowledge, only 2 studies have addressed the distinct roles of “5p” and “3p” strands but none of them have investigated the in vivo effect or the distinct targeting mechanisms in detail. These studies showed the different effects of miR-125a-3p and miR-125a-5p in lung cancer cells19 and miR-34c-3p and miR-34c-5p in the cervical tumor cell line SiHa.21
Recently, Yang et al. identified the erythroid 2-related factor 2 as a target of miR-28 in breast cancer.22 To understand the underlying mechanisms of miR-28, we searched for miRNA targets (Figure 6F). Cyclin D1, encoded by the CCND1 gene, is a well-known oncogene that is overexpressed in several types of tumors, including CRC.23 This protein is a key player in cell-cycle regulation, in particular in the G1-S phase transition,24,25 and its inhibition reduces growth and tumorigenicity in human colon cancer cells.26 We found that miR-28-5p, but not miR-28-3p, targets cyclin D1. This is in agreement with the biological functions of miR-28-5p, as only miR-28-5p but not miR-28-3p caused G1 arrest. Although cyclin D1 protein levels were decreased in miR-28-5p-transfected cells, it remains to be determined whether this is a consequence of a direct miR∷mRNA interaction or an indirect effect through miR-28-5p targeting of other mRNAs in pathways where cyclin D1 is involved. The miR-28-5p∷CCND1 binding site predicted in silico showed a slight luciferase reduction that was not abrogated by the binding site mutation, showing that at least in this site there is no direct interaction. However, and although not predicted by our programs analysis, we do not exclude the possibility that other miR-28-5p∷CCND1 binding sites might exist. In addition, we also found HOXB3 to be a target of miR-28-5p. HOXB3 has been described as being significantly overexpressed in colon cancer.27 Although the role of HOXB3 in colon cancer has not been explored, Palakurty et al. described a mechanism by which HOXB3 exerts it oncogenic role, showing that it is essential for epigenetic silencing of the tumor-suppressor RASSF1A,28 whose promoter is hypermethylated in colon tumors.29 These authors also demonstrate in a lung cancer cell line that HOXB3 increases tumor growth both in vitro and in vivo29. In addition, HOXB3 has been demonstrated to regulate cellular proliferation of hematopoietic stem cells30 and of Rat-1 cell line.31 The interaction between miR-28-5p and HOXB3 occurs through a direct binding as demonstrated by the luciferase assay results. Our data demonstrate that, in vivo, miR-28 promotes metastasis and that, in vitro, miR-28-3p induces migration and invasion. As miR-28 was reduced in the tumors, we looked for an antimetastatic mRNA as a target, which would suppress metastasis without affecting tumor growth.32 Interestingly, we found that miR-28-3p has the capacity of regulating NM23-H1, the first metastasis-suppressor gene identified.33-35 Remarkably, it has been previously reported that this gene is overexpressed in colon carcinoma cells, especially in the early stages, and that it limits the invasive potential of human cancer cells without having an effect on proliferation.36 In addition, NM23-H1 inhibits liver metastases of colon.37
In the future, prospective studies should be performed to address clinical correlations; furthermore, systematic experiments should be conducted to identify all potential targets that can explain the distinct biological effects.
In conclusion, this is the first study to report downregulation of miR-28 in human tumorigenesis. In CRC, miR-28 suppresses proliferation but activates metastasis; this is a consequence of the distinct roles of the miR-28 hairpin RNA products, miR-28-5p and miR-28-3p. Such information has direct consequences for the design of miRNA gene therapy trials. The manipulation of the expression of specific miRNAs by using the precursor molecules can produce additional clinical effects due to the transcription of “5p” and “3p” genes with distinct biological effects.
Supplementary Material
Acknowledgments
Grant support: M.I.A. is supported by a PhD fellowship (SFRH/BD/47031/2008) from Fundação para a Ciência e Tecnologia, Portugal. G.A.C. is supported as a fellow by The University of Texas MD Anderson Cancer Center Research Trust, The University of Texas System Regents Research Scholar, and the Chronic Lymphocytic Leukemia Global Research Foundation. Work in Dr. Calin’s laboratory is supported in part by grants from the National Institutes of Health (CA135444), the US Department of Defense, the Pancreatic Cancer Action Network (2009 Seena Magowitz AACR Pilot Grant), and the US-European Alliance for the Therapy of Chronic Lymphoid Leukemia. STR DNA fingerprinting was done by the Cancer Center Support grant funded Characterized Cell Line core, NCI # CA16672.
Writing assistance: The authors thank Sue Moreau from the Department of Scientific Publications at The University of Texas MD Anderson Cancer Center for English language editing of the manuscript.
Abbreviations
- CRC
colorectal cancer
- miRNA
microRNA
- pri-miRNA
primary microRNA
- pre-miRNA
precursor miRNA
- LPP
LIM-domain containing preferred translocation partner in lipoma gene
- MSS
microsatellite stable
- MSI
microsatellite unstable
- RT-qPCR
Reverse Transcription - Quantitative Real-Time Polymerase Chain Reaction
- FBS
fetal bovine serum
- SCR
scrambled control
- MTT
3-(4,5-dmethylthiazol-2-yl)-2,5-diphenyltetrazolium bromide
- PARP1
poly(adenosine diphosphate-ribose) polymerase 1
- FACS
fluorescent-activated cell sorting
- NSG
NOD-SCID-IL2Rgamma deficient mice
Footnotes
Author contributions:
Study concept and design: M.I.A., P.A.Z, G.A.C.
Acquisition of data: M.I.A., L.Z., X.Z.
Drafting of the manuscript: M.I.A., M.N., R.S., M.F., R.M.R., P.A.Z, G.A.C.
Analysis and interpretation of data: M.I.A., M.N., R.S., R.M., P.A.Z, G.A.C.
Critical revision of the manuscript for important intellectual content: M.I.A., M.N., R.S., M.F., R.M.R., P.A.Z, G.A.C.
Statistical analysis: M.I.A., C.I., L.X.
Obtained funding: G.A.C.
Administrative, technical, or material support: R.G., I.V., F.F., M.F., G.L.
Study supervision: G.A.C.
Supplementary material is available online.
Conflicts of interest:
The authors declare no competing financial interests in relation to the work described.
Publisher's Disclaimer: This is a PDF file of an unedited manuscript that has been accepted for publication. As a service to our customers we are providing this early version of the manuscript. The manuscript will undergo copyediting, typesetting, and review of the resulting proof before it is published in its final citable form. Please note that during the production process errors may be discovered which could affect the content, and all legal disclaimers that apply to the journal pertain.
References
- 1.Jemal A, Bray F, Center MM, et al. Global cancer statistics. CA Cancer J Clin. 2011;61(2):69–90. doi: 10.3322/caac.20107. [DOI] [PubMed] [Google Scholar]
- 2.Jemal A, Siegel R, Xu J, et al. Cancer statistics, 2010. CA Cancer J Clin. 2010;60(5):277–300. doi: 10.3322/caac.20073. [DOI] [PubMed] [Google Scholar]
- 3.Calin GA, Dumitru CD, Shimizu M, et al. Frequent deletions and down-regulation of micro- RNA genes miR15 and miR16 at 13q14 in chronic lymphocytic leukemia. Proc Natl Acad Sci U S A. 2002;99(24):15524–9. doi: 10.1073/pnas.242606799. [DOI] [PMC free article] [PubMed] [Google Scholar]
- 4.Almeida MI, Reis RM, Calin GA. MicroRNA history: Discovery, recent applications, and next frontiers. Mutat Res. 2011 doi: 10.1016/j.mrfmmm.2011.03.009. Epub ahead of print. [DOI] [PubMed] [Google Scholar]
- 5.Croce CM. Causes and consequences of microRNA dysregulation in cancer. Nat Rev Genet. 2009;10(10):704–714. doi: 10.1038/nrg2634. [DOI] [PMC free article] [PubMed] [Google Scholar]
- 6.Wu WK, Law PT, Lee CW, et al. MicroRNA in colorectal cancer: from benchtop to bedside. Carcinogenesis. 2011;32(3):247–253. doi: 10.1093/carcin/bgq243. [DOI] [PubMed] [Google Scholar]
- 7.Lea MA. Recently identified and potential targets for colon cancer treatment. Future Oncol. 2010;6(6):993–1002. doi: 10.2217/fon.10.53. [DOI] [PubMed] [Google Scholar]
- 8.Griffiths-Jones S, Grocock RJ, van Dongen S, et al. miRBase: microRNA sequences, targets and gene nomenclature. Nucleic Acids Res. 2006;34(database):D140–144. doi: 10.1093/nar/gkj112. [DOI] [PMC free article] [PubMed] [Google Scholar]
- 9.Bustin SA, Benes V, Garson JA, et al. The MIQE guidelines: minimum information for publication of quantitative real-time PCR experiments. Clin Chem. 2009;55(4):611–22. doi: 10.1373/clinchem.2008.112797. [DOI] [PubMed] [Google Scholar]
- 10.Lefever S, Hellemans J, Pattyn F, et al. RDML: structured language and reporting guidelines for real-time quantitative PCR data. Nucleic Acids Res. 2009;37(7):2065–9. doi: 10.1093/nar/gkp056. [DOI] [PMC free article] [PubMed] [Google Scholar]
- 11.Schmittgen TD, Livak KJ. Analyzing real-time PCR data by the comparative C(T) method. Nat Protoc. 2008;3(6):1101–8. doi: 10.1038/nprot.2008.73. [DOI] [PubMed] [Google Scholar]
- 12.Pfaffl MW. A new mathematical model for relative quantification in real-time RT-PCR. Nucleic Acids Res. 2001;29(9):e45. doi: 10.1093/nar/29.9.e45. [DOI] [PMC free article] [PubMed] [Google Scholar]
- 13.Galluzzi L, Aaronson SA, Abrams J, et al. Guidelines for the use and interpretation of assays for monitoring cell death in higher eukaryotes. Cell Death Differ. 2009;16(8):1093–1107. doi: 10.1038/cdd.2009.44. [DOI] [PMC free article] [PubMed] [Google Scholar]
- 14.Chaitanya GV, Steven AJ, Babu PP. PARP-1 cleavage fragments: signatures of cell-death proteases in neurodegeneration. Cell Commun Signal. 2010;8:31. doi: 10.1186/1478-811X-8-31. [DOI] [PMC free article] [PubMed] [Google Scholar]
- 15.Girardot M, Pecquet C, Boukour S, et al. miR-28 is a thrombopoietin receptor targeting microRNA detected in a fraction of myeloproliferative neoplasm patient platelets. Blood. 2010;116(3):437–445. doi: 10.1182/blood-2008-06-165985. [DOI] [PubMed] [Google Scholar]
- 16.Gottardo F, Liu CG, Ferracin M, et al. Micro-RNA profiling in kidney and bladder cancers. Urol Oncol. 2007;25(5):387–392. doi: 10.1016/j.urolonc.2007.01.019. [DOI] [PubMed] [Google Scholar]
- 17.Malzkorn B, Wolter M, Liesenberg F, et al. Identification and functional characterization of microRNAs involved in the malignant progression of gliomas. Brain Pathol. 2010;20(3):539–550. doi: 10.1111/j.1750-3639.2009.00328.x. [DOI] [PMC free article] [PubMed] [Google Scholar]
- 18.Spizzo R, Nicoloso MS, Croce CM, et al. SnapShot: MicroRNAs in cancer. Cell. 2009;137(3):586–586.e1. doi: 10.1016/j.cell.2009.04.040. [DOI] [PubMed] [Google Scholar]
- 19.Jiang L, Huang Q, Zhang S, et al. Hsa-miR-125a-3p and hsa-miR-125a-5p are downregulated in non-small cell lung cancer and have inverse effects on invasion and migration of lung cancer cells. BMC Cancer. 2010;10:318. doi: 10.1186/1471-2407-10-318. [DOI] [PMC free article] [PubMed] [Google Scholar]
- 20.Volinia S, Galasso M, Costinean S, et al. Reprogramming of miRNA networks in cancer and leukemia. Genome Res. 2010;20(5):589–99. doi: 10.1101/gr.098046.109. [DOI] [PMC free article] [PubMed] [Google Scholar]
- 21.López JA, Alvarez-Salas LM. Differential effects of miR-34c-3p and miR-34c-5p on SiHa cells proliferation apoptosis, migration and invasion. Biochem Biophys Res Commun. 2011;409(3):513–519. doi: 10.1016/j.bbrc.2011.05.036. [DOI] [PubMed] [Google Scholar]
- 22.Yang M, Yao Y, Eades G, et al. MiR-28 regulates Nrf2 expression through a Keap1-independent mechanism. Breast Cancer Res Treat. 2011 doi: 10.1007/s10549-011-1604-1. Epub ahead of print. [DOI] [PMC free article] [PubMed] [Google Scholar]
- 23.Arber N, Hibshoosh H, Moss SF, et al. Increased expression of cyclin D1 is an early event in multistage colorectal carcinogenesis. Gastroenterology. 1996;110(3):669–674. doi: 10.1053/gast.1996.v110.pm8608874. [DOI] [PubMed] [Google Scholar]
- 24.Diehl JA. Cycling to cancer with cyclin D1. Cancer Biol Ther. 2002;1(3):226–231. doi: 10.4161/cbt.72. [DOI] [PubMed] [Google Scholar]
- 25.Fu M, Wang C, Li Z, et al. Mini review: Cyclin D1: normal and abnormal functions. Endocrinology. 2004;145(12):5439–5447. doi: 10.1210/en.2004-0959. [DOI] [PubMed] [Google Scholar]
- 26.Arber N, Doki Y, Han EK, et al. Antisense to cyclin D1 inhibits the growth and tumorigenicity of human colon cancer cells. Cancer Res. 1997;57(8):1569–1574. [PubMed] [Google Scholar]
- 27.Kanai M, Hamada J, Takada M, et al. Aberrant expressions of HOX genes in colorectal and hepatocellular carcinomas. Oncol Rep. 2010;23(3):843–851. [PubMed] [Google Scholar]
- 28.Palakurthy RK, Wajapeyee N, Santra MK, et al. Epigenetic silencing of the RASSF1A tumor suppressor gene through HOXB3-mediated induction of DNMT3B expression. Mol Cell. 2009;36(2):219–230. doi: 10.1016/j.molcel.2009.10.009. [DOI] [PMC free article] [PubMed] [Google Scholar]
- 29.Lee S, Hwang KS, Lee HJ, et al. Aberrant CpG island hypermethylation of multiple genes in colorectal neoplasia. Lab Invest. 2004;84(7):884–893. doi: 10.1038/labinvest.3700108. [DOI] [PubMed] [Google Scholar]
- 30.Björnsson JM, Larsson N, Brun AC, et al. Reduced proliferative capacity of hematopoietic stem cells deficient in Hoxb3 and Hoxb4. Mol Cell Biol. 2003;23(11):3872–3883. doi: 10.1128/MCB.23.11.3872-3883.2003. [DOI] [PMC free article] [PubMed] [Google Scholar]
- 31.Krosl J, Baban S, Krosl G, et al. Cellular proliferation and transformation induced by HOXB4 and HOXB3 proteins involves cooperation with PBX1. Oncogene. 1998;16(26):3403–3412. doi: 10.1038/sj.onc.1201883. [DOI] [PubMed] [Google Scholar]
- 32.Lee JH, Marshall JC, Steeg PS, et al. Altered gene and protein expression by Nm23-H1 in metastasis suppression. Mol Cell Biochem. 2009;329(1-2):141–148. doi: 10.1007/s11010-009-0124-3. [DOI] [PMC free article] [PubMed] [Google Scholar]
- 33.Steeg PS, Bevilacqua G, Kopper L, et al. Evidence for a novel gene associated with low tumor metastatic potential. J Natl Cancer Inst. 1988;80(3):200–204. doi: 10.1093/jnci/80.3.200. [DOI] [PubMed] [Google Scholar]
- 34.Steeg PS, Bevilacqua G, Pozzatti R, et al. Altered expression of NM23, a gene associated with low tumor metastatic potential, during adenovirus 2 Ela inhibition of experimental metastasis. Cancer Res. 1988;48(22):6550–6554. [PubMed] [Google Scholar]
- 35.Marshall JC, Collins J, Marino N, et al. The Nm23-H1 metastasis suppressor as a translational target. Eur J Cancer. 2010;46(7):1278–1282. doi: 10.1016/j.ejca.2010.02.042. [DOI] [PMC free article] [PubMed] [Google Scholar]
- 36.Boissan M, De Wever O, Lizarraga F, et al. Implication of metastasis suppressor NM23-H1 in maintaining adherens junctions and limiting the invasive potential of human cancer cells. Cancer Res. 2010;70(19):7710–7722. doi: 10.1158/0008-5472.CAN-10-1887. [DOI] [PubMed] [Google Scholar]
- 37.Suzuki E, Ota T, Tsukuda K, et al. nm23-H1 reduces in vitro cell migration and the liver metastatic potential of colon cancer cells by regulating myosin light chain phosphorylation. Int J Cancer. 2004;108(2):207–211. doi: 10.1002/ijc.11546. [DOI] [PubMed] [Google Scholar]
Associated Data
This section collects any data citations, data availability statements, or supplementary materials included in this article.