

Abstract
How a long strand of genomic DNA is compacted into a mitotic chromosome remains one of the basic questions in biology. The nucleosome fibre, in which DNA is wrapped around core histones, has long been assumed to be folded into a 30-nm chromatin fibre and further hierarchical regular structures to form mitotic chromosomes, although the actual existence of these regular structures is controversial. Here, we show that human mitotic HeLa chromosomes are mainly composed of irregularly folded nucleosome fibres rather than 30-nm chromatin fibres. Our comprehensive and quantitative study using cryo-electron microscopy and synchrotron X-ray scattering resolved the long-standing contradictions regarding the existence of 30-nm chromatin structures and detected no regular structure >11 nm. Our finding suggests that the mitotic chromosome consists of irregularly arranged nucleosome fibres, with a fractal nature, which permits a more dynamic and flexible genome organization than would be allowed by static regular structures.
Keywords: chromosome structure, cryo-EM, fractal structure, X-ray sacattering, 30-nm chromatin fibre
Introduction
During eukaryotic cell division, mitotic chromosomes are formed to ensure the faithful transmission of replicated genomic DNA into two daughter cells (Alberts et al, 2007). A long strand of DNA is wrapped around core histones to form a nucleosome structure like ‘beads on a string’ (Kornberg and Lorch, 1999). It has long been assumed that this nucleosome fibre is folded into 30-nm chromatin fibres (Alberts et al, 2007) and that condensins are involved in further regular chromatin folding (Swedlow and Hirano, 2003; Kireeva et al, 2004), although the folding processes remain unclear (Hirano, 2006; Tremethick, 2007; Maeshima and Eltsov, 2008; Ohta et al, 2010).
Several models of chromatin fibres have been proposed, the diameters of which are around 30 nm (Finch and Klug, 1976; Schalch et al, 2005; Robinson et al, 2006). Extensive data based on biochemistry, conventional electron microscopy (EM) and small-angle X-ray scattering (SAXS) support various 30-nm chromatin fibre structures (Finch and Klug, 1976; Langmore and Paulson, 1983; Woodcock et al, 1984; Widom and Klug, 1985; Bordas et al, 1986; Gilbert et al, 2004; Schalch et al, 2005; Robinson et al, 2006). However, cryo-EM studies have demonstrated 30-nm chromatin fibre structures in only a few highly specialized cell types (Woodcock, 1994), and cryo-EM data have argued strongly against the existence of 30-nm chromatin structures in mitotic chromosomes in situ (McDowall et al, 1986; Eltsov et al, 2008; Maeshima and Eltsov, 2008).
To resolve these long-standing discrepancies, we performed a comprehensive and quantitative investigation of the mitotic chromosome structure using cryo-EM, SAXS and ultra-SAXS (USAXS). SAXS analysis detects periodic structures in biological materials in solution. Cryo-EM allows one to observe biological samples in a frozen hydrated state, although conventional EM can observe only fixed and dehydrated samples, which can produce various potential artefacts (Dubochet and Sartori Blanc, 2001; Maeshima et al, 2010b). Our data demonstrate that the 30-nm structures observed in SAXS studies are due to contamination by regularly spaced ribosome aggregates and do not originate from the chromosomes themselves. Also, no regular periodic structure >11 nm was detected within a range extending up to the diameter of whole chromosomes. We suggest that the mitotic chromosome consists of irregularly arranged nucleosome fibres, with a fractal nature.
Results
X-ray scattering profile of mitotic HeLa chromosomes
To explore possible periodic structures including 30-nm fibres in mitotic chromosomes, we performed SAXS measurements of mitotic HeLa chromosomes using the synchrotron X-ray source at SPring-8. As previous reports suggested that chicken erythrocyte nuclei, which are almost completely transcriptionally silenced, contain 30-nm chromatin fibres (Langmore and Schutt, 1980; Woodcock, 1994), these were used as positive controls in the present study.
In SAXS measurements, membranous structures, including small vesicles, generate scattering maxima at 30–40 nm that add a great deal of ‘noise’ to the signal; therefore, mitotic HeLa chromosomes and chicken erythrocyte nuclei were isolated in physiological salt buffer from mitotic HeLa cells and chicken erythrocytes, respectively (Langmore and Schutt, 1980; Langmore and Paulson, 1983; Maeshima et al, 2005). We did not carry out any chemical fixation or alcohol dehydration, which are common in conventional EM sample processing, to avoid possible artefacts caused by such treatments (Dubochet and Sartori Blanc, 2001; Maeshima et al, 2010b). The samples were placed in a quartz glass capillary and exposed to an X-ray beam for 1 s, during which the scattering patterns were recorded. Several sequential exposures to the X-ray beam did not change the profile of the scattering pattern (Maeshima, unpublished data), confirming that no significant radiation damage to the chromatin structure had occurred.
SAXS analysis of the erythrocyte nuclei revealed a sharp 30-nm peak and two prominent peaks at ∼11 and ∼6 nm (Figure 1A; Table I). We also detected apparent 30-nm structures in the chicken erythrocyte nuclei by cryo-EM (Figure 1B and C), and a further power spectrum analysis of the chromatin regions revealed periodic structures (Supplementary Figure S1). These results were consistent with those of previous reports (Langmore and Schutt, 1980; Woodcock, 1994). Therefore, we concluded that we should see 30-nm structures by SAXS and cryo-EM if they indeed exist.
Figure 1.

SAXS profile of mitotic HeLa chromosomes. (A) A typical SAXS pattern of the chicken erythrocyte nuclei using the BL45XU beamline at SPring-8. In the plot of log(I × S2) versus S, I is the measured average intensity and S is the size of the scattering vector, the inverse of the structure or spacing size (for details, see Materials and methods). Note that as size variations may exist in the structures, peaks in the measurements may also exhibit some variation. The chicken erythrocyte nuclei produced a sharp 30-nm peak (arrow). In addition, two peaks of ∼11 and ∼6 nm were prominent (brackets). (B) Dot-like 30-nm structures in the chicken erythrocyte nucleus were observed by cryo-EM (see also Supplementary Figure S1). Bar indicates 5 μm. (C) High-resolution cryo-EM image of a chicken erythrocyte nucleus. Long and short bars indicate 200 and 30 nm, respectively. (D) Two types of nucleosome positioning: face-to-face, with ∼6-nm spacing, and edge-to-edge, with ∼11-nm spacing. Note that in helical fibres such as the 30-nm chromatin fibre, edge-to-edge spacing likely corresponds to helical pitch (Figure 6A). The nucleosome model was taken from Davey et al (2002) (yellow, DNA; red, core histones). (E, F) Typical SAXS patterns of mitotic HeLa chromosomes. In (E), a SAXS scattering pattern covering larger angles is shown to reveal smaller structures. Three peaks at ∼6, ∼11 and ∼30 nm were detected (arrows) (see also Supplementary Figure S2A and B).
Table 1. Comparison of the scattering profile between erythrocyte nuclei (Figure 1A), modelled 30-nm chromatin fibres (Figure 5A), mitotic HeLa chromosomes with ribosomes (Figure 3C) and mitotic HeLa chromosomes without ribosomes (Figure 3C).
| ∼30-nm Peak | ∼11-nm Peak | ∼6-nm Peak | |
|---|---|---|---|
| Erythrocyte nuclei (30-nm chromatin fibres) | +++ | +++ | +++ |
| Single 30-nm chromatin fibre simulation (two-start) | ND | ++++ | +++ |
| Mitotic HeLa chromosomes (with ribosomes) | +++ | + | +++ |
| Mitotic HeLa chromosomes (without ribosomes) | − | + | +++ |
| Relative peak intensity is represented as ‘+’. ND, not determined. | |||
We next focused on the mitotic HeLa chromosomes. Almost 30 years ago, Langmore and Paulson (1983) reported SAXS peaks at ∼30, ∼11 and ∼6 nm in the mitotic chromosomes. They concluded that the 6- and 11-nm peaks were derived from the positioning of nucleosomes on their flat faces and from edge-to-edge positioning, respectively (Figure 1D) (Langmore and Paulson, 1983). These authors also suggested that the 30-nm peak represented the side-by-side packing of 30-nm chromatin fibres, which has long been regarded as strong evidence for the existence of these fibres in chromosomes. Consistent with their data, we detected peaks at ∼30, ∼11 and ∼6 nm as shown in Figure 1E and F that show the peaks in the larger structures more clearly. In contrast to the erythrocyte nuclei, the ∼6-nm peak was prominent, whereas the ∼11-nm peak was rather faint (see also Supplementary Figure S2A and B and Table I).
The 30-nm SAXS peak originates from ribosome aggregations
Although we successfully reproduced the earlier SAXS findings (Figure 1E and F; Supplementary Figure S2A and B), in a previous cryo-EM study, we found no evidence of 30-nm structures in mitotic chromosomes (Eltsov et al, 2008; Maeshima and Eltsov, 2008), indicating a striking inconsistency between the two techniques. To identify the source of the 30-nm SAXS peak, we examined isolated chromosome samples by cryo-EM (Figure 2A) using the chromosome isolation procedure of Langmore and Paulson (1983). Unexpectedly, we observed extensive aggregates of electron-dense granules attached to the chromosome surface (chromosome region:aggregate region=1:0.35) (Figure 2A). Based on their size, these granules were very likely to be ribosomes; to further test this suggestion, we performed immunostaining (Figure 2B; Supplementary Figure S3) and western blotting (Figure 2D) (Uchiumi et al, 1990).
Figure 2.

Ribosome aggregates around chromosomes. (A) Cryo-EM image of the chromosome clusters (cross-sections). Many black dots were observed on the chromosome surface. Note that knife marks (thick arrow) and compression marks (thin arrow) were observed. Bars indicate 1 μm. An enlarged image of the region outlined with a box is depicted on the right. A black dot region is surrounded by a broken line (Ri). A chromosome part is marked as ‘Xs’. Long and short bars indicate 0.5 μm and 30 nm, respectively. (B) Immunostaining with anti-P antibody against a ribosomal component suggested that the peripheral black dots were ribosome aggregates (Uchiumi et al, 1990). DNA (DAPI), a ribosome and merged images of two chromosome clusters are shown. Bar indicates 10 μm (see also (D) and Supplementary Figure S3). (C) Power spectrum (Fourier transform) analyses of the aggregated regions, the chromosome regions and whole cryo-EM images. A 30-nm peak (arrow) was seen in the aggregated region (green dots) and whole images (blue dots). (D) Ribosome removal was verified by western blotting (Uchiumi et al, 1990).
The ribosome particles in the aggregates seemed to be regularly spaced (Figure 2A). To detect the periodicity on the cryo-EM images, we performed power spectra (Fourier transform) analyses. When the chromosome regions were selectively analysed, we did not detect a 30-nm peak, consistent with our previous finding (Eltsov et al, 2008). However, the ribosome aggregates showed a prominent ∼30-nm peak (Figure 2C). The 30-nm signal from the ribosome region was so strong that the whole image still produced a notable 30-nm peak (Figure 2C). This result suggested that the 30-nm peak in SAXS resulted from ribosome aggregates (Figure 2C).
To further test whether the ribosome aggregates were responsible for the 30-nm SAXS peak, we removed them by washing the chromosomes with an isotonic buffer containing polyamine and EDTA (buffer A) (Lewis and Laemmli, 1982; Paulson and Langmore, 1983; Maeshima and Laemmli, 2003). This buffer maintains the size and shape of chromosomes (Supplementary Figure S4). The preparation was then resuspended in the original isolation buffer (IB) (Langmore and Paulson, 1983). This treatment removed most of the ribosome aggregates from the chromosome surfaces (Figure 3A), consistent with our biochemical data (Figure 2D). As expected, the 30-nm peak in the power spectra and SAXS pattern disappeared almost completely (Figure 3B and C). The remaining peaks at larger angles, which came mainly from the internal structures of the nucleosomes, were unchanged (Figure 3C). Indeed, a ribosome fraction from Xenopus egg extracts produced a sharp peak around 30 nm (Figure 3D). Our results clearly indicated that the 30-nm peak in SAXS was derived from aggregates of ribosomes and not from the chromosomes themselves (Figure 3E). Therefore, we concluded that almost no 30-nm chromatin structures exist in mitotic chromosomes.
Figure 3.

The 30-nm peak on the SAXS profile was derived from ribosome aggregates. (A) Removal of ribosome aggregates. Isolated chromosomes were washed in buffer A (polyamine + EDTA) (Lewis and Laemmli, 1982; Paulson and Langmore, 1983; Maeshima and Laemmli, 2003) and then returned to IB containing 5 mM Mg2+ (Paulson and Langmore, 1983). Cryo-EM showed that this treatment removed most of the aggregates. Note that knife marks (arrow) were observed. Bar indicates 1 μm. The inset shows an enlarged image. Long and short bars indicate 0.5 μm and 30 nm, respectively. (B) Power spectrum (Fourier transform) analysis of cryo-EM images after removal of ribosome aggregates. Neither whole images (blue dots) nor chromosome regions (red dots) showed a peak at ∼30 nm (arrow). (C) In SAXS analysis, only the 30-nm peak disappeared after removal of ribosome aggregates (upper), whereas the other peaks remained. For comparison, Figure 1E is reproduced (lower). (D) A ribosomal fraction from Xenopus egg extracts (kindly provided by Dr T Hirano, RIKEN) produced a 30-nm peak (arrow) on SAXS. (E) Model explaining the results: the 30-nm peak in SAXS comes from regularly spaced aggregates of ribosomes, and not from the chromosomes themselves.
A fractal nature of mitotic chromosomes revealed by USAXS
Although to date, no 30-nm chromatin structure has been detected, the question remains whether any larger regular structures exist in the mitotic chromosomes. To address the challenge of investigating an entire chromosomal region by X-ray scattering, we developed a new instrument for USAXS at SPring-8. Figure 4A shows a schematic representation of the experimental setup. We examined the performance of this instrument using ∼1000-nm latex particles as a control, which produced a pattern of fringes in the range of ∼50–1000 nm (Figure 4B). These fringes and their slopes were almost identical to those of the computationally simulated scattering pattern (Figure 4C), verifying that the entire chromosome diameter could be covered with this instrument. By USAXS measurement, we did not detect notable regular structures in mitotic chromosomes in the range of ∼50–1000 nm (Figure 4D; Supplementary Figure S5A). Importantly, we found that the scattering pattern of chromosomes followed the power law relationship between scattering intensity and scattering vector (the inverse of structure size) over a very wide range (Figure 4E; Supplementary Figure S5B) (Schmidt, 1989). This scattering property suggested irregular folding of nucleosome fibres, with a fractal nature.
Figure 4.

Mitotic chromosomes lack notable higher-order structures. (A) Experimental setup of USAXS using the BL29XUL beamline at SPring-8 (for details, see Materials and methods). This system accomplished efficient USAXS measurements using a compact apparatus. (B) USAXS study of latex particles with diameters of ∼1000 nm showed clear fringes over a wide range (∼50–1000 nm). The profile is plotted as log(I) versus log(S). (C) A computer simulation of latex particles with diameters of ∼1000 nm produced a pattern highly similar to that measured. (D) By USAXS, no notable structures around 100–150 or 200–250 nm were detected (see also Supplementary Figure S5A). (E) The scattering intensity obeyed the power law with respect to structure size and spacing. To determine the nature of the structure at sizes over 11 nm, the logarithm of the scattering intensity (I) and size of the scattering vector (S) were taken from the data in (D) (Schmidt, 1989). A plot of log (I) versus log (S) on a straight line (red line) covered a wide range, extending over nearly four orders of magnitude. Least-squares fitting showed that I is proportional to S to the power of −3.12 (R=0.990) (Schmidt, 1989), suggesting that chromosomes do not possess notable regular structures over a very wide scale and exhibit a fractal nature of genome organization (see also Supplementary Figure S5B).
Discussion
In the present study, to complement the structural information obtained by cryo-EM, we exploited the highly penetrative power of X-rays to explore the bulk structure of mitotic chromosomes in solution over a wide range (from nanometres to micrometres). Combining our cryo-EM, SAXS and USAXS results yielded 6- and 11-nm peaks but none >11 nm, demonstrating that chromosomes do not have notable regular structures on a chromosome-diameter scale. We suggest that the organization of mitotic chromosomes is irregular arrangements of the nucleosome (beads on a string) fibre, with a fractal nature (Figure 5A). This notion may be compatible with two recently proposed fractal organization models of interphase nuclei (Bancaud et al, 2009; Lieberman-Aiden et al, 2009; see also Takahashi, 1989). Although these three models came from different aspects (different procedures and cell-cycle phases) and their direct comparison is difficult, we consider that the evidence obtained from the different angles would strengthen the fractal concept.
Figure 5.

Chromosome structure model. (A) Chromosomes consist essentially of irregularly folded nucleosome (beads on a string) fibres. Condensins (blue) hold the nucleosome fibres (red) globally around the chromosome centre. Locally, the nucleosome fibre is folded in an irregular or disordered manner, forming loop structures that are collapsed towards the chromosome centre (blue). The collapsed fibre (red) forms a domain that could be compatible with the large module observed by the Belmont group (Strukov et al, 2003). (B) Dynamic melted nucleosome. Under dilute conditions with low nucleosome fibre and cation concentrations, nucleosome fibres can form 30-nm chromatin fibres via intra-fibre nucleosome associations. An increase in fibre concentration, as a consequence of an increase in cation concentration and/or a molecular crowding effect, results in inter-fibre nucleosomal contacts that interfere with intra-fibre nucleosomal associations. Nucleosomes of adjacent fibres interdigitate, leading to a polymer melt-like structure. Note that in these illustrations, we show a highly simplified two-dimensional nucleosome model, which does not show the details of chromatin fractal organization.
In the control study, we observed a 30-nm chromatin structure in chicken erythrocyte nuclei by SAXS and cryo-EM. The erythrocyte nuclei did not contain detectable ribosomes (Supplementary Figure S6). In the 30-nm chromatin fibre, intra-fibre nucleosomal association was dominant (Figure 5B). Considering the structural model in Figure 6A (Schalch et al, 2005; Robinson and Rhodes, 2006), formation of the 30-nm chromatin fibre requires that the frequencies of face-to-face (∼6-nm peak) and edge-to-edge (∼11-nm peak) positioning should be similar (Table I). Here, note that edge-to-edge spacing likely corresponds to the helical pitch in the 30-nm chromatin fibre. Consistent with this notion, SAXS analysis of erythrocyte nuclei showed two prominent peaks of ∼11 and ∼6 nm (Figure 1A; Table I). This profile seemed to be similar to the simulated scattering profile based on the two-start helix 30-nm chromatin model (Schalch et al, 2005) (Figure 6B; Table I). In agreement with a recent cryo-EM study (Scheffer et al, 2011), this finding suggested that the nuclear organization of chromatin in chicken erythrocytes could be explained by a two-start helix 30-nm chromatin fibre. Formation of 30-nm chromatin fibres in these silenced nuclei may be a rare case involving histone modifications and/or specific protein binding for robust silencing (Thomas, 1984; Grigoryev and Woodcock, 1993; Kizilyaprak et al, 2011; Kowalski and Palyga, 2011).
Figure 6.

Computer simulation of two 30-nm chromatin fibre models. (A) Two well-known structural models of 30-nm chromatin fibres: the one-start helix (solenoid, left) and two-start helix (zigzag ribbon, right). Their atomic coordinate models (kindly provided by Dr D Rhodes, LMB, UK) are shown (Schalch et al, 2005; Robinson and Rhodes, 2006). The drawings were generated using MOLSCRIPT (Kraulis, 1991). (B) Based on the atomic model, the scattering profiles obtained with the one-start helix (red line) and two-start helix (blue line) were computationally simulated (for details, see Materials and methods). As the scattering was obtained from a single 30-nm chromatin fibre model shown in (A), the 30-nm peak was not shown. Two peaks of ∼11 and ∼6 nm were prominent (brackets) in the two-start model (blue line) and the chicken erythrocyte nuclei (cyan line). Note that the simulated scattering profile of the two-start helix (blue line) seemed to be qualitatively similar to that of chicken erythrocyte nuclei (cyan line).
In compact native chromosomes, inter-fibre nucleosome associations become increasingly dominant (Figure 5B) (Eltsov et al, 2008; Maeshima et al, 2010a). Nucleosome fibres are highly interdigitated, such that they are prevented from forming 30-nm chromatin fibres, leading to irregular folding of the nucleosome fibres (polymer melt-like structure) (Figure 5A and B) (Eltsov et al, 2008; Maeshima et al, 2010a). The scattering profile of mitotic chromosomes shows that the ∼6-nm peak (face-to-face positioning) predominates over the ∼11-nm peak (edge-to-edge positioning) (Figure 3C, upper; Table I). As formation of the 30-nm chromatin fibre requires similar frequencies of face-to-face (∼6-nm peak) and edge-to-edge (∼11-nm peak) positioning (Table I), Figure 3C (upper) again supports the near absence of regular 30-nm chromatin fibres from chromosomes.
For our structural study, we assumed highly ‘regular’ 30-nm chromatin fibres. However, natively assembled chromatin is likely to have defects: for example, missing nucleosomes, variations in linker length and variations in posttranslational modifications. Although we cannot exclude the possibility that ‘loose’ 30-nm chromatin fibres may exist in mitotic chromosomes, we consider it unlikely, at least in the majority of chromosomes, because our computer simulation demonstrated that bundles of loose 30-nm fibres with variations in their diameters (±15%) and torsions (±15%) can still produce a sharp 30-nm peak by scattering (Figure 7; for details see Materials and methods). In addition, Diesinger and Heermann (2009) reported that defects, such as missing nucleosomes, can easily disrupt 30-nm chromatin fibres.
Figure 7.

Computer simulation of ‘loose’ 30-nm fibre bundles with size and torsional variations. (A) Compact bundles of 30-nm fibres, with variations in their diameter (±15%) and torsion (±15%), were computationally modelled (for details, see Materials and methods). The upper image is the top view, and the bottom is the side view. (B) The modelled 30-nm fibre bundles produced a peak at ∼30 nm (for details, see Materials and methods).
We suggest that the organization of mitotic chromosomes involves irregular arrangements of nucleosome fibres (Figure 5A). One possible explanation why the nucleosome fibre is organized globally into a ‘rod shape’ (e.g., mitotic chromosome) rather than a ‘sphere’ is as follows. As condensin, which is essential for chromosome condensation (Hirano, 2006), forms an axis in the chromosome (Laemmli et al, 1978; Maeshima and Laemmli, 2003; Swedlow and Hirano, 2003; Ono et al, 2004; Hirota et al, 2004), it holds the nucleosome fibres globally around the chromosomal centre. If condensins bind to specific sites on the genome, forming loops that are able to interact with one another, then self-assembled axial structures will be formed (Laemmli et al, 1978). Alternatively, the formation of regular loops could be sufficient to generate a rod shape, as the loops would repel one another due to entropic effects (Marko and Siggia, 1997; Kleckner et al, 2004). The chromosome would then acquire a reproducible rod shape. The loops are collapsed and irregularly folded to make a domain (red line in Figure 5A) that may be compatible with the large module observed by the Belmont group (Strukov et al, 2003).
Irregular folding predicts an increase in the dynamics and flexibility of the nucleosome fibre (Eltsov et al, 2008; Maeshima et al, 2010a), as small objects such as nucleosomes have fewer physical constraints than larger regular structures, such as 30-nm chromatin fibres. These properties of the nucleosome fibre could act as a physical driving force in chromosome assembly. We and also Fussner et al (2011) have postulated that a similar irregular folding state exists in the majority of active interphase nuclei (Maeshima et al, 2010a). In contrast to the regular folding of classical models, irregular folding implies a high degree of DNA accessibility and may have several advantages in template-directed biological processes in interphase nuclei, including RNA transcription and DNA replication, repair and recombination. For example, in transcriptional regulation, the dynamic movement of nucleosome fibres will help with the targeting of transcription complexes because target sequences are more often exposed, while regular folding structures such as 30-nm chromatin fibres can hide target sequences. Dynamic irregular folding can also easily form loops, prompting promoter and enhancer interactions.
Materials and methods
HeLa-chromosome preparation and immunofluorescence study
Mitotic chromosomes were isolated from HeLa cells essentially as described previously (Langmore and Paulson, 1983; Maeshima and Laemmli, 2003; Maeshima et al, 2005). To avoid the effects of prolonged mitotic arrest with nocodazole, a brief (2 h) treatment with the drug followed by mitotic shake-off was also used to collect mitotic HeLa cells. To resolve the long-standing discrepancies between cryo-EM and SAXS, the SAXS protocol of Langmore and Paulson (1983) was reproduced exactly (Paulson and Langmore, 1983). Isolated chromosomes were placed in IB (10 mM HEPES-KOH (pH 7.5), 10 mM NaCl, 5 mM MgCl2, 0.1 mM phenylmethylsulphonyl fluoride (PMSF) and 0.1% NP40) and subjected to SAXS measurements. Isolated chromosomes maintained under more physiological conditions (10 mM HEPES-KOH (pH 7.5), 100 mM NaCl, 5 mM MgCl2, 0.1 mM PMSF and 0.1% NP40) produced a similar scattering profile with the same three peaks (Supplementary Figure S2A and B). To remove ribosome aggregates from chromosome surfaces, isolated chromosomes were suspended briefly in buffer A (15 mM Tris–HCl (pH 7.5), 80 mM KCl, 2 mM EDTA, 2 mM spermine, 5 mM spermidine, 0.1 mM PMSF and 0.05% digitonin), then centrifuged and resuspended in IB for measurement. Langmore and Paulson (1983) tested several conditions (Paulson and Langmore, 1983). We were able to consistently reproduce their SAXS profiles (e.g., Supplementary Figure S2A and B; other conditions are not shown). Chicken erythrocyte nuclei were prepared and measured as described by Langmore and Schutt (1980). Ribosome fractions were isolated from Xenopus egg extracts by ultracentrifugation (kindly provided by Dr T Hirano, RIKEN).
For immunofluorescence, isolated chromosomes were suspended in HMK buffer (10 mM HEPES-KOH (pH 7.4), 1 mM MgCl2 and 100 mM KCl), attached to poly-L-lysine-coated coverslips by centrifugation at 400 g for 5 min, and fixed in HMK buffer including 1% formaldehyde. Immunofluorescence was performed as described by Maeshima et al (2006, 2010c). Image stacks were recorded with a DeltaVision microscope (Applied Precision) using a step size of 0.2 μm with a × 100/1.40 UPlanSApo objective (Olympus) and deconvolved.
SAXS and USAXS experiments
SAXS and USAXS experiments were performed at SPring-8 using the BL45XU and BL29XUL beamlines, respectively. Following the approach of Langmore and Paulson (1983) (Paulson and Langmore, 1983), most of the SAXS and USAXS data in this paper are shown as plots of log(I × S2) versus S, obtained after subtracting buffer scattering. Here, I and S are the average intensity and size of the scattering vector, respectively. I × S2 gives the true relative strength (power) of the structural periodicities in the samples. An arbitrary periodicity of D nm in the object gives rise to a peak in the X-ray scattering at a reciprocal distance (1/D) nm−1. Thus, ‘30-nm peak’ refers to a scattering peak at S=0.033 nm−1. The data were averaged within concentric annuli of different radii about the experimental centre to yield the average intensity I as a function of S.
BL45XU was set up for the SAXS experiment as follows (Fujisawa et al, 2000). The X-ray wavelength and sample-to-detector distances were 0.9 Å (13.8 keV) and 2.1 m (Figures 1A and E and 3C and D) or 3.6 m (Figure 1F; Supplementary Figure S2A and B), respectively. HeLa-chromosome samples were collected in quartz glass capillaries (2 mm in diameter; Tohso) by gentle centrifugation, and the chromosome regions were exposed to the X-ray beam for 1 s. Scattering data for the chromosome samples and buffer were collected at room temperature using an imaging plate system (R-AXIS IV++; Rigaku) (Figures 1A and E and 3C and D) or a cooled charge-coupled device (CCD) equipped with an X-ray image intensifier (Fujisawa et al, 2000) (Figure 1F; Supplementary Figure S2A and B).
For USAXS measurements, a coherent X-ray diffraction instrument (Nishino et al, 2009a, 2009b) was used for high-quality data acquisition in the ultrasmall-angle region. Figure 4A shows the experimental setup. A monochromatic 8 keV X-ray beam illuminated the HeLa-chromosome pellet through a 20-μm pinhole. As described above, the chromosome pellets were formed in quartz glass capillaries (1 mm in diameter; Tohso), which were then sealed with epoxy resin (Araldite; KONISHI). The chromosome regions in the capillary were exposed to the X-ray beam for 10 s to obtain small-angle data, and for 100 s to obtain large-angle data. Small-angle scattering from the sample was recorded with a direct-illumination CCD detector 1.95 m downstream of the sample. To remove parasitic scattering from the pinhole, the instrument was equipped with two L-shaped guard slits and a beamstop to block the quadrant area of the CCD detector. The entire instrument, including the chromosome samples, was maintained in a vacuum to avoid air scattering noise.
Cryo-EM and image analysis
Chromosome freezing and cryosectioning were performed essentially as described previously (Eltsov et al, 2008). Chromosome suspensions were transferred into gold-plated copper carriers with a 0.1-mm indentation (Engineering Office M Wohlwend GmbH) and cryo-fixed using a HPM010 high-pressure freezer (Boeckeler Instruments). Vitreous sections were collected on C-flat grids (Protochips) or Lacey Carbon Grids (Polysciences) using a charging device (Haug Static Control Products). Grids with the cryosections were mounted on a Gatan 626 cryoholder (Gatan), and the samples were observed using a CM 100 transmission electron microscope (FEI). Vitreous sections with minimal cutting distortion were selected for image acquisition. Images of the chromosomes were recorded at 100 kV with a 2 k × 2 k TemCam-F224HD CCD camera (Tietz Video and Image Processing Systems). The contrast transfer function was corrected, and one-dimensional rotationally averaged power spectra of the images were calculated as described previously (Eltsov et al, 2008). The contrast transfer function was corrected by deconvolution using CTFMIX. Power spectra of individual images were calculated using SumPS (Conway and Steven, 1999) and averaged using KaleidaGraph 4.0 (Synergy Software).
Computer simulation of latex particles and model scattering profiles
The USAXS scattering pattern of latex particles was simulated using the following equation:
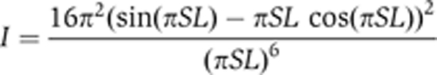 |
where L is the diameter of a single latex particle. The distribution of the diameter was assumed to be Gaussian, with mean and standard deviation of 1010 and 10 nm, respectively (Figure 4C).
SAXS profiles of the interdigitated one-start helix model and two-start helical crossed-linker model were examined using a computer simulation based on their atomic coordinates (gifts from Dr Rhodes, LMB, UK). SAXS profiles of the two models were calculated with the following equation:
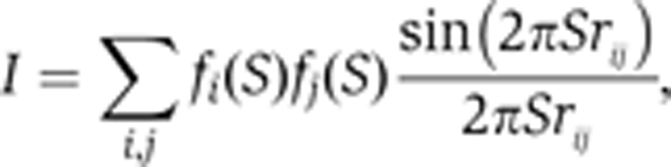 |
where fi(S) and rij are the form factor of the ith atom and the distance between the ith and jth atoms, respectively. Here, the summation was over non-hydrogen atoms in the model (Figure 6B).
Computer simulation of an ∼30-nm fibre bundle and model scattering profiles
To confirm that the ∼30-nm fibre bundles produced the ∼30-nm peak, a computer simulation was performed (Figure 7B). In the simulation, finer structures (i.e., those below ∼30-nm resolution) were not considered. The ∼30-nm fibre bundle was modelled as follows. (i) A set of two-dimensional circles with a random Gaussian distribution of diameters with a peak ∼30 nm was generated. (ii) The spatial distribution of the circles was optimized using the simulated-annealing molecular dynamics (MD) simulation in two dimensions. (iii) From the set of circles, a bundle of fibres was generated in three dimensions. In this process, the height of the bundle was randomly determined, and all fibres were tilted slightly around the origin. The distributions of the height and tilt angles were Gaussian. (iv) Numerous pseudo-particles were generated randomly and uniformly inside each fibre at a density of ∼0.01 particles nm–3. The table below summarizes the modelling parameters. The spatial distribution of the pseudo-particles modelled above was then used to compute the SAXS pattern, I, with the following equation:
 |
where rij is the distance between the i-th and j-th particles. Here, it was assumed that the electron density distribution of a pseudo-particle is Gaussian around the centre, with a standard deviation (σ) of 3 nm. SAXS profiles for the 1000 bundles of ∼30-nm fibres were simulated and averaged.
Parameters used in computer simulations:

Supplementary Material
Acknowledgments
We are grateful to T Fujisawa, T Hayakawa, J Dubochet for technical support and K Yokomizo, A Watanabe and Y Sasaki for providing technical assistance. We would like to thank D Rhodes for providing models of the 30-nm fibres; T Uchiumi for the anti-P antibody; T Hirano for providing the Xenopus ribosome fraction; B Earnshaw for DT40 cells; S Jun, B Stern, J Kim, T Cremer, T Sutani and M Shimura for critical reading of the manuscript; and Y Hiraoka, J Cooper, K Nasmyth, A Belmont, N Kleckner, J Paulson, M Yamamoto and M Nakasako for helpful discussion and support. We also thank I Hihara for his professional illustrations. This work was supported by a grant-in-aid for the Promotion of XFEL Research of MEXT, a MEXT grant, CREST and a MHLW grant for Advanced Medical Technology. ME and ASF were supported by the 3D-EM Network of Excellence within Research Framework Program 6 of the European Commission. HT and SH are JSPS fellow.
Author contributions: KM designed the project. KI and KM performed the SAXS measurements at BL45 of SPring-8. ME performed the cryo-EM study and analysed the image data. YN developed the apparatus for USAXS. YN, YT, KI and KM performed the USAXS measurements at BL29 of SPring-8. YJ performed the computer simulation. YJ, KI and KM analysed the scattering data. HT, KM and SH performed the immunostaining experiment. YN and ME provided essential suggestions throughout the project. ASF, NI and TI provided advice and support on the project. KM wrote the manuscript.
Footnotes
The authors declare that they have no conflict of interest.
References
- Alberts B, Johnson A, Lewis J, Raff M, Roberts K, Walter P (2007) Molecular Biology of the Cell, Fifth Edition. New York: Garland Science [Google Scholar]
- Bancaud A, Huet S, Daigle N, Mozziconacci J, Beaudouin J, Ellenberg J (2009) Molecular crowding affects diffusion and binding of nuclear proteins in heterochromatin and reveals the fractal organization of chromatin. EMBO J 28: 3785–3798 [DOI] [PMC free article] [PubMed] [Google Scholar]
- Bordas J, Perez-Grau L, Koch MH, Vega MC, Nave C (1986) The superstructure of chromatin and its condensation mechanism. II. Theoretical analysis of the X-ray scattering patterns and model calculations. Eur Biophys J 13: 175–185 [DOI] [PubMed] [Google Scholar]
- Conway JF, Steven AC (1999) Methods for reconstructing density maps of ‘single’ particles from cryoelectron micrographs to subnanometer resolution. J Struct Biol 128: 106–118 [DOI] [PubMed] [Google Scholar]
- Davey CA, Sargent DF, Luger K, Maeder AW, Richmond TJ (2002) Solvent mediated interactions in the structure of the nucleosome core particle at 1.9Å resolution. J Mol Biol 319: 1097–1113 [DOI] [PubMed] [Google Scholar]
- Diesinger PM, Heermann DW (2009) Depletion effects massively change chromatin properties and influence genome folding. Biophys J 97: 2146–2153 [DOI] [PMC free article] [PubMed] [Google Scholar]
- Dubochet J, Sartori Blanc N (2001) The cell in absence of aggregation artifacts. Micron 32: 91–99 [DOI] [PubMed] [Google Scholar]
- Eltsov M, Maclellan KM, Maeshima K, Frangakis AS, Dubochet J (2008) Analysis of cryo-electron microscopy images does not support the existence of 30-nm chromatin fibers in mitotic chromosomes in situ. Proc Natl Acad Sci USA 105: 19732–19737 [DOI] [PMC free article] [PubMed] [Google Scholar]
- Finch JT, Klug A (1976) Solenoidal model for superstructure in chromatin. Proc Natl Acad Sci USA 73: 1897–1901 [DOI] [PMC free article] [PubMed] [Google Scholar]
- Fujisawa T, Inoue K, Oka T, Iwamoto H, Uruga T, Kumasaka T, Inoko Y, Yagi N, Yamamoto M, Ueki T (2000) Small-angle X-ray scattering station at the SPring-8 RIKEN beamline. J Appl Cryst 33: 797–800 [Google Scholar]
- Fussner E, Ching RW, Bazett-Jones DP (2011) Living without 30 nm chromatin fibers. Trends Biochem Sci 36: 1–6 [DOI] [PubMed] [Google Scholar]
- Gilbert N, Boyle S, Fiegler H, Woodfine K, Carter NP, Bickmore WA (2004) Chromatin architecture of the human genome: gene-rich domains are enriched in open chromatin fibers. Cell 118: 555–566 [DOI] [PubMed] [Google Scholar]
- Grigoryev SA, Woodcock CL (1993) Stage-specific expression and localization of MENT, a nuclear protein associated with chromatin condensation in terminally differentiating avian erythroid cells. Exp Cell Res 206: 335–343 [DOI] [PubMed] [Google Scholar]
- Hirano T (2006) At the heart of the chromosome: SMC proteins in action. Nat Rev Mol Cell Biol 7: 311–322 [DOI] [PubMed] [Google Scholar]
- Hirota T, Gerlich D, Koch B, Ellenberg J, Peters JM (2004) Distinct functions of condensin I and II in mitotic chromosome assembly. J Cell Sci 117: 6435–6445 [DOI] [PubMed] [Google Scholar]
- Kireeva N, Lakonishok M, Kireev I, Hirano T, Belmont AS (2004) Visualization of early chromosome condensation: a hierarchical folding, axial glue model of chromosome structure. J Cell Biol 166: 775–785 [DOI] [PMC free article] [PubMed] [Google Scholar]
- Kizilyaprak C, Spehner D, Devys D, Schultz P (2011) In vivo chromatin organization of mouse rod photoreceptors correlates with histone modifications. PLoS One 5: e11039. [DOI] [PMC free article] [PubMed] [Google Scholar]
- Kleckner N, Zickler D, Jones GH, Dekker J, Padmore R, Henle J, Hutchinson J (2004) A mechanical basis for chromosome function. Proc Natl Acad Sci USA 101: 12592–12597 [DOI] [PMC free article] [PubMed] [Google Scholar]
- Kornberg RD, Lorch Y (1999) Twenty-five years of the nucleosome, fundamental particle of the eukaryote chromosome. Cell 98: 285–294 [DOI] [PubMed] [Google Scholar]
- Kowalski A, Palyga J (2011) Chromatin compaction in terminally differentiated avian blood cells: the role of linker histone H5 and non-histone protein MENT. Chromosome Res 19: 579–590 [DOI] [PMC free article] [PubMed] [Google Scholar]
- Kraulis PJ (1991) MOLSCRIPT: a program to produce both detailed and schematic plots of protein structures. J Appl Cryst 24: 946–950 [Google Scholar]
- Laemmli UK, Cheng SM, Adolph KW, Paulson JR, Brown JA, Baumbach WR (1978) Metaphase chromosome structure: the role of nonhistone proteins. Cold Spring Harb Symp Quant Biol 42: 351–360 [DOI] [PubMed] [Google Scholar]
- Langmore JP, Paulson JR (1983) Low angle x-ray diffraction studies of chromatin structure in vivo and in isolated nuclei and metaphase chromosomes. J Cell Biol 96: 1120–1131 [DOI] [PMC free article] [PubMed] [Google Scholar]
- Langmore JP, Schutt C (1980) The higher order structure of chicken erythrocyte chromosomes in vivo. Nature 288: 620–622 [DOI] [PubMed] [Google Scholar]
- Lewis CD, Laemmli UK (1982) Higher order metaphase chromosome structure: evidence for metalloprotein interactions. Cell 29: 171–181 [DOI] [PubMed] [Google Scholar]
- Lieberman-Aiden E, van Berkum NL, Williams L, Imakaev M, Ragoczy T, Telling A, Amit I, Lajoie BR, Sabo PJ, Dorschner MO, Sandstrom R, Bernstein B, Bender MA, Groudine M, Gnirke A, Stamatoyannopoulos J, Mirny LA, Lander ES, Dekker J (2009) Comprehensive mapping of long-range interactions reveals folding principles of the human genome. Science 326: 289–293 [DOI] [PMC free article] [PubMed] [Google Scholar]
- Maeshima K, Eltsov M (2008) Packaging the genome: the structure of mitotic chromosomes. J Biochem (Tokyo) 143: 145–153 [DOI] [PMC free article] [PubMed] [Google Scholar]
- Maeshima K, Laemmli UK (2003) A two-step scaffolding model for mitotic chromosome assembly. Dev Cell 4: 467–480 [DOI] [PubMed] [Google Scholar]
- Maeshima K, Eltsov M, Laemmli UK (2005) Chromosome structure: improved immunolabeling for electron microscopy. Chromosoma 114: 365–375 [DOI] [PubMed] [Google Scholar]
- Maeshima K, Hihara S, Eltsov M (2010a) Chromatin structure: does the 30-nm fibre exist in vivo? Curr Opin Cell Biol 22: 291–297 [DOI] [PubMed] [Google Scholar]
- Maeshima K, Hihara S, Takata H (2010b) New insight into the mitotic chromosome structure: irregular folding of nucleosome fibers without 30-nm chromatin fiber. Cold Spring Harb Symp Quant Biol 75: 439–444 [DOI] [PubMed] [Google Scholar]
- Maeshima K, Iino H, Hihara S, Funakoshi T, Watanabe A, Nishimura M, Nakatomi R, Yahata K, Imamoto F, Hashikawa T, Yokota H, Imamoto N (2010c) Nuclear pore formation but not nuclear growth is governed by cyclin-dependent kinases (Cdks) during interphase. Nat Struct Mol Biol 17: 1065–1071 [DOI] [PubMed] [Google Scholar]
- Maeshima K, Yahata K, Sasaki Y, Nakatomi R, Tachibana T, Hashikawa T, Imamoto F, Imamoto N (2006) Cell-cycle-dependent dynamics of nuclear pores: pore-free islands and lamins. J Cell Sci 119: 4442–4451 [DOI] [PubMed] [Google Scholar]
- Marko JF, Siggia ED (1997) Polymer models of meiotic and mitotic chromosomes. Mol Biol Cell 8: 2217–2231 [DOI] [PMC free article] [PubMed] [Google Scholar]
- McDowall AW, Smith JM, Dubochet J (1986) Cryo-electron microscopy of vitrified chromosomes in situ. EMBO J 5: 1395–1402 [DOI] [PMC free article] [PubMed] [Google Scholar]
- Nishino Y, Takahashi Y, Imamoto N, Ishikawa T, Maeshima K (2009a) Three-dimensional visualization of a human chromosome using coherent X-ray diffraction. Phys Rev Lett 102: 18101. [DOI] [PubMed] [Google Scholar]
- Nishino Y, Takahashi Y, Kubo H, Furukawa H, Yamauchi K, Maeshima K, Imamoto N, Hirohata R, Matsubara E, Ishikawa T (2009b) Nanostructure analysis by coherent hard X-ray diffraction. J Phys 186: 012056 [Google Scholar]
- Ohta S, Wood L, Bukowski-Wills JC, Rappsilber J, Earnshaw WC (2010) Building mitotic chromosomes. Curr Opin Cell Biol 23: 114–121 [DOI] [PMC free article] [PubMed] [Google Scholar]
- Ono T, Fang Y, Spector DL, Hirano T (2004) Spatial and temporal regulation of condensins I and II in mitotic chromosome assembly in human cells. Mol Biol Cell 15: 3296–3308 [DOI] [PMC free article] [PubMed] [Google Scholar]
- Paulson JR, Langmore JP (1983) Low angle x-ray diffraction studies of HeLa metaphase chromosomes: effects of histone phosphorylation and chromosome isolation procedure. J Cell Biol 96: 1132–1137 [DOI] [PMC free article] [PubMed] [Google Scholar]
- Robinson PJ, Rhodes D (2006) Structure of the ‘30 nm’ chromatin fibre: a key role for the linker histone. Curr Opin Struct Biol 16: 336–343 [DOI] [PubMed] [Google Scholar]
- Robinson PJ, Fairall L, Huynh VA, Rhodes D (2006) EM measurements define the dimensions of the ‘30-nm’ chromatin fiber: evidence for a compact, interdigitated structure. Proc Natl Acad Sci USA 103: 6506–6511 [DOI] [PMC free article] [PubMed] [Google Scholar]
- Schalch T, Duda S, Sargent DF, Richmond TJ (2005) X-ray structure of a tetranucleosome and its implications for the chromatin fibre. Nature 436: 138–141 [DOI] [PubMed] [Google Scholar]
- Scheffer MP, Eltsov M, Frangakis AS (2011) Evidence for short-range helical order in the 30-nm chromatin fibers of erythrocyte nuclei. Proc Natl Acad Sci USA 108: 16992–16997 [DOI] [PMC free article] [PubMed] [Google Scholar]
- Schmidt PW (1989) Use of scattering to determine the fractal dimension. In The Fractal Approach to Heterogeneous Chemistry, Avnir D (ed), pp 67–79. Chichester: John Wiley & Sons [Google Scholar]
- Strukov YG, Wang Y, Belmont AS (2003) Engineered chromosome regions with altered sequence composition demonstrate hierarchical large-scale folding within metaphase chromosomes. J Cell Biol 162: 23–35 [DOI] [PMC free article] [PubMed] [Google Scholar]
- Swedlow JR, Hirano T (2003) The making of the mitotic chromosome: modern insights into classical questions. Mol Cell 11: 557–569 [DOI] [PubMed] [Google Scholar]
- Takahashi M (1989) A fractal model of chromosomes and chromosomal DNA replication. J Theor Biol 141: 117–136 [DOI] [PubMed] [Google Scholar]
- Thomas JO (1984) The higher order structure of chromatin and histone H1. J Cell Sci Suppl 1: 1–20 [DOI] [PubMed] [Google Scholar]
- Tremethick DJ (2007) Higher-order structures of chromatin: the elusive 30 nm fiber. Cell 128: 651–654 [DOI] [PubMed] [Google Scholar]
- Uchiumi T, Traut RR, Kominami R (1990) Monoclonal antibodies against acidic phosphoproteins P0, P1, and P2 of eukaryotic ribosomes as functional probes. J Biol Chem 265: 89–95 [PubMed] [Google Scholar]
- Widom J, Klug A (1985) Structure of the 300A chromatin filament: X-ray diffraction from oriented samples. Cell 43: 207–213 [DOI] [PubMed] [Google Scholar]
- Woodcock CL (1994) Chromatin fibers observed in situ in frozen hydrated sections. Native fiber diameter is not correlated with nucleosome repeat length. J Cell Biol 125: 11–19 [DOI] [PMC free article] [PubMed] [Google Scholar]
- Woodcock CL, Frado LL, Rattner JB (1984) The higher-order structure of chromatin: evidence for a helical ribbon arrangement. J Cell Biol 99: 42–52 [DOI] [PMC free article] [PubMed] [Google Scholar]
Associated Data
This section collects any data citations, data availability statements, or supplementary materials included in this article.