Abstract
A thorough understanding of optical properties of biological tissues is critical to effective treatment planning for therapies such as photodynamic therapy (PDT). In the last two decades, new technologies, such as broadband diffuse spectroscopy, have been developed to obtain in vivo data in humans that was not possible before. We found that the in vivo optical properties generally vary in the ranges μa =0.03–1.6 cm−1 and μs’=1.2–40 cm−1, although the actual range is tissue-type dependent. We have also examined the overall trend of the absorption spectra (for μa and μs’) as a function of wavelength within a 95% confidence interval for various tissues in vivo. The impact of optical properties on light fluence rate is also discussed for various light application geometries including superficial, interstitial, and within a cavity.
Keywords: In-vivo optical properties, light propagation, PDT, Laser-Tissue interaction
I. Introduction
Laser light has been increasingly used in many biomedical applications, such as photodynamic therapy (PDT) and laser interstitial thermal therapy (LITT). For these medical applications, it is essential to understand the light propagation. A database of in-vivo optical properties (absorption coefficient and reduced scattering coefficient) of human tissue, is crucial to allow accurate calculations of fluence rate in and around treatment areas. In vivo optical properties of human tissue can differ significantly from that of the ex vivo human tissue samples [1–10]. It can also be different from in-vivo animal data. Zhu et al found that the effective attenuation of canine prostate is two times greater than that of human prostate[11]. Great advances were made in the last two decades to determine the in vivo optical properties in humans in a variety of organs. This paper reviews the existing data in the literature since the previous reviews [3, 10] to greatly expand the human in vivo portion of the summary, along with the experimental methods and theories used to determine the optical properties. The data summarized here covers a range of wavelengths and measurement methods.
II. Light transport Equations
The general radiative transport equation describing light transport through a turbid medium can be [12]:
| (1) |
Here L is the irradiance defined as the radiant power per unit solid angle about the vector Ω, Ω represents the direction the incident light is traveling in within the tissue, S(r,Ω,) describes the light source (measured in joules), and p(Ω,Ω’) is the phase function, which, when integrated over 4π, is equal to one; ν is the speed of light in the medium. The absorption coefficient, μa, is defined as the probability of absorption per unit distance. Similarly, μs is the probability of scattering per unit distance. Generally, the exact form of the phase function is complex [13–16] and is often taken as the Henyey–Greenstein (HG) phase function and a single parameter g, which is the average cosine of the phase function [17]. g can vary from 1 to −1 but the tissue scattering is often anisotropic (with g ~ 0.7 – 0.9). Equation 1 can be used to determine the radiance for known spatial distribution of the absorption and scattering coefficients. Several approximations can be made to simplify Eq. 1 depending on the type of irradiance and the optical boundary conditions[18]. For a more detailed review of phase function, the readers are referred to [13–16].
The diffusion approximation is often made to solve Eq. 1 by expanding L(r,Ω’,t) in terms of spherical harmonics Yn,m with only the first two terms being considered. The first term in the expansion can be related to the fluence rate of the incident light, defined as the radiant power incident on an infinitesimal sphere divided by the cross-sectional area of that sphere [18, 19]:
| (2) |
the diffusion equation can be expressed as[18]:
| (3) |
where D=(1/3)(μa+μs’) is the diffusion constant and μs’= μs(1−g) is the reduced scattering coefficient. The diffusion approximation gives a sufficiently accurate description of light transport in tissue in the near infrared (NIR) region. As a result, we will use it as a gold standard for light transport modeling in this review. The necessary optical properties then become μa and μs’.
In some instances, diffusion theory fails at short source-detector distances (on the order of ~1mm)[20]. Consequently, more accurate approximation methods can be applied to the radiative transport equation. These methods range from higher-order analytic solutions using the spherical harmonics [20–22] to Monte Carlo (MC) simulations [19, 23–26]. Working from Eq. 1, a PN approximation is applied by first expanding the angular quantities of Eq. 1 in terms of spherical harmonics and then writing the phase function as a series of Legendre polynomials[20]. MC simulations is a statistical method, which uses the probabilities of scattering and absorption within the medium and at the medium boundary for photon transports in incremental steps [27]. The photon transport is modeled by probability distributions as photons complete their random walk in a medium. Simulation geometries can include the simple homogeneous plane or more complex geometries such as multilayered systems and spherical cavities[28]. MC is a rigorous method but it can be expensive in computation time.
III. Experimental Methods to determine in-vivo Optical Property
Several different methods (either superficial or interstitial) can be used to determine the optical properties in vivo, which can be invasive or non-invasive. Generally a non-invasive technique is preferred as the in-vivo optical properties of tissue are highly sensitive to changes in environment. Most modern methods of non-invasive optical property measurements use absorption spectroscopy; depending on the time variance of the light source, it can be categorized as continuous wave (CW), time-of-flight (TOF), or frequency resolved spectroscopy. Most theoretical analyses use the diffusion approximation so only μa and μs’ are obtained.
1. Continuous Wave Absorption Spectroscopy
Reflectance Spectroscopy
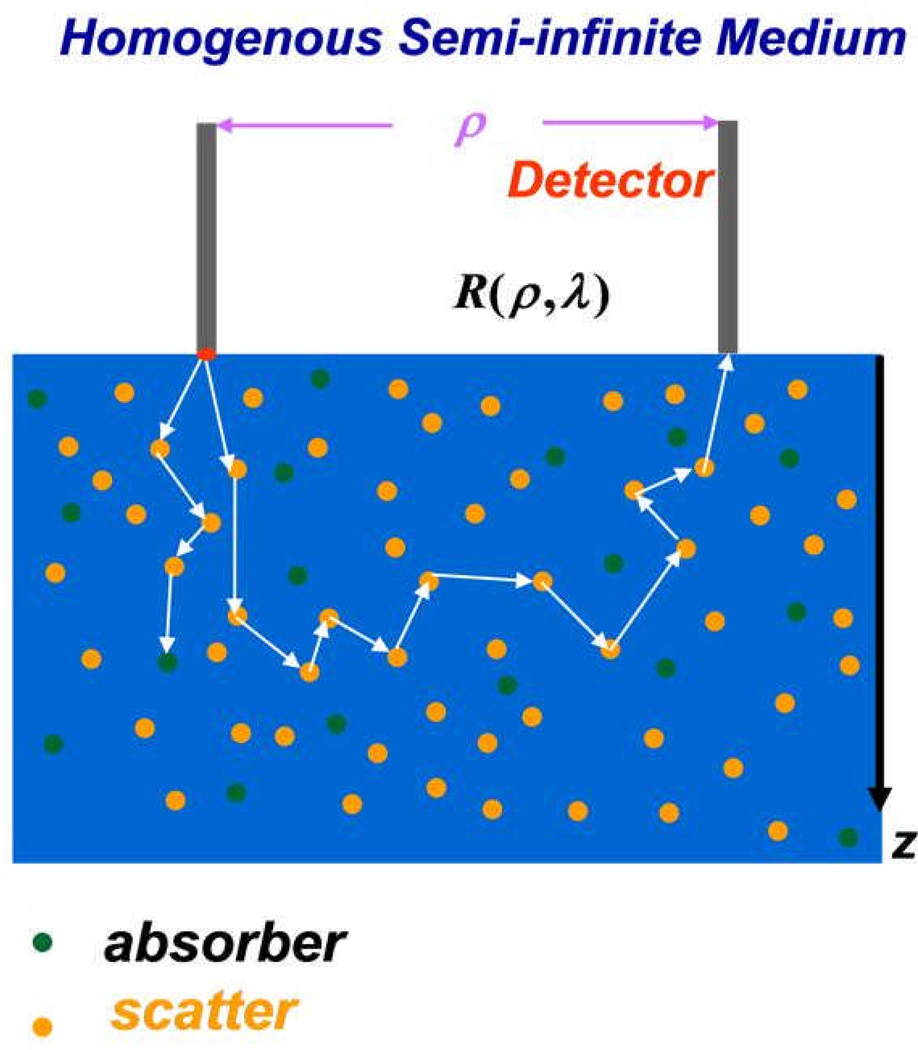
Continuous wave (CW), spatially-resolved diffuse reflectance absorption spectroscopy can obtained from a contact probe to collect reflected light from a tissue surface (Fig. 1). The measured reflectance can be used to determine μa and μs’ by fitting the data with the calculations [29–36].The reflectance, in the diffusion approximation, can be expressed as [37]:
| (4) |
where Rfres(θ) is the Fresnel reflection coefficient as a function of incident angle θ, C1 and C2 are constants which depend on the index of refraction, the boundary conditions, and the numerical aperture of the optical fiber [18, 20, 37].
Figure 1.
Schematics of broad-band diffuse reflectance spectroscopy (BDRS). Pencil beam light source was incident from the left fiber. The photons are randomly scattered (depicted by orange dots) and absorbed (depicted by green dots) as they travel through tissue. The absorbed photons are trapped in the tissue while the scattered photons continue to either be absorbed or scattered and ultimately detected by the detector fiber located at a distance ρ from the incident light source.
Haskell et al [18] provided a comprehensive review of the boundary conditions. The most common (partial current) boundary condition, can be expressed as[18]:
| (5) |
Where Φ is the fluence rate, D is the diffusion constant (see Eq. 3), A is a constant that depends on the Fresnel reflectance at the surface of the boundary and can be determined from the indices of refractions and the numerical aperture of the incident light[18, 20]. Φ(ρ, z = 0) in Eq. 4 is the fluence rate at the surface [38]:
| (6) |
Rf is the reflected flux exiting the surface from the tissue [18]:
| (7) |
where μt=μa+μs’, zb = 2AD, z is the depth of the measurement, and r1 and r2 are the radial distances from the detector to the two point sources (z = 0 and z = −2zb). Using reflectance measurements, μa and μs’ can be found within 5–15%[38].
Transmittance (or Interstitial) Spectroscopy
Transmittance spectroscopy is often applied interstitially to invasively determine the tissue optical properties in vivo. Compared to reflectance spectroscopy, it is easier to solve the diffusion equation because of the absence of the complicated boundary conditions. Transmittance is measured by placing a light source fiber through a biopsy needle and inserting the needle into the tissue to be studied. A detector fiber is then placed some distance away within the tissue to measure the light that is transmitted through. The fluence rate for a point source can be expressed as [2, 39]:
| (8) |
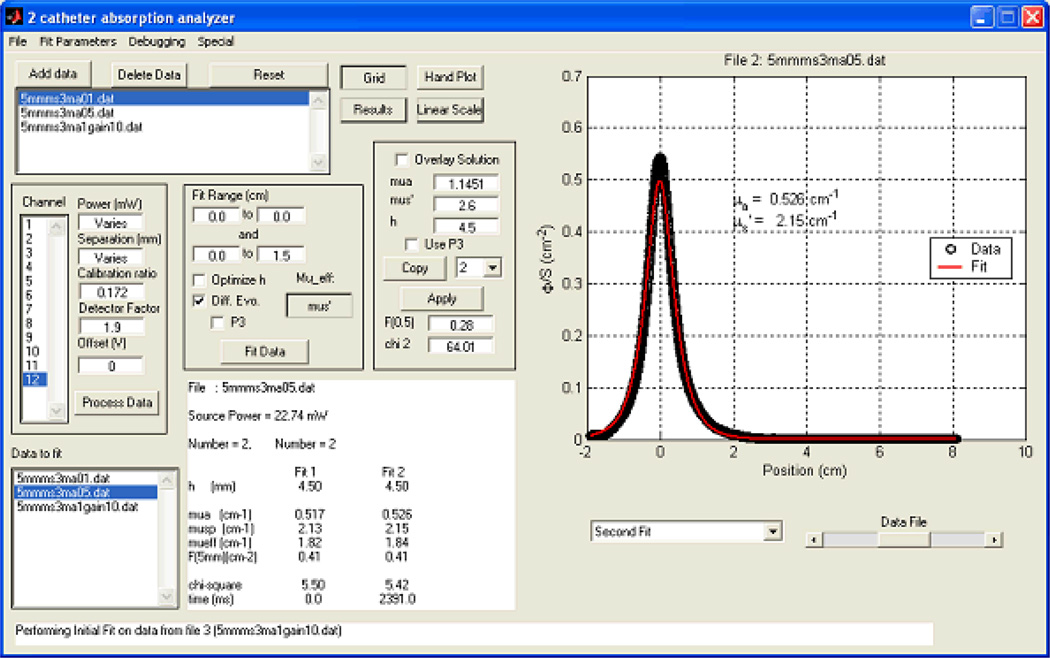
where r is the radial distance away from the source; ϕ is the absolute light fluence rate, and S is the source strength. The detector can be placed at varying distances from the light source within the tissue [33]. Data can be fit to Eq. 8 to extrapolate μa and μs’ [33] (Fig. 2). Equation 8 can be modified to account for the effect of tissue heterogeneity and source weight distribution from a linear source[40].
Figure 2.
Extrapolation of optical properties from measured transmission data from a point source. The measured data (symbols) are fitted with a best-fit using the optical properties according to Eq. 8 (line); these data are displayed in the lower left-hand panel. Taken from [33].
2. Time of Flight Absorption Spectroscopy
Another form of measurement is “time-of-flight” absorption spectroscopy, which measures photons directly following an input impulse of light. Photons incident on a scattering medium will arrive at the detector at different times. This distribution of the “time-of-flight” can be measured with picoseconds pulsed lasers. The speed of these photons in tissue is given by ν=c/n where c is the speed of light in vacuum and n is the index of refraction of the tissue sample [27]. Note that for soft tissues, this value of n is in the red and near-infrared part of the spectrum, which corresponds to TOF distributions ranging from 100 ps to 1 ns, depending on the optical path length 〈l〉, [41, 42]. By assuming an infinite homogeneous medium with a point source, one can express the local fluence rate as: ϕ(r,t)=v(4πDvt)−3/2exp(−r2/4Dvt−μaνt)[43]. Under these assumptions, μa and μs’ become functions of the time of maximal signal and the decay constant at long times of the light distribution curve [44]. From this we find that the absorption coefficient can be taken directly from the final slope of this curve. TOF measurements offer the advantage of requiring only relative measurements to extrapolate optical properties from the temporal variation of the fluence rate [41]. One single MC simulation can be used to extrapolate optical properties using TOF spectroscopy [23]. A further advantage of TOF spectroscopy is the ability to assess structural properties of the medium[41]. However, the high cost of high-time resolution equipment is a disadvantage of this particular technique.
3. Frequency Resolved Spectroscopy
Frequency domain spectroscopy uses a sinusoidal modulated light source (with a typical frequency range of ~100 MHz to ~1 GHz) to detect a phase shift and amplification from the incident light [18, 45–49]. After light from a sinusoidal light source travels through a scattering medium, the detected light will still be sinusoidal, but it will be delayed in time due to scattering along with a reduced amplitude. The resulting observed phase shift, θ, can be expressed in terms of the frequency f, the speed of light ν, and the mean path length l of the photons, θ≈2πfl/v=ωl/v, in the limit of high frequencies [50]. Equation 3 can be solved for ϕ using a sinusoidal source, S(r,t)=Mscos(ωt) where ω is the angular frequency and Ms is the source modulation amplitude. By solving Eq. 3 for this source, light fluence rate can be expressed as a function of the phase θ and modulation amplitude M for a point source as ϕ(r,ω)=Mcos(ωt+θ)/(4πDr), where θ(r,ω)=−rμeff(1+(ω/μaν)2)1/4sin(1/2tan−1(ω/μaν)), M=Msexp(−rμeff[μeff(1+(ω/μaν)2)1/4cos( (1/2)atan(ω/μaν))−1]). [51] This method allows us to detect weak signal during CW photodynamic therapy due to the frequency modulation. It requires less source-detector separations to recover optical properties due to the additional information from the phase shift. The key advantage offered by frequency resolved spectroscopy is that it is less expensive than TOF techniques that can be practically applied over a range of wavelengths and frequencies [51, 52].
IV. Summary of in-vivo Optical Properties in humans
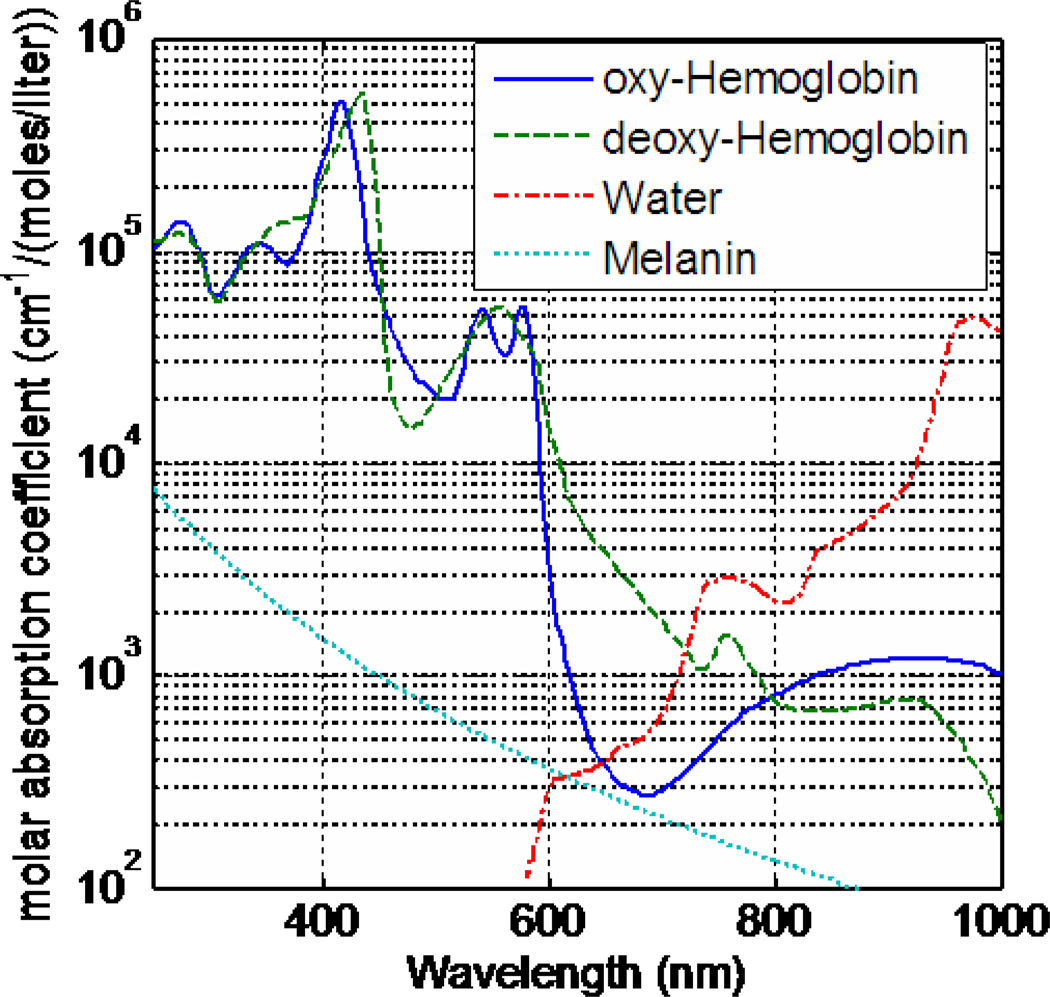
The absorption coefficient varies greatly over the visible spectrum, while the scattering coefficient of tissue decreases monotonically as the wavelength increases [12]. The presence of chromophores affects the absorption coefficient. Chromophores are tissue components which absorb light and, in the visible part of the spectrum, are mainly in the form of hemoglobin and melanin. Hemoglobin is responsible for carrying oxygen from the lungs to the rest of the body. The absorption spectrum for deoxy-hemoglobin and oxy-hemoglobin are distinctly different, thus resulting in difference in total absorption as a function of oxygen saturation [53–58]. The absorption spectrum of oxy-hemoglobin peaks between 400 nm and 600 nm and deoxyhemoglobin peaks between 400 nm and 850 nm (Fig. 3) [53–61]. Comparing this to the absorption spectrum of water (which peaks between 900 nm and 1100 nm, Fig. 3), [56–58, 61] the dominant absorbent in tissue for PDT is hemoglobin, which is performed in the near infrared region (NIR). Another common source of light absorption is melanin, a biological pigment, which absorbs light in the wavelength range 330 nm to about 700 nm (Fig. 3) [62–66], with a particularly high absorption rate in the ultraviolet part of the spectrum. The absorption coefficient, subsequently, is unique for condition and can be used to extrapolate the concentrations of each absorbent (oxy-hemoglobin, dexoy-hemoglobin, melanin, water) from the diffuse absorption spectrum measurements.
Figure 3.
Molar absorption coefficients of common absorbents in tissue: oxy-hemoglobin, deoxy-hemoglobin, melanin, and water.
The scattering seen in tissue is due to the presence of biological cells and is dependent on the cell morphology [67, 68]. Scattering can be caused by the cell nuclei, mitochondria, lysosomes, and the Golgi apparatus[68]. At small incident angles the cells themselves are responsible for scattering, whereas at larger incident angles the nuclei of cells may be responsible for the scattering [67, 68]. The indices of refraction in cells must be considered for the scattering[68–70]. To model this scattering, Mie theory [71–75] is often used, treating the scattering particles as individual spheres distributed either monodispersely or polydispersely with an incident planar electromagnetic wave, [29, 30, 70–76] as a function of distance between the observers and particle, the scattering angle, the refractive index of the particle, and the diameter of the particle [67, 77].
Table 1 lists the measurements of optical properties of in vivo (μa and μs’) human tissue at room temperature (22 °C) for treatment wavelengths commonly used for PDT; the method used to obtain the optical properties is also listed, as explained in Section III.
Table 1.
In vivo optical properties at commonly used treatment wavelengths for PDT
| Tissue | λ (nm) | μa (cm−1) | μs’ (cm−1) | Experimental Method | References |
|---|---|---|---|---|---|
| Bladder | 532 | 0.27–0.71 | 1.28–3.30 | 4 | [108] |
| 630 | 0.28–0.76 | 2.5–6.37 | 4 | [108] | |
| Bone | 650 | 0.09–0.14 | 12.5–15.8 | 1 | [109] |
| 760 | 0.07–0.09 | 11.9–14.1 | 1 | [109] | |
| Brain | 420 | 0.01–3.51 | 18.75–55.83 | 4 | [108] |
| 532 | 0.02–3.84 | 0.10–46.3 | 4 | [108] | |
| 630 | 0.02–0.50 | 3.72–21.97 | 4 | [108, 110, 111] | |
| 760 | 0.11–0.17 | 4.0–10.5 | 1, 2 | [6, 112] | |
| 780 | 0.078–0.089 | 8.42–9.16 | 2 | [8] | |
| Breast | 660 | 0.037–0.110 | 11.4–13.5 | 1,4 | [113–118] |
| 760 | 0.031–0.10 | 8.3–12.0 | 1,4 | [115, 116, 118–121] | |
| 900 | 0.096–0.29 | 3.33–5.86 | 1,4 | [9, 115, 118, 122] | |
| Tumor | 530 | 0.60–0.86 | 28.0–32.1 | 4 | [123] |
| 690 | 0.070–0.10 | 14.7–17.3 | 2 | [124] | |
| 895 | 0.068–0.102 | 12.4–13.1 | 2 | [124] | |
| Bowel | |||||
| Small | 630 | 0.19–0.21 | 8.95–10.05 | 4 | [35, 76] |
| Large | 630 | 0.12–0.18 | 10.11–10.42 | 4 | [35, 76] |
| Diaphragm | 661 | 0.15–1.08 | 9.65–21.7 | 4 | [125] |
| Heart | 630 | 0.03–1.55 | 17.56–75.06 | 4 | [126] |
| 661 | 0.12–0.18 | 5.22–90.80 | 4 | [125] | |
| Liver | 630 | 1.15–1.56 | 21.6–30.4 | 4 | [35, 76] |
| Lung | 630 | 0.16–1.36 | 1.07–83.81 | 4 | [126] |
| 661 | 0.49–0.88 | 21.14–22.52 | 4 | [125] | |
| Pericardium | 630 | 0.13–0.33 | 13.0–21.9 | 4 | [35, 76] |
| Prostate | 630 | 0.05–1.0 | 3.41–17.02 | 4 | [127, 128] |
| 650 | 0.14–0.61 | 5.24–22.68 | 4 | [128–130] | |
| 672 | 0.09–0.72 | 7.1–25.0 | 1,3 | [44, 128, 129, 131] | |
| 732 | 0.09–0.72 | 3.37–29.8 | 3 | [39, 129, 131] | |
| 762 | 0.11–1.6 | 1.2–40.0 | 2,3 | [11, 129, 131–133] | |
| Skin | 630 | 0.05–1.11 | 2.26–20.95 | 1,4 | [34, 35, 126, 134, 135] |
| 661 | 0.51–0.64 | 2.24–5.77 | 4 | [116, 125, 136] | |
| 800 | 0.16–0.23 | 6.80–9.84 | 1 | [116, 137, 138] | |
Time of flight absorption spectroscopy
Frequency Resolved Spectroscopy
CW Absorption Transmittance Spectrsocopy
CW Absorption Reflectance Spectroscopy
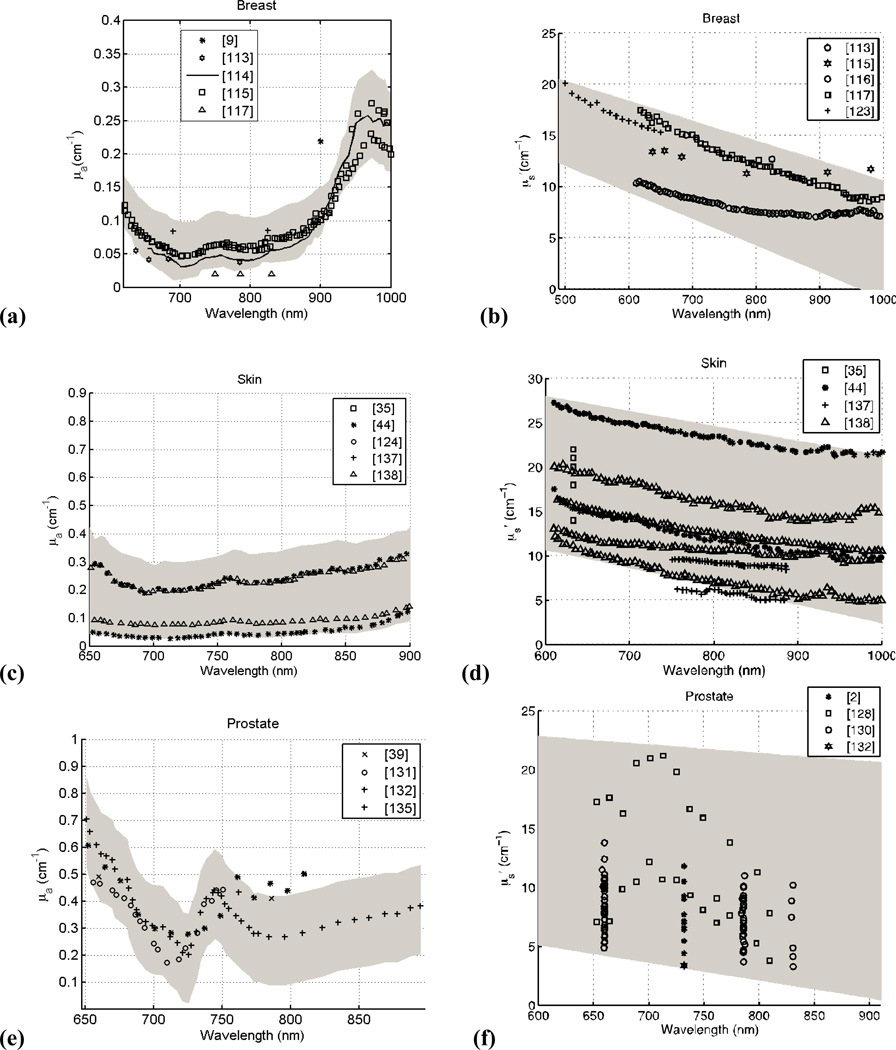
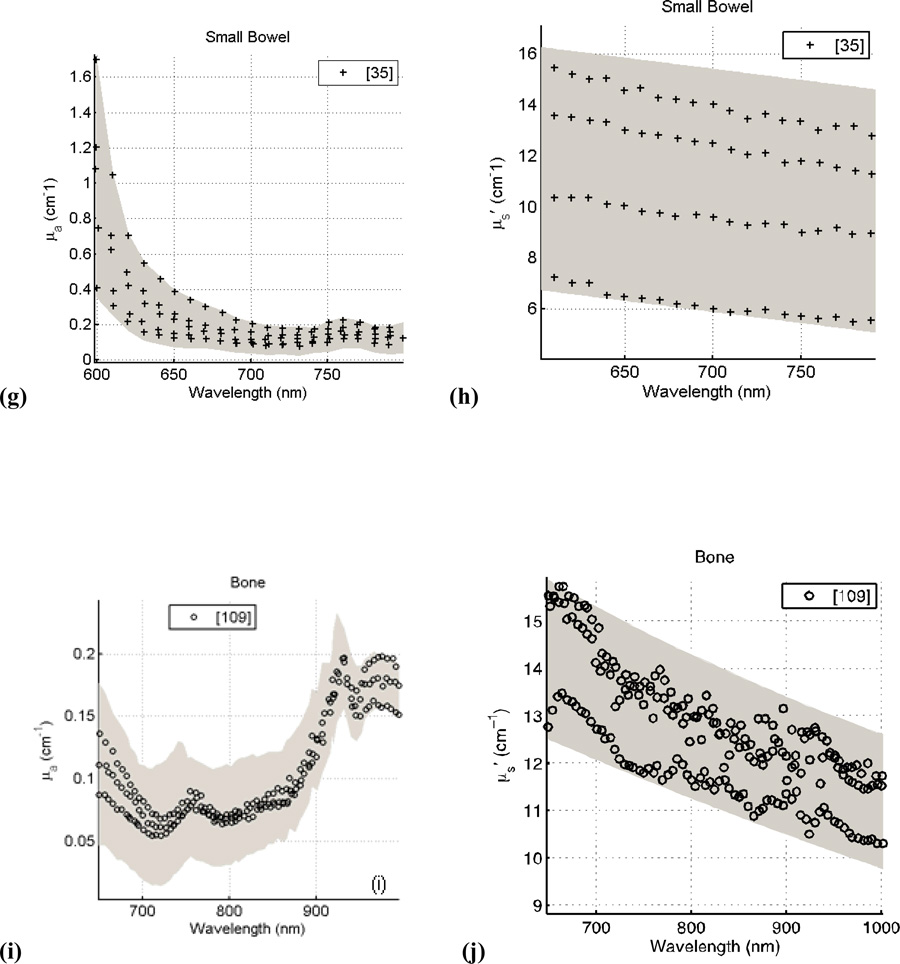
Figure 4 presents the spectra of human tissues in vivo for μa and μs’ as a function of wavelength. The data was taken from the literature reviewed here and for respective tissue and optical properties, and were fitted with a series of best-fit lines (R2>0.90) using the software package Stata. The data was then compared to the resulting fit and a 95% confidence interval was obtained from this comparison (denoted by the gray band seen in Fig. 4a–i). A p-value was calculated for all data at a particular wavelength (for breast tissue: μa (p<0.001) and μs’ (p<0.001); for skin: μa (p<0.05) and μs’ (p<0.001); for prostate tissue: μa (p=0.001) and μs’ (p<0.001; for small bowel tissues: μa (p<0.01) and μs’ (p<0.01); and for bone tissue: μa (p<0.01) and μs’ (p<0.001)). For wavelengths λ > 690 nm where the absorption of hemoglobin is no longer dominant, tissue optical properties will be affected strongly by the absorption of photosensitizer. As a result, the spatial distribution and dynamic photobleaching of the photosensitizer will affect the in vivo optical properties. For example, the peak observed at ~740 nm in prostate tissue is caused by the presence of a photosensitizing drug, motexafin lutetium. The result of this analysis is the overall trend in μa and μs’ as a function of wavelength for particular human tissues in vivo observed in the literature.
Figure 4.
Absorption and Scattering coefficients of human tissue in vivo versus wavelength for breast (a, b); skin (c, d); prostate (e, f); small bowel (g, h); and bone (i, j). The grey shaded region is the range of μa and μs’ with a 95% confidence interval based on review of the literature.
The data presented here focuses on bulk tissues within the human body. For superficial measurements for tissues such as skin, a multi-layered geometry of tissue optical properties must be considered to extrapolate tissue optical properties correctly. Layered tissues that have different regions of optical properties experience photon propagation differently than bulk tissues. A two-layer model is often considered [19, 78, 79], where, if the thickness of the first layer is known, the absorption coefficients of both layers in the system can be determined. The two-layer model, however, falls short in that is still assumes homogeneous, bulk tissues rather than an inhomogeneous layered structure. Multi-layer structures are considered [80, 81] for greater accuracy in modeling light propagation in skin.
V. The Effect of Tissue Optical Properties on Light Propagation
Photodynamic therapy is inherently a dynamic process. There are three principal components: photosensitizer, light, and oxygen, all of which interact and vary on timescales relevant to a single treatment[82]. The distribution of light is determined by the light source characteristics and the tissue optical properties. The tissue optical properties, in turn, are influenced by the concentration of photosensitizer and the concentration and oxygenation of the blood. The distribution of oxygen is altered by the photodynamic process, which consumes oxygen and may alter blood flow[83]. Finally, the distribution of photosensitizer may change as a result of photobleaching, the photodynamic destruction of the photosensitizer itself.
From a physics point of view, the explicit PDT dose is defined as the light energy deposited to photosensitizer, i.e. it is proportional to the product of the absorption coefficient of the photosensitizer and light fluence: . Where ε is the extinction coefficient and c is the photosensitizer concentration[84]. PDT dose calculated in this way is a good predictor of outcome if one is operating in a drug- or light-limited regime when there is ample oxygen supply[85]. Thus the direct link of tissue optical properties and PDT dose is the light fluence rate and the impact of in-vivo optical properties on ϕ will be discussed here.
1. Superficial Application
For tumors located in accessible regions such as on the surface of the skin,[86] superficial light application is clearly the most practical. In such situations, the treatment area is considered a semi-infinite slab of tissue in the presence of the air-tissue boundary. Several factors which affect light fluence are light source beam size, incident angle, and the optical properties [3, 86–91]. Light fluence rate in a circular field ranging in sizes from 0.25 cm to 8 cm (in radius) and normally incident on the tissue surface has been studied using MC simulation[86]. Because of the backscattering from the boundary the fluence rate beyond the boundary in air can be greater than that without the turbid medium[86]:
| (9) |
| (10) |
where a’=μs’/(μa+μs’), A=(1+rj)/(1−rϕ) (where rj and rϕ are functions of the indices of refractions, A = 2.9 for air-tissue interface) [18]. The fluence rate in tissue can be expressed as[86, 93]:
| (11) |
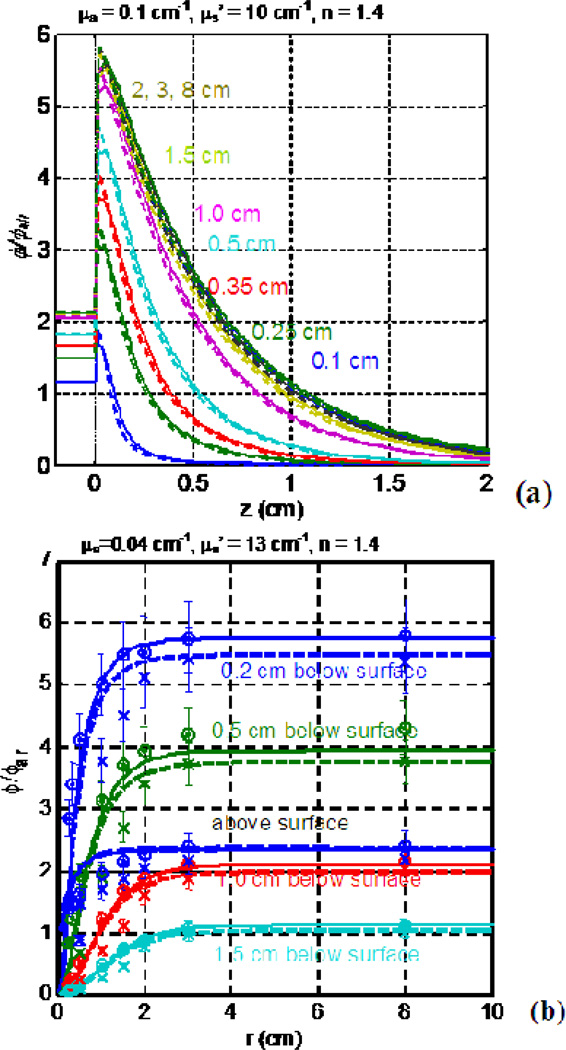
Where k is the backscatter coefficient which can be determined by comparison with MC simulation (numerically k = 3+5.1Rd − 2e−9.7Rd for air-tissue boundary)[94]. Good agreements are observed among the measurements, an empirical solution and the MC simulation [2, 87, 94, 95]. ϕ/ϕair (see Fig. 5a) will increase sharply at the water-tissue boundary and then exponentially decrease with increasing depth and will significantly decrease with decreasing beam radius. The light fluence rate, as a function of beam radius and depth in tissue will drop substantially for small light fields as compared to broad beam fields (see Fig. 5b). Significant differences in ϕ/ϕair occur between normal and oblique incident beams, when the beam radius is less than 2 cm[87].
Figure 5.
MC-calculated ϕ/ϕair as a function of tissue depth (a) and beam radius (b). The ϕ/ϕair was calculated for μa = 0.1 cm−1, μs’ = 10 cm−1, and index of refraction n=1.4 for varying beam radii. Note the exponential decrease with increasing depth. The ϕ/ϕair becomes a constant after the beam radius reaches 2 cm.
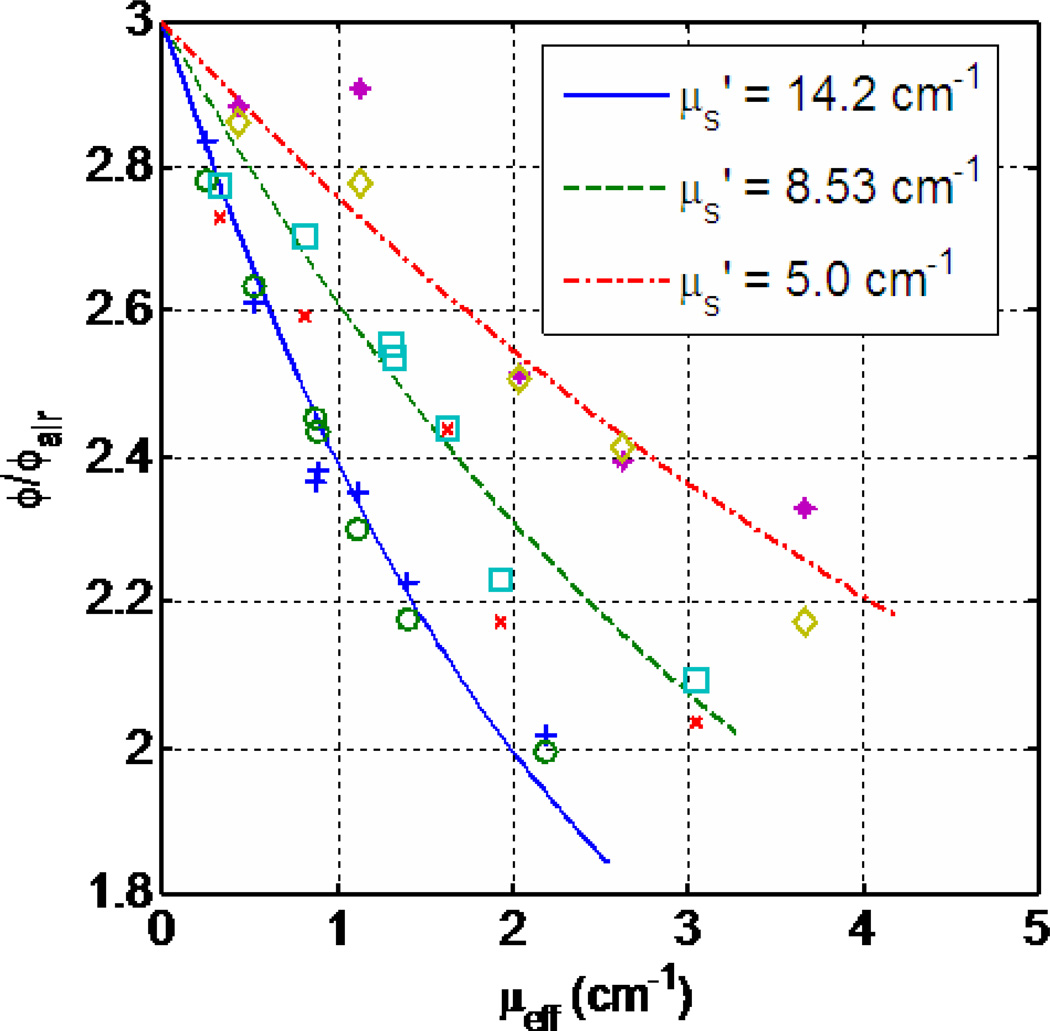
Figure 6 shows the relationship between the light fluence rate at tissue surface and the optical properties. For a known reduced scattering coefficient μs’, ϕ/ϕair depends on the effective attenuation coefficient μeff directly. This optical properties dependence is even more pronounced inside tissue where the effective attenuation coefficient μeff determines light penetration (Eq. 11), as shown in Figs. 7(a)–(c) as dashed line for light fluence rate per incident light fluence rate in air at 0.5 cm depth. (Notice the in-air light fluence rate ϕair is calculated as incident power per unit area.) The light fluence rate decreases with increasing effective attenuation coefficient μeff for a known reduced scattering coefficient, μs’. In clinic settings, the tissue optical properties are often heterogeneous, thus one needs to further account for the effect of tissue heterogeneity by solving the diffusion equation (Eq. 3) directly.
Figure 6.
Relationship between the diffuse reflectance Rd and optical properties. The symbols are measurements and the lines are theoretical calculations described in the text. Data are taken from Ref. [92].
Figure 7.
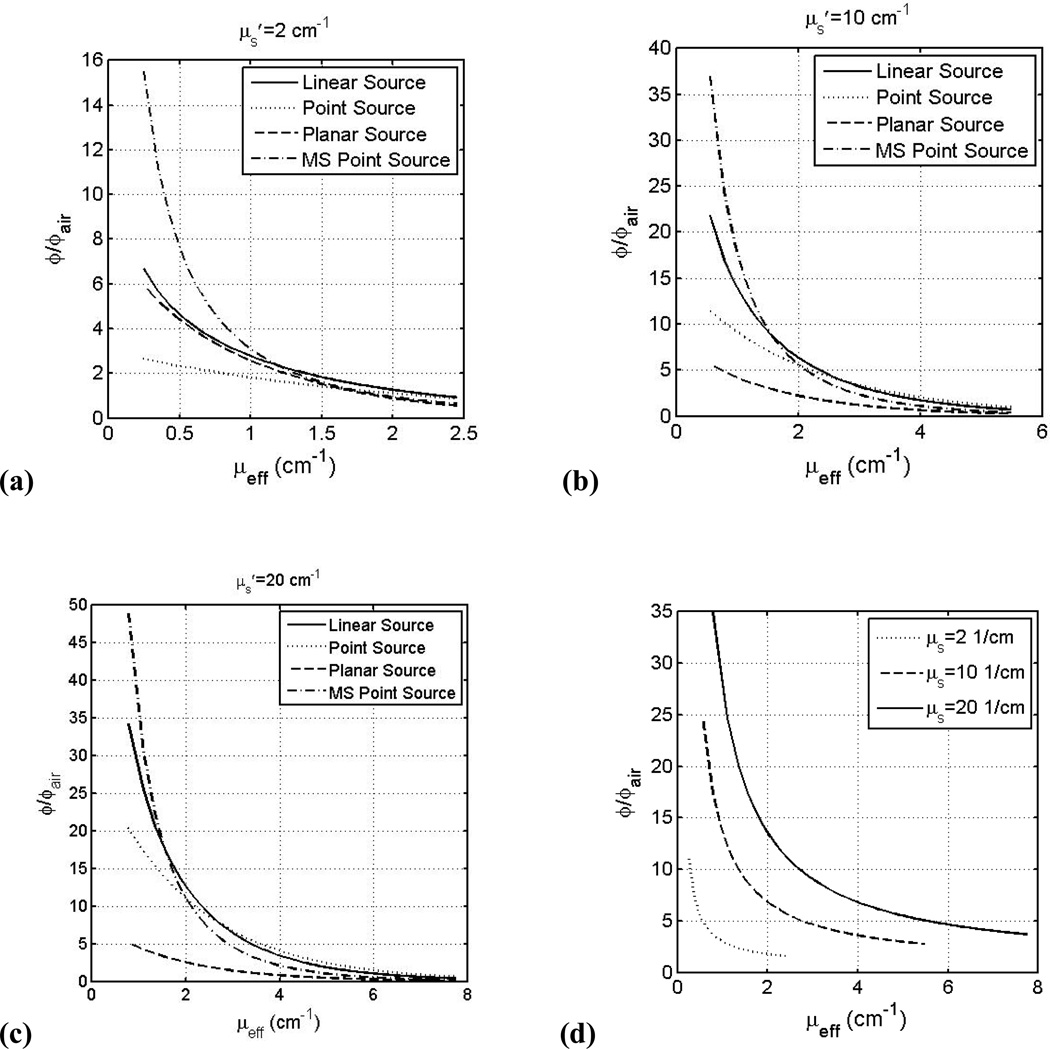
Fluence rate, normalized to in-air fluence rate ϕair, versus μeff for linear (solid line), point sources (dashed line) inside an infinite medium, planar light sources (dotted line) on a semi-infinite medium below an air-tissue interface, and point source with multiple scattering (MS) (dash-dotted line) inside a spherical cavity of 10 cm radius at 0.5 cm from the light source (for point or linear sources) or 0.5 cm depth in tissue (planar or MS point sources) for μs’: (a) 2.0 cm−1, (b) 10.0 cm−1, (c) 20 cm−1. See text for the definition of ϕair. (d) ϕ/ϕair within a spherical cavity at air-tissue boundary for μs’=2.0 cm−1 (dotted), 10.0 cm−1 (dashed), and 20.0 cm−1 (solid) using Eqs. 10 and 12.
2. Interstitial Application
Interstitial application, is better suited for bulk tissues because superficial applications have limited light penetration [96, 97]. Optical fibers are placed directly in the tissue, and consequently an interstitial measurement does not have the tissue-air boundary problems to contend with as superficial application does. The light distribution for any light source geometry can be calculated from that of a point source. Equation 8 relates the light fluence distribution and optical properties for a point source. As expected the fluence rate is greatest at points closest to the light source [96, 98] and thus is position dependent. Figure 7 (a)–(c) compares the light fluence rate (at 0.5 cm from source or 0.5 cm depth and normalize to the incident light fluence rate, ϕair) dependence on μeff (inverse of the optical penetration depth) for different light source geometries (point source, infinitely long linear source, planar sources incident on semi-infinite tissue medium, and MS point source inside a 10 cm sphere) and for μs’ between 2 and 20 cm−1. The incident light fluence rate (or in-air light fluence rate) is defined as power per spherical area S/4πr2 for point and MS point sources, power per cylindrical area or s/4πr for linear source (s is the power per length), and power per incident area S/A for planar source. It is clear that the light fluence rate decreases with increasing μeff. The light fluence rate in tissue can be significantly higher (up to 45 folds) than that calculated based on the energy released per area ϕair depending on in-vivo tissue optical properties.
Several interstitial studies [96, 97, 99–101] consider how knowledge of optical properties (μa and μs’) affects the fluence rate. Zhu et al [99] points out that the heterogeneity of μa and μs’ contribute to variations in fluence rates at similar depths from the point source. Li et al [40] compares different algorithms for interstitial application, while accounting for tissue optical heterogeneity [40]. A main factor, which affects the accuracy of the determined fluence rates in tissue, is the heterogeneous optical properties distribution. Studies [97, 100] conclude that optimization of treatment planning is ineffective without knowledge of the heterogeneity of μa and μs’.
3. Intracavitory Application
In intracavitory application, light is applied inside a cavity of a surrounding tissue boundary, e.g., in pleural and bladder cavities. Within the cavity, light is multiple-scattered by the cavity walls and causes the total fluence rate to be increased by as much as a factor of seven larger than the fluence rate of the non-scattered light from the isotropic source itself [102–104]. Thus, we must account for this increase in fluence rate, referred to as the integrating sphere effect (ISE). The light fluence rate inside the cavity can be expressed as:
| (12) |
Where Rd is the diffuse reflectance (Eq. 10), r0 is the radius of the cavity. f is the fraction of the area of the opening of the integrating sphere and the total surface area1, and β=4Rd/(1−Rd(1−f)) is the reflection factor, which describes how much the scattered light is increased and is dependent on tissue optical properties [104]. Determining this value of β is a key for fluence rate calculations for intracavitory geometries. The diffuse reflectance depends on both the indices of refraction mismatch and the optical properties of the tissue surface (see Eq. 10). An analytical solution for the fluence rate inside tissue in a spherical cavity is provided as [104]:
| (13) |
The light fluence rate depends in a complex way on the optical properties μa and μs’ and also varies on the radius of the cavity [102]. Figure 7 (a) – (c) (dashed-dotted lines) shows the light fluence rate, normalized to S/4πr2, vs. μeff for a range of μs’ between 2 and 20 cm−1 for a MS point source inside a 10 cm radius sphere at 0.5 cm depth. Comparing the multiple scattering (MS) point source (dashed-dotted lines) to the planar source (dashed line) at the same depth in tissue (0.5 cm), the former is 3–7 times higher than the later, depending on the optical properties. This increased value is due entirely to the effect of multiple scattering, with minor influence due to the curvature of the 10 cm sphere compared to that of the flat semi-infinite geometry. The light fluence rate for multiple scattering conditions is also higher than that without multiple scattering at tissue surface (Fig. 7(d) for MS point source vs. Fig. 6 for collimated planar source). Staveren et al [102, 105, 106] found that at the cavity boundaries, diffusion theory fails while MC simulations still work. The light fluence rate inside the cavity is affected by the index of refraction of the non-scattering medium inside the cavity and that of tissue at the boundaries[102, 103]. The presence of scattering medium inside the cavity causes a significant increase in the reflection factor β, which at wavelengths lower than 630 nm causes a reduced integrating sphere effect, where the backscattered light does not increase the overall fluence as greatly as at higher wavelengths [105]. Staveren et al [106] also found that for a relatively large β the position of the light does not greatly affect the fluence rate within the cavity, which is mostly due to scattered light from the source. Marijnissen et al [107] found β to vary greatly (2.5<β<7.1) which reveals how different amounts of increased scattered light will be from patient to patient.
The effect of tissue optical property heterogeneity on the light fluence rate inside a cavity remains to be examined. In addition, future work must account for the effect of the arbitrary shape of cavities in clinical settings with the indices of refraction at the cavity-tissue boundary mismatched.
VI. Conclusion
In vivo optical properties are critical quantities that determine the fluence rates in tissues. Several spectroscopic techniques can be used to determine the optical properties, but the most commonly used technique is the CW broadband diffuse reflectance, which is both inexpensive and well tested. A table of in vivo optical properties for human tissue, published in the literature over the last two decades, is compiled for different tissue types of the human body along with the absorption and scattering spectra of several organs.
Acknowledgements
The authors would like to thank useful discussions with Jarod C Finlay, Ken Wang, and Craig Grossman. One of the authors (JS) would like to acknowledge the financial support of Fontaine Foundation. This work is supported by grants from National Institute of Health (NIH) RO1 CA109456 and PO1 CA87971.
Footnotes
User's manual of SphereOptics, "Integrating sphere Design and Applications Technical Information"
References
- 1.Graff R, Dassel ACM, Koelink MH, de Mul F, de Mul FFM, Aarnoudse JG, Zijistra WG. Appl Opt. 1993;32(4):435–447. doi: 10.1364/AO.32.000435. [DOI] [PubMed] [Google Scholar]
- 2.Zhu TC, Hahn SM, Kapatkin AS, Dimofte A, Rodriguez CE, Vulcan T, Glatstein E, Hsi RA. Photochem Photobiol. 2003;77:81–88. doi: 10.1562/0031-8655(2003)077<0081:ivopon>2.0.co;2. [DOI] [PubMed] [Google Scholar]
- 3.Cheong WF, Prahl SA, Welch AJ. IEEE J Quan Elec. 1990;26(12):2166–2185. [Google Scholar]
- 4.Wilson BC, Jeeves WP, Lowe DM. Photochem Photobiol. 1985;42(2):153–162. doi: 10.1111/j.1751-1097.1985.tb01554.x. [DOI] [PubMed] [Google Scholar]
- 5.Marchesini R, Clemente C, Pignoli E, Brambilla M. J Photochem. Photobiol. 1992;16(2):127–140. doi: 10.1016/1011-1344(92)80004-f. [DOI] [PubMed] [Google Scholar]
- 6.Choi J, Wolf M, Toronov V, Wolf U, Polzonetti C, Hueber D, Safanova L, Gupta R, Michalos A, Mantulin W, Gratton E. J Biomed Opt. 2004;9(1):221–229. doi: 10.1117/1.1628242. [DOI] [PubMed] [Google Scholar]
- 7.Bevilacqua F, Piguet D, Marquet P, Gross JD, Tromberg BJ, Depeursinge C. Appl Opt. 1999;38(22):4939–4950. doi: 10.1364/ao.38.004939. [DOI] [PubMed] [Google Scholar]
- 8.Zhao J, Ding H, Hou X, Zhou C, Chance B. J Biomed Opt. 2005;10(2) doi: 10.1117/1.1891345. 024048. [DOI] [PubMed] [Google Scholar]
- 9.van Veen RLP, Sterenborg HJC, Marinelli AWKS, Menke-Pluymers M. J Biomed Opt. 2004;9(6):1129–1136. doi: 10.1117/1.1803547. [DOI] [PubMed] [Google Scholar]
- 10.Mobley J, Vo-Dinh T. In: Biomedical Photonics Handbook. Vo-Dinh T, editor. New York: CRC Press; 2003. [Google Scholar]
- 11.Zhu TC, Dimofte A, Finlay JC, Stripp D, Busch T, Miles J, Whitting R, Malowicz SB, Tochner Z, Glatstein E, Hahn SM. Photochem Photobiol. 2005;81(1):96–105. doi: 10.1562/2004-06-25-RA-216. [DOI] [PMC free article] [PubMed] [Google Scholar]
- 12.Welch AJ, van Gemert MJC, Kogelnik H. Optical Thermal Response of Laser-Irradiated Tissue. New York: Plenum Press; 1995. [Google Scholar]
- 13.Keinle A, Forster FK, Hibst R. Opt Lett. 2004;29(22):2617–2619. doi: 10.1364/ol.29.002617. [DOI] [PubMed] [Google Scholar]
- 14.Keinle A, Wetzel C, Bassi A, Comelli D, Taroni P, Pifferi A. J Biomed Opt. 2007;12(1) 014026. [Google Scholar]
- 15.Hebden JC, Guerrero JTG, Chernomordik V, Gandjbakhche AH. Opt Lett. 2004;29(21):2518–2520. doi: 10.1364/ol.29.002518. [DOI] [PubMed] [Google Scholar]
- 16.Nickell S, Hermann M, Essenpreis M, Farrell T, Kramer U, Patterson M. Phys Med Biol. 2000;45:2873–2886. doi: 10.1088/0031-9155/45/10/310. [DOI] [PubMed] [Google Scholar]
- 17.Henyey LG, Greenstein JL. Astrophys J. 1941;93:70–83. [Google Scholar]
- 18.Haskell RC, Svaasand LO, Tsay T-T, Feng T-C, McAdams MS, Tromberg BJ. J OSA. 1994;11(10):2727–2741. doi: 10.1364/josaa.11.002727. [DOI] [PubMed] [Google Scholar]
- 19.Groenhuis R, Ferwerda H, Ten Bosch J. Appl Opt. 1983;22(16):2452. doi: 10.1364/ao.22.002463. [DOI] [PubMed] [Google Scholar]
- 20.Hull EL, Foster TH. J OSA. 2001;18(3):584–599. [Google Scholar]
- 21.Boas DA, Liu H, O'leary M, Chance B, Yodh A. Proc SPIE. 1995;2389:240–247. [Google Scholar]
- 22.Aydin ED, Oliveira CRE, Goddard AJH. Med Phys. 2002;29(9):2013–2023. doi: 10.1118/1.1500404. [DOI] [PubMed] [Google Scholar]
- 23.Keinle A, Patterson MS. Phys Med Biol. 1996;41:2221. doi: 10.1088/0031-9155/41/10/026. [DOI] [PubMed] [Google Scholar]
- 24.Wang L, Jacques SL, Zheng L. Com Meth Prog Biomed. 1995;47:131–146. doi: 10.1016/0169-2607(95)01640-f. [DOI] [PubMed] [Google Scholar]
- 25.Prahl SA, Keijzer M, Jacques SL, Welch A. Proc SPIE. 1989;IS 5:102–111. [Google Scholar]
- 26.Wang LV, Wu H. In: Biomedical Optics. Wang LV, editor. Hoboken: Wiley Interscience; 2007. [Google Scholar]
- 27.Jacques SL, Pogue BW. J Biomed Opt. 2008;13(4) doi: 10.1117/1.2967535. 041302. [DOI] [PubMed] [Google Scholar]
- 28.Jacques SL, H WL. In: Optical-thermal response of laser irradiated tissues. Welch A, van Gemert M, editors. New York: Plenum Press; 1995. [Google Scholar]
- 29.Wang HW, Finay JC, Lee LK, Zhu TC, Putt M, Glatsein E, Koch C, Evans S, Hahn S, Busch T, Yodh A. J Biomed Opt. 2007;12(3):1–11. [Google Scholar]
- 30.Solenenko M, Cheung R, Busch T, Kachur A, Griffin G, Vulcan T, Zhu TC, Wang H-W, Hahn SM, Yodh A. Phys Med Biol. 2002;47:857–873. [PubMed] [Google Scholar]
- 31.Farrell TJ, Patterson MS, Wilson BC. Med Phys. 1992;19(4):879–888. doi: 10.1118/1.596777. [DOI] [PubMed] [Google Scholar]
- 32.Ao H, Xing D, Wei H, Gu H, Wu G, Lu J. Phys Med Biol. 2008;53:2197–2206. doi: 10.1088/0031-9155/53/8/013. [DOI] [PubMed] [Google Scholar]
- 33.Dimofte A, Finley JC, Zhu TC. Phys Med Biol. 2005;50(10):2291. doi: 10.1088/0031-9155/50/10/008. [DOI] [PMC free article] [PubMed] [Google Scholar]
- 34.Larsson M, Nilsson H, Stromberg T. Appl Opt. 2003;1:124–134. doi: 10.1364/ao.42.000124. [DOI] [PubMed] [Google Scholar]
- 35.Wang HW, Zhu TC, Putt M, Solenenko M, Metz J, Dimofte A, Miles J, Fraker D, Glatsein E, Hahn SM, Yodh A. J Biomed Opt. 2005;10(1):0140041–01400413. doi: 10.1117/1.1854679. [DOI] [PubMed] [Google Scholar]
- 36.Hull EL, Nichols MG, Foster TH. Phys Med Biol. 1998;43(11):3381–3404. doi: 10.1088/0031-9155/43/11/014. [DOI] [PubMed] [Google Scholar]
- 37.Keinle A, Patterson MS. J OSA. 1997;14(1):246–254. doi: 10.1364/josaa.14.000246. [DOI] [PubMed] [Google Scholar]
- 38.Johansson A. Ph.D. Thesis. Lund: Lund University; 2007. [Google Scholar]
- 39.Zhu TC, Finlay JC, Hahn SM. J Photochem Photobiol B: Biol. 2005;79(3):231–241. doi: 10.1016/j.jphotobiol.2004.09.013. [DOI] [PMC free article] [PubMed] [Google Scholar]
- 40.Li J, Zhu TC. Phys Med Biol. 2008;53(8):2103–2114. doi: 10.1088/0031-9155/53/8/007. [DOI] [PMC free article] [PubMed] [Google Scholar]
- 41.Svensson T. Ph.D. Thesis. Lund: Lund University; 2008. [Google Scholar]
- 42.Wilson BC, Welch A, van Gemert MJC. Optical-Thermal Response of Laser-Irradiated Tissue. New York: Plenum Press; 1995. [Google Scholar]
- 43.Jacques SL, Wang LH, Hielscher A. In: Optical_thermal Response of Laser-Irradiated Tissue. Welch A, van Gemert M, editors. New York: Plenum Press; 1995. [Google Scholar]
- 44.Svensson T, Andersson-Engels S, Einardsdottir M, Svanberg K. J Biomed Opt. 2007;12(1):0140221–01402210. doi: 10.1117/1.2435175. [DOI] [PubMed] [Google Scholar]
- 45.Liu H, Boas DA, Zhange Y, Yodh A, Chance B. Phys Med Biol. 1995;40(11):1983–1993. doi: 10.1088/0031-9155/40/11/015. [DOI] [PubMed] [Google Scholar]
- 46.Yu G, Durduran T, Furuya D, Greenberg J, Yodh A. Appl Opt. 2003;42(16):2931–2939. doi: 10.1364/ao.42.002931. [DOI] [PubMed] [Google Scholar]
- 47.Patterson MS, Pogue BW. Appl Opt. 1994;33(10):1963–1974. doi: 10.1364/AO.33.001963. [DOI] [PubMed] [Google Scholar]
- 48.Pogue BW, Patterson MS. Phys Med Biol. 1994;39(7):1157–1180. doi: 10.1088/0031-9155/39/7/008. [DOI] [PubMed] [Google Scholar]
- 49.Torricelli A, Taroni P, Giambattistelli E, Cubeddu R. Phys Med Biol. 2001;46:2227–2237. doi: 10.1088/0031-9155/46/8/313. [DOI] [PubMed] [Google Scholar]
- 50.Sevick EM, Chance B, Leigh J, Nioka S, Maris M. Analytical Biochemistry. 1991;195:330. doi: 10.1016/0003-2697(91)90339-u. [DOI] [PubMed] [Google Scholar]
- 51.Patterson MS. In: Optical-Thermal Response of Laser-Irradiated Tissue. Welch A, Van Gemert M, editors. New York: Plenum Press; 1995. [Google Scholar]
- 52.Fantini S, Hueber D, Franceschini MA, Gratton E, Rosenfeld W, Stubblefield PG, Maulik D, Stankovic MR. Phys Med Biol. 1999;44:1543–1563. doi: 10.1088/0031-9155/44/6/308. [DOI] [PubMed] [Google Scholar]
- 53.Faber D, Aalders M, Mik E, Hooper B, van Gemert M, Leeuwen T. Phys Rev Lett. 2004;93(2):0281021–0281024. doi: 10.1103/PhysRevLett.93.028102. [DOI] [PubMed] [Google Scholar]
- 54.Zijlstra W, Buursma A, Meeuwsen-van der Roest W. Clin Chem. 1991;37(9):1633–1638. [PubMed] [Google Scholar]
- 55.Friebel M, Helfman J, Netz U, Meinke M. J Biomed Opt. 2009;14(3) doi: 10.1117/1.3127200. [DOI] [PubMed] [Google Scholar]
- 56.Srinivasan S, Pogue BW, Jiang S, Dehghani H, Kogel C, Soho S, Gibson JJ, Tosteson TD, Poplack SP, Paulsen KD. Acad. Radiol. 2006;13(2):195–202. doi: 10.1016/j.acra.2005.10.002. [DOI] [PubMed] [Google Scholar]
- 57.Srinivasan S, Pogue BW, Jiang S, Dehghani H, Kogel C, Soho S, Gibson JJ, Tosteson TD, Poplack SP, Paulsen KD. Proc Nat Acad Sci. 2003;100(21):12349–12354. doi: 10.1073/pnas.2032822100. [DOI] [PMC free article] [PubMed] [Google Scholar]
- 58.Roggan A, Friebel M, Helfman J, Netz U, Meinke M. J Biomed Opt. 1999;4(1):36–46. doi: 10.1117/1.429919. [DOI] [PubMed] [Google Scholar]
- 59.Lu C, Lee C, Tsai M, Wang, C. YY. Opt Lett. 2008;33(5):416–418. doi: 10.1364/ol.33.000416. [DOI] [PubMed] [Google Scholar]
- 60.McMurdy J, Jay G, Suner S, Crawford G. J. Biophoto. 2009;2(5):277–287. doi: 10.1002/jbio.200910019. [DOI] [PubMed] [Google Scholar]
- 61.Yodh A, Chance B. Phys Today. 1995;48(3):34–40. [Google Scholar]
- 62.Nishidate I, Aizu Y, Mishina H. J Biomed Opt. 2004;9(4):700–710. doi: 10.1117/1.1756918. [DOI] [PubMed] [Google Scholar]
- 63.Zonios G, Dimou A, Bassukas I, Galaris D, Tsolakidis A, Kaxiras E. J Biomed Opt. 2008;13(1) doi: 10.1117/1.2844710. 014017. [DOI] [PubMed] [Google Scholar]
- 64.Kollias N, Sayre RM, Zeisse L, Chedekel M. J Photochem. Photobiol. 1991;9:135–160. doi: 10.1016/1011-1344(91)80147-a. [DOI] [PubMed] [Google Scholar]
- 65.Marchesini R, Bono A, Carrara M. J Biomed Opt. 2009;14(014027) doi: 10.1117/1.3080140. [DOI] [PubMed] [Google Scholar]
- 66.Kollias N, Baqer A. J Inv Derm. 1984;85:38–42. doi: 10.1111/1523-1747.ep12275011. [DOI] [PubMed] [Google Scholar]
- 67.Mourant JR, Freyer J, Hielscher A, Eick A, Shen D, Johnson T. Appl Opt. 1998;37(16):3586–3593. doi: 10.1364/ao.37.003586. [DOI] [PubMed] [Google Scholar]
- 68.Mourant JR, Canpolat M, Brocker C, Esponda-Ramos O, Johnson T, Matanock A, Stetter K, Freyer J. J Biomed Opt. 2000;5(2):131–137. doi: 10.1117/1.429979. [DOI] [PubMed] [Google Scholar]
- 69.Mourant JR, Fuselier T, Boyer J, Johnson T, Bigio IJ. Appl Opt. 1997;36(4):948–957. doi: 10.1364/ao.36.000949. [DOI] [PubMed] [Google Scholar]
- 70.Bohren C, Hoffman D. Absorption and Scattering of Light by Small Particles. New York: Wiley; 1983. [Google Scholar]
- 71.Mie G. Ann. der Physik. 1908;25:377–445. [Google Scholar]
- 72.Dave JV. IBM J. Res. Dev. 1969;13(3):302–313. [Google Scholar]
- 73.Verner M, Barta, Sedlacek B. J. Colloid Interface Sci. 1977;62(2):348–349. [Google Scholar]
- 74.Cachorro VE, Salcedo LL, Casonova JL. Opt. Pura Apl. 1989;22(1):1–7. [Google Scholar]
- 75.Volkov NG, Kovach VY. Izv. Akad. Nauk. SSSR Fiz. Atmos. Okeana. 1990;26(5):517–523. [Google Scholar]
- 76.Wang HW, Zhu TC, Solenenko M, Hahn SM, Metz J, Dimofte A, Mile J, Yodh A. Proc. SPIE. 2003;68:857–873. [Google Scholar]
- 77.Heilscher A, Mourant JR, Bigio IJ. Appl Opt. 1997;36(1):125–135. doi: 10.1364/ao.36.000125. [DOI] [PubMed] [Google Scholar]
- 78.Taitelbaum H, Haviin S, Weiss GH. Appl Opt. 1989;28(12):2245–2249. doi: 10.1364/AO.28.002245. [DOI] [PubMed] [Google Scholar]
- 79.Keinle A, Patterson MS, Dognitz N, Bays R, Wagnieres G, van den Bergh H. Appl Opt. 1998;37(4):779–791. doi: 10.1364/ao.37.000779. [DOI] [PubMed] [Google Scholar]
- 80.Schmitt JM, Zhou GX, Walker EC. J Opt Sco Am. 1990;7(11):2141–2153. doi: 10.1364/josaa.7.002141. [DOI] [PubMed] [Google Scholar]
- 81.Farrell TJ, Patterson MS, Essenpries M. Appl Opt. 1998;37(10):1958–1972. doi: 10.1364/ao.37.001958. [DOI] [PubMed] [Google Scholar]
- 82.Dougherty TJ, Gomer DJ, Henderson BW, Jori G, Kessel D, Korbelik M, Moan J, Peng Q. J. Natl. Cancer Inst. 1998;90(12):889–905. doi: 10.1093/jnci/90.12.889. [DOI] [PMC free article] [PubMed] [Google Scholar]
- 83.Yu G, Durduran T, Zhou C, Wang HW, Putt ME, Saunders M, Sehgal CM, Glatstein E, Yodh AG, Busch TM. Clin Can Res. 2005;11:3543–3552. doi: 10.1158/1078-0432.CCR-04-2582. [DOI] [PubMed] [Google Scholar]
- 84.Wilson B, Patterson M, Lilge L. Laser Med Sci. 1997;12:182–199. doi: 10.1007/BF02765099. [DOI] [PubMed] [Google Scholar]
- 85.Zhu TC, Finlay JC. Med Phys. 2008;35(7):3127–3136. doi: 10.1118/1.2937440. [DOI] [PMC free article] [PubMed] [Google Scholar]
- 86.Zhu TC, Dimofte A, Hahn SM, Lustig RA. Proc SPIE. 2003;4952:56. doi: 10.1117/12.474144. [DOI] [PMC free article] [PubMed] [Google Scholar]
- 87.Zhu TC, Finlay JC, Dimofte A, Hahn SM. Proc SPIE. 2004;5315:113–124. doi: 10.1117/12.529827. [DOI] [PMC free article] [PubMed] [Google Scholar]
- 88.Wilson BC, Patterson MS. Phys Med Biol. 2008;53:61–109. doi: 10.1088/0031-9155/53/9/R01. [DOI] [PubMed] [Google Scholar]
- 89.Martelli F, Sassaroli A, Zaccanti G, Yamada Y. Phys Med Biol. 1999;44 doi: 10.1088/0031-9155/44/5/013. [DOI] [PubMed] [Google Scholar]
- 90.Wang LV, Nordquist R, Chen W. Appl Opt. 1997;36(31):8286–8291. doi: 10.1364/ao.36.008286. [DOI] [PubMed] [Google Scholar]
- 91.Wang LV, Jacques SL. Appl Opt. 1995;34(13):2362–2366. doi: 10.1364/AO.34.002362. [DOI] [PubMed] [Google Scholar]
- 92.Dimofte A, Zhu T, Hahn S, Lustig R. Laser Surg Med. 2002;31(5):305–312. doi: 10.1002/lsm.10115. [DOI] [PubMed] [Google Scholar]
- 93.Star WM. Phys Med Biol. 1997;42:763–787. doi: 10.1088/0031-9155/42/5/003. [DOI] [PubMed] [Google Scholar]
- 94.Jacques SL. Photochem Photobiol. 1998;67(1):23–52. [PubMed] [Google Scholar]
- 95.Gardner C, Jacques S, Welch A. Las Med Sci. 1996;18:129–138. doi: 10.1002/(SICI)1096-9101(1996)18:2<129::AID-LSM2>3.0.CO;2-U. [DOI] [PubMed] [Google Scholar]
- 96.Li J, Zhu JC, Finay TC. Proc SPIE. 2006;6139 [Google Scholar]
- 97.Altschuler MD, Zhu T, Li J, Hahn S. Proc SPIE. 2005;5689:186–197. doi: 10.1117/12.590343. [DOI] [PMC free article] [PubMed] [Google Scholar]
- 98.Johansson A, Johansson T, Thompson MS, Bendsoe N, Svanberg K, Svanberg S, Andersson-Engels S. J Biomed Opt. 2006;11(3):030429-030421–030429-030410. doi: 10.1117/1.2204027. [DOI] [PubMed] [Google Scholar]
- 99.Zhu TC, Li J, Finay JC, Dimofte A, Stripp D, Malkowicz B, Hahn SM. Proc SPIE. 2006;6139 doi: 10.1117/12.646220. [DOI] [PMC free article] [PubMed] [Google Scholar]
- 100.Li J, Altschuler MD, Hahn SM, Zhu TC. Phys Med Biol. 2008;53(15):4107–4121. doi: 10.1088/0031-9155/53/15/007. [DOI] [PMC free article] [PubMed] [Google Scholar]
- 101.Davidson S, Weersink R, Haider M, Gertner M, Bogaards A, Giewercer D, Scherz A, Trachtenberg J, Wilson B. Phys Med Biol. 2009;54:2293–2311. doi: 10.1088/0031-9155/54/8/003. [DOI] [PubMed] [Google Scholar]
- 102.Staveren H, Keijzer M, Keesmaat T, Jansen H, Kirkel W, Beek J, Star W. Phys Med Biol. 1996;41:579–590. doi: 10.1088/0031-9155/41/4/001. [DOI] [PubMed] [Google Scholar]
- 103.van Gemert MJC, Cheong WF, Welch AJ, Star WM. Laser Surg Med. 1987;2:273–284. [Google Scholar]
- 104.Star WM. Phys Med Biol. 1995;40:1–8. doi: 10.1088/0031-9155/40/1/001. [DOI] [PubMed] [Google Scholar]
- 105.Staveren H, Beek J, Keijzer M, Star W. Phys Med Biol. 1995;40:1307–1315. doi: 10.1088/0031-9155/40/8/001. [DOI] [PubMed] [Google Scholar]
- 106.Staveren H, Beek J, Ramaekers J, Keijzer M, Star W. Phys Med Biol. 1994;39:947–959. doi: 10.1088/0031-9155/39/6/003. [DOI] [PubMed] [Google Scholar]
- 107.Marijnissen JPA, Star W, Zandt HJA, D'Hallewin MA, Baert L. Phys Med Biol. 1993;38:567–582. doi: 10.1088/0031-9155/38/5/001. [DOI] [PubMed] [Google Scholar]
- 108.Beck T, Beyer W, Pongratz T, Stummer W, Waidelich R, Stepp H, Wagner S, Baumgartner R. Proc SPIE. 2003;5138:96–105. [Google Scholar]
- 109.Pifferi A, Torricelli A, Taroni P, Bassi A, Chikoidaze E, Giambattistelli E, Cubeddu R. J Biomed Opt. 2004;9(3):474–480. doi: 10.1117/1.1691029. [DOI] [PubMed] [Google Scholar]
- 110.Driver I, Lowdell C, Ash D. Phys Med Biol. 1991;36(6):805–813. doi: 10.1088/0031-9155/36/6/008. [DOI] [PubMed] [Google Scholar]
- 111.Wilson BC, Muller PJ, Yanch JC. Phys Med Biol. 1986;31(2):125–133. doi: 10.1088/0031-9155/31/2/002. [DOI] [PubMed] [Google Scholar]
- 112.Ijichi S, Kusaka T, Isobe K, Okubo K, Kawada K, Namba M, Okada H, Nishida T, Imai T, Itoh S. Ped Res. 2005;58(3):568–573. doi: 10.1203/01.PDR.0000175638.98041.0E. [DOI] [PubMed] [Google Scholar]
- 113.Spinelli L, Torricelli A, Pifferi A, Taroni P, Danesini G, Cubeddu R. J Biomed Opt. 2004;9(6):1137–1142. doi: 10.1117/1.1803546. [DOI] [PubMed] [Google Scholar]
- 114.Cubeddu R, Pifferi A, Taroni P, Torricelli A, Valentini G. Appl Phys Lett. 1999;74(6):874–876. [Google Scholar]
- 115.Pifferi A, Swartling J, Chikoidaze E, Torricelli A, Taroni P, Bassi A, Andersson-Engels S, Cubeddu R. J Biomed Opt. 2004;9(6):1143–1151. doi: 10.1117/1.1802171. [DOI] [PubMed] [Google Scholar]
- 116.Rajaram R, Kovacic D, Migden M, Reichenberg J, Nguyen T, Tunnell J. Proc SPIE. 2009;7161 716102. [Google Scholar]
- 117.Mo W, Chang T, Chen L, Chen N. J Biomed Opt. 2009;14(6) doi: 10.1117/1.3257251. 064004. [DOI] [PubMed] [Google Scholar]
- 118.Cerussi A, Shah N, Hsiang D, Durkin A, Butler J, Tromberg B. J Biomed Opt. 2006;11(4) doi: 10.1117/1.2337546. 044005. [DOI] [PubMed] [Google Scholar]
- 119.Durduran T, Choe R, Culver J, Zubkov L, Holboke M, Gaimmarco J, Chance B, Yodh A. Phys Med Biol. 2002;47:2847–2861. doi: 10.1088/0031-9155/47/16/302. [DOI] [PubMed] [Google Scholar]
- 120.Suzuki K, Yamashita Y, Ohta K, Kaneko M, Yoshida M, Chance B. J Biomed Opt. 1996;1(3):330. doi: 10.1117/12.239902. [DOI] [PubMed] [Google Scholar]
- 121.Heusmann H, Kolzer J, Mittick G. J Biomed Opt. 1996;1(4):425. doi: 10.1117/12.250669. [DOI] [PubMed] [Google Scholar]
- 122.Shah N, Cerussi A, Jakubowski D, Hsiang D, Butler J, Tromberg B. J Biomed Opt. 2004;9(3):534–540. doi: 10.1117/1.1695560. [DOI] [PubMed] [Google Scholar]
- 123.Nair M, Ghosh N, Raju N, Pradan A. Appl Opt. 2002;41(9):4024–4035. doi: 10.1364/ao.41.004024. [DOI] [PubMed] [Google Scholar]
- 124.Fantini S, Walker SA, Franceschini MA, Kaschke M, Schlag PM, Moesta KT. Appl Opt. 1998;37(10):1982–1989. doi: 10.1364/ao.37.001982. [DOI] [PubMed] [Google Scholar]
- 125.Dimofte A, Zhu T, Finay J, Cullighan M, Edmonds C, Friedberg J, Cengel K, Hahn S. Proc SPIE. 2010;7551 doi: 10.1117/12.851514. 755115. [DOI] [PMC free article] [PubMed] [Google Scholar]
- 126.Dimofte A, Zhu T, Finlay J, Culligan M, Edmonds C, Friedberg J, Cengel K, Hahn S. Proc SPIE. 2009;7164 doi: 10.1117/12.809548. [DOI] [PMC free article] [PubMed] [Google Scholar]
- 127.Lee LK, Whitehurst C, Pantelides MK, Moore JV. BJU Int. 1999;84:821–826. doi: 10.1046/j.1464-410x.1999.00314.x. [DOI] [PubMed] [Google Scholar]
- 128.Lee L, Whitehurst C, Pantelides M, Moore J. Photochem Photobiol. 1995;62:882–886. doi: 10.1111/j.1751-1097.1995.tb09151.x. [DOI] [PubMed] [Google Scholar]
- 129.Levy D, Schwartz J, Ostermeyer M, Jacques S, von Eschenbach A. Proc SPIE. 1996;2671:329–334. [Google Scholar]
- 130.Swartling J, Axelsson J, Ahlgren G, Kalkner K, Nilsson S, Svanberg S, Svanberg K, Andersson-Engels S. J Biomed Opt. 2010;15(5) doi: 10.1117/1.3495720. 058003. [DOI] [PubMed] [Google Scholar]
- 131.Svensson T, Alerstam E, Einarsdottir M, Svanberg K, Andersson-Engels S. J. Biophoto. 2008;1(3):200–203. doi: 10.1002/jbio.200710025. [DOI] [PubMed] [Google Scholar]
- 132.Weersink RA, Bogaards A, Gertner M, Davidson SRH, Zhange K, Netchev G, Trachtenberg J, Wilson BC. J Photochem Photobiol B: Biol. 2005;79:211–222. doi: 10.1016/j.jphotobiol.2005.01.008. [DOI] [PubMed] [Google Scholar]
- 133.Moore C, Mosse C, Allen C, Payne H, Emberton M, Bown S. J Biomed Opt. 2011;16(1) doi: 10.1117/1.3528638. 015003. [DOI] [PubMed] [Google Scholar]
- 134.Zonios G, Dimou A. Opt Exp. 2008;16(11):8263. doi: 10.1364/oe.16.008263. [DOI] [PubMed] [Google Scholar]
- 135.Finlay JC, Zhu TC, Dimofte A, Stripp D, Malkowicz S, Whittington R, Miles J, Glatstein E, Hahn SM. Proc. SPIE. 2004;5315:132–142. doi: 10.1117/12.528968. [DOI] [PMC free article] [PubMed] [Google Scholar]
- 136.Sun P, Yang R, Xie F, Ding J, Zhang F, Cao X. Proc SPIE. 2010;7845 784522. [Google Scholar]
- 137.Matcher S, Cope M, Delpy D. Appl Opt. 1997;36(1):386–396. doi: 10.1364/ao.36.000386. [DOI] [PubMed] [Google Scholar]
- 138.Taroni P, Pifferi A, Torricelli A, Comelli D, Cubeddu R. Photochem Photobiol. 2003;2:124–129. doi: 10.1039/b209651j. [DOI] [PubMed] [Google Scholar]


