Abstract
Single-molecule fluorescence spectroscopy reveals the real time dynamics that occur during biomolecular interactions that would otherwise be hidden by the ensemble average. It also removes the requirement to synchronize reactions, thus providing a very intuitive approach to study kinetics of biological systems. Surface immobilization is commonly used to increase observation times to the minute time scale, but it can be detrimental if the sample interacts non-specifically with the surface. Here, we review detailed protocols to prevent such interactions by passivating the surface or by trapping the molecules inside surface immobilized lipid vesicles. Finally, we discuss recent examples where these methods were applied to study the dynamics of important cellular processes at the single molecule level.
Keywords: single molecule, Nucleic acid -Protein complex, FRET, TIRF, vesicle
1. Introduction
Over the last two decades, single-molecule spectroscopy has provided valuable structural and kinetic information about complex biological systems (1–7). Some of the advantages that single-molecule approaches offer over ensemble-averaged experiments are that they directly reveal the presence of heterogeneous populations and allow access kinetic information without synchronization. Furthermore, single molecule experiments monitor kinetic pathways in real time, thus revealing the existence of relevant kinetic intermediates. Single-Molecule spectroscopy has been applied to elucidate the mechanisms of numerous systems such as RNA and DNA polymerases (1–4), small and large ribozymes (5–9) and molecular motors (10, 11) among many others. More recently, single molecule assays have been developed to study gene expression in vivo (12, 13) as well as DNA and RNA sequencing (14–16).
Several approaches have been developed to study immobilized single molecules with fluorescence detection (17–20). Fluorescence studies often rely on Fluorescence Resonance Energy Transfer (FRET), an increasingly popular approach to follow conformational changes of macromolecules and measure intermolecular interactions in real time. FRET uses two fluorophores, a donor and an acceptor, whose spectral overlap (between the donor emission spectrum and the acceptor excitation spectrum) results in energy transfer from the excited donor to the acceptor through dipole-dipole interactions (21). The efficiency of FRET is defined as E = (1+(R/R0)6)−1, where R is the distance between the two fluorophores and R0 is the Förster radius at which E = 0.5. Because of the distance dependence of FRET, it has been used as a molecular ruler for distances ranging 20–100 Å. The combination of single-molecule spectroscopy and FRET enables real time monitoring of the global structure and dynamics of isolated molecules. Thus, smFRET is complementary to other structural techniques, such as x-ray crystallography, NMR or cryo-electron microscopy, which can provide structural information at the atomic level but not in real time.
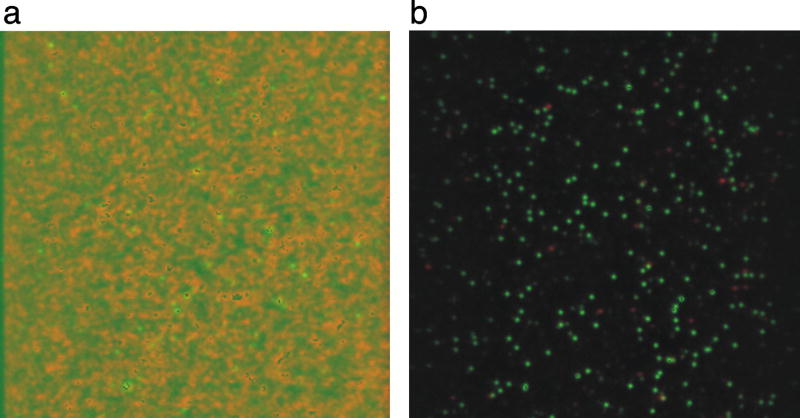
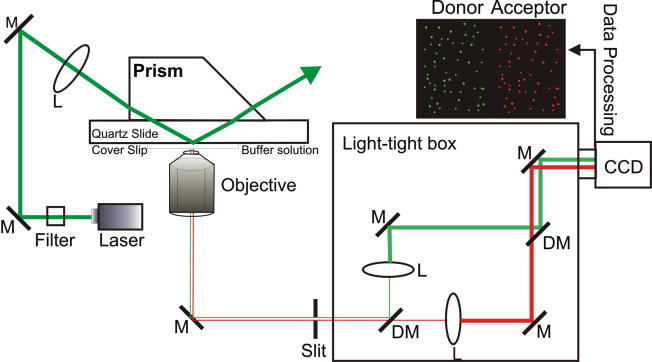
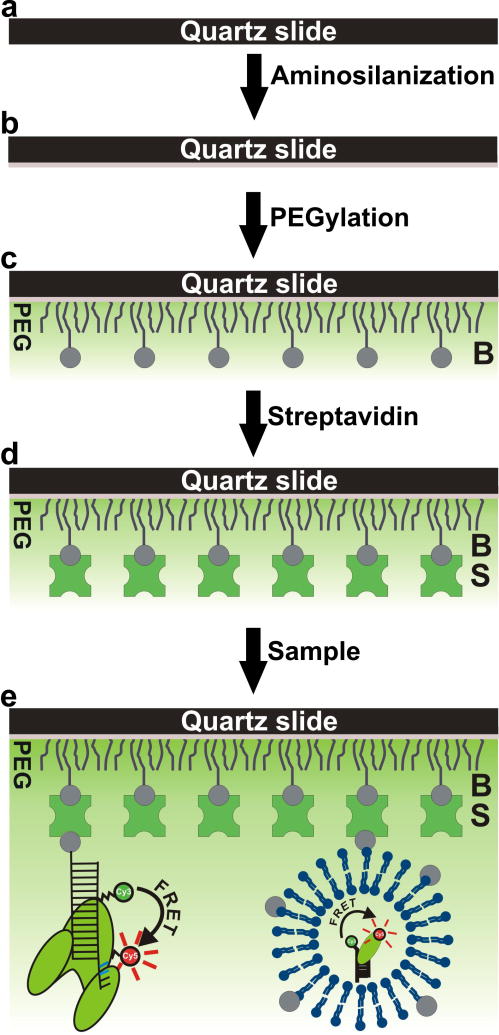
Frequently, molecules are surface-immobilized to extend observation times into the minute time scale (22). Molecules of interest can be immobilized through a biotin-BSA, poly(ethylene glycol) (PEG) conjugated to biotin, PEG with Ni2+ or Cu2+ ions, or using click chemistry. Immobilization is relatively straightforward for nucleic acids alone (DNA or RNA) because their overall negative charge makes them less likely to interact non-specifically with the microscope slide surface, which is also electronegative at neutral pH (23, 24). The most common immobilization strategy for such straightforward experiments is biotin-BSA. However, the study of RNA or DNA interacting with proteins is more challenging because the latter can readily interact non-specifically with the slide surface (Fig. 1a) (25). One way to circumvent this issue is to passivate the slide surface by polymer-coating using, for example, PEG (Fig. 1b) (18, 26). Alternatively, Ni-NTA coated surfaces and PEG with Ni2+ or Cu2+ ions can be used to immobilize His-tagged proteins; as this method is not generally applicable to all systems, we have not discussed it in detail (27–29). The click chemistry method of immoblization was recently introduced and may be useful in preventing interactions with the slide, but it has not yet been applied to systems that include protein (22). In addition, non-specific surface interactions can be suppressed by trapping the molecules inside of lipid vesicles immobilized on a PEGylated surface (30, 31). Here, we review detailed protocols for passivating microscope slides to study RNA, DNA, or protein interactions with proteins by single-molecule Fluorescence Resonance Energy Transfer (smFRET). We will describe protocols for PEGylation, immobilization, and vesicle encapsulation followed by a review of some recent applications. Other reviews have previously described both the theory and basic protocols for smFRET as shown in Fig. 2 (17–20); here, we specifically address protocols essential for studying protein-nucleic acid or protein-protein interactions using smFRET (adapted from (18, 26) with modifications, Fig. 3).
Figure 1.
PEGylation drastically reduces protein-slide non-specific interactions. Overlayed images of two-color emission for donor (green) and acceptor (red). To generate these images, we surface immobilized a single stranded RNA substrate labeled with Cy3 (donor) and Cy5 (acceptor) and added 10 nM of the RNA binding domains 3 and 4 of the polypyrimidine tract binding protein (PTB34) in solution (49) (a) The same sample on a slide without PEG passivation is uninterpretable, as the protein crashes onto the slide surface. (b) On a PEG slide, the protein-RNA sample provides clear and high-quality single molecule data.
Figure 2.
Schematic diagram of excitation and single FRET pair emission for prism-based TIRF. The excitation beam reaches the slide-solution interface and creates an evanescent wave that excites immobilized molecules in aqueous solution. The emission from donor and acceptors are collected through an inverted microscope objective and passed through a slit into a light-tight box, where the donor (green) and acceptor (red) emissions are physically separated. Finally, the two emission signals are detected side-by-side by an electron multiplied back illuminated CCD camera.
Figure 3.
Stepwise representation of surface passivation and sample immobilization. (a) The slide surface is cleaned. (b) The slide is aminosilanized and ready for PEGylation. (c) PEG and biotin-PEG molecules are conjugated to the amine-modified surface (d) Streptavidin is bound to the immobilized biotin-PEG molecules. (e) The sample can either be surface-tethered with an attached biotin or indirectly immobilized after being encapsulated in a biotinylated lipid vesicle. After washing to remove unbound sample, the slide is ready for use.
2. Description of Method
Here, we first describe how to passivate slides with PEG. Then, we define the steps required for sample immobilization prior to smFRET experiments. Finally, we describe how to encapsulate molecules in surface immobilized lipid vesicles on PEG slides.
2.1. Surface Passivation
2.1.1 Cleaning of slides and coverslips
Both the microscope slides and the coverslips must be thoroughly cleaned (Fig. 3a). To build a microfluidic channel through which the sample will be introduced, two holes must be pre-drilled in the slides, as previously described (20). Cleaning the slides and coverslips is one of the most vital steps in slide preparation because the presence of impurities on the surface increase background fluorescence. Here, we have described our standard cleaning protocol, but others have used slightly different procedures (17, 32, 33). Clean the slides by scrubbing with Alconox (VWR International Inc.) paste and remove the soap with distilled water. Scrub and thoroughly rinse slides with ethanol (200 proof) and then with distilled water. These scrubbing steps are necessary for removing debris from previous experiments or from manufacturing of the slide. To remove organic material and restore the silanol groups on the surface, boil the slides for >20 min in 100 mL water, 20 mL NH4OH (ACS grade, Mallinckrodt Chemicals, USA) and 20 mL 30 % H2O2 (EMD Chemicals, USA). Rinse slides with distilled water and dry slides with a Bunsen burner, avoiding formation of any dry deposits on the surface. Place slides and fresh coverslips in separate clean and dry Coplin staining jars (made from clear soda lime glass by Wheaton Industries Inc., USA). Rinse with water. Finally, perform two sonication steps to remove any remaining non-specifically interacting debris. Fill jars with 1 M KOH (ACS certified, Fisher Scientific, USA) and sonicate for 30 minutes. Rinse with distilled water and then with methanol (ACS grade, Fisher Scientific, USA). Fill jars with methanol and sonicate for 30 minutes. Rinse with fresh methanol.
2.1.2 Aminosilanization of slides and cover slips
Clean slides and coverslips must be functionalized with an amino group, which will later react with an N-Hydroxysuccinimide (NHS) ester on the PEG molecule (Fig 3b–c). This is achieved by aminosilanization with 3-aminopropyltriethoxysilane. VECTABONDTM reagent (3-aminopropyltriethoxysilane, Vector Laboratories, Inc., Burlingame, CA) is sensitive to oxidation and should be stored under inert gas. VECTABONDTM should be a colorless solution; yellowing is a sign that oxidation is occurring.
Mix 100 mL methanol, 5 mL acetic acid (ACS grade, Mallinckrodt Chemicals, USA) and 1 mL VECTABONDTM reagent in a clean, dry beaker and pour into the jars, fully covering slides and coverslips.
Incubate for 10 minutes, sonicate for 1 minute and further incubate for 10 minutes.
Rinse slides and coverslips with methanol, distilled water and again with methanol.
Completely dry slides and coverslips in a Coplin jar with inert gas.
2.1.3 Surface PEGylation
Poly(ethylene glycol) is typically used to passivate microscope slides and coverslips to prevent non-specific interactions with proteins. Adsorption of proteins to PEGylated surfaces depends on the size and the surface density of polymer used (34). For standard applications, linear PEG is often sufficient; however, for particularly highly adsorbant proteins, branched PEG can be used (34). Here, we describe coating of slides and cover slips with linear PEG. When branched PEG is used to coat the surface, intermolecular crosslinking can increase the surface density and further prevent interaction between the protein and the glass surface (34, 35). Regardless of the type of PEG used, a fraction of the PEG is biotinylated to provide an anchor for immobilization of biotin-labeled samples through streptavidin (Fig. 3c). The biotin-avidin bridge is a convenient approach to surface immobilize nucleic acids (36, 37) because they are both commercially available, they remain tightly bound to each other (KD ~ pM) (38), and biotin can be easily incorporated to the 3′ or 5′ end of nucleic acids during synthesis or by a labeling reaction (39, 40).
Remove Biotin Polyethylene Glycol Succinimidyl Carboxymethyl (BIO-PEG-SCM, MW 3400/5000, Laysan Bio. Inc, Arab, AL) and Methoxy Polyethylene Glycol Succinimidyl Carboxymethyl (m-PEG-SCM, MW 5000, Laysan Bio. Inc) from storage at −20°C 30–60 minutes before use to allow them to equilibrate to room temperature. Before returning the BIO-PEG-SCM and m-PEG-SCM to −20°C, flush the vial with inert gas, seal with parafilm and wrap in aluminum foil. Prepare PEGylation buffer, 100 mM sodium bicarbonate (NaHCO3, pH 8.4, Fisher Scientific, USA). Sterilize using a 0.2 μm Supor® Membrane syringe filter. Prepare fresh PEGylation buffer each time.
For five pairs of slides and coverslips, dissolve ~80 mg of m-PEG-SCM and 5–8 mg BIO-PEG-SCM (which will introduce 5–10% biotinylated PEG) in 320 μL PEGylation buffer. Vortex gently and centrifuge for one minute at ~10,000 rcf to remove bubbles and mix using a pipette.
Use an old pipette tip box or a similar container as a reaction chamber. Before use, clean the boxes with Kim wipes and distilled water to remove dust. After drying the top of the box and any surface that could contact the slides, fill ~10% of the box with distilled water to maintain a humid environment without contacting the slides directly.
Dry the slides and cover slips with an inert gas. Place slides in the reaction chamber, closing the top to prevent dust accumulation.
Add 70 μL PEGylation reaction mixture to the surface of each slide and allow any bubbles to disappear.
Carefully place one dry cover slip on the top of each slide and solution, avoiding formation of bubbles. This method is used to coat both internal surfaces of the slide and coverslip. After several minutes, ensure that the coverslips have not moved out of place. If the coverslips move, use a clean pipette tip to reposition them carefully.
Incubate the reaction container in the dark overnight.
The following day, carefully separate the coverslips and slides, and rinse them with distilled water and dry completely with an inert gas.
2.1.4 Preparation of sample channel with flow tubing
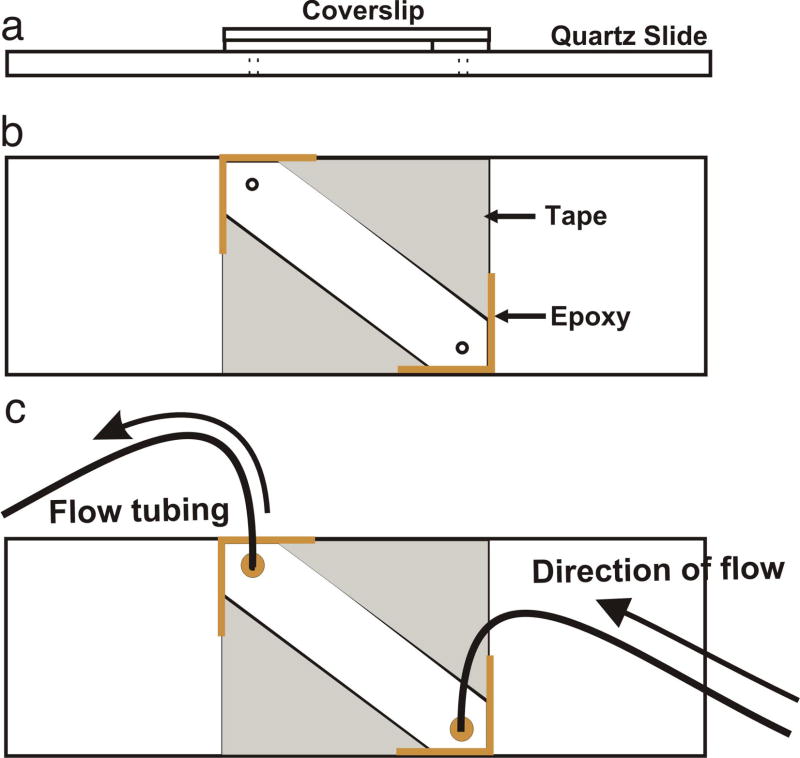
Sandwich-like ~4 mm wide and 200 μm deep flow channels (Fig 4) make it easy to immobilize molecules or exchange buffers during experiment, which can be useful when monitoring conformational changes in real-time. The protocol below describes how to assemble these channels.
Figure 4.
Diagram detailing slide specifications for single molecule experiments. (a) Top view of an assembled microscope slide. (b) Slide with 22 mm long, 8 mm wide and 200 μm deep microfludic channel prepared using two layers of double-sided tape between the quartz slide and cover slip. The assembly is sealed with epoxy at the edges to prevent leaking from the channel. (c) Slide in b with an attached flow tubing for injection of sample.
Keep the PEG surface down on a micro slide staining rack (VWR International Inc.). Insert ~10 cm of 0.51 mm I.D. SILASTIC® laboratory tubing (Dow Corning, Midland, MI) through each hole, such that a small portion protrudes from the PEGylated side. Fix the tubes with epoxy glue (5 min epoxy, ITW Devcon, Danvers, MA) on the non-PEGylated surface of the slide. Wait for half an hour to set epoxy.
Carefully cut the protruding segment of the tube from the PEGylated slide surface using a razor blade. The tube should be flush with the slide so as not to interfere with the channel flow.
Use double-sided sticky tape (Scotch, 3M) to prepare a microfluidic channel on the PEG surface. Apply a piece of tape to each side of the drilled holes approximately 4 mm away and parallel to the hole-centers (Fig. 4). Add a second layer of sticky tape to increase the channel depth to ~200 μm.
Gently place a coverslip on the sticky tape centered on the slide facing the PEGylated surface towards the slide. Remove extra tape along the coverslip edge by cutting with a razor blade.
Mix epoxy and let it begin hardening before applying it to prevent it from sealing the holes in the slide. For 5 min epoxy from ITW Devcon, we find that a ~2 minute waiting period is ideal. Use epoxy to seal the coverslip periphery and let it completely set for ~30 minutes (Fig. 4).
Store the assembled slides with flow tubing in a 50 mL falcon tube under inert gas and protected from light in order to protect from possible photo degradation. For optimal storage, keep in a desiccator. Under these conditions, slides can be stored for up to 2 weeks.
2.2. Sample Immobilization and Preparation
A biotinylated sample (DNA, RNA or protein) is prepared in a buffer of interest (sample buffer) and immobilized on the single molecule slide. The slide is treated with the oxygen scavenging solution (OSS, 10% wt/vol glucose, 50 μg/ml glucose oxidase (Sigma, C2133 ≥ 100 kU/g) and 10 μg/ml catalase (Sigma, C3155 ≥ 35 kU/mg)) to deplete the solution of oxygen molecules and to decrease photobleaching, which can be stimulated in the presence of oxygen. In order to increase the photostability and decrease the blinking of fluorophore, it is important to include β-mercaptoethanol (β-ME) or Trolox in the solution (41). Trolox (6-hydroxy-2,5,7,8-tetramethylchroman-2-carboxylic acid, ACROS Organics, Belgium) is a vitamin E analog that can be used as an antiblinking and antibleaching reagent in single-molecule experiments (42, 43). A saturated Trolox solution (~2 mM) in water is a better candidate to quench triplet state related blinking than β-ME. β-ME increases the photodarkening of the fluorophore in a concentration dependent manner and may not be compatible with many biological systems at high concentrations (41). More detailed information about these agents is available for further reading (41, 43, 44). A stock saturated solution of Trolox can be prepared by dissolving 5 mg of solid Trolox in 10 mL distilled water. Shake the solution at room temperature for 20–30 minutes and filter through a 0.2 μM syringe filter. If stored at 4 °C, this solution can be used for 2 weeks. This Trolox solution can then be used for preparation of buffers and OSS solution used in single-molecule experiments instead of distilled water. A step-by-step protocol for sample preparation and immobilization is detailed below.
During the PEGylation process, 5–10% of Biotinylated PEG was introduced to immobilize the sample. Inject a streptavidin solution (Molecular Probes S888, 0.2 mg/mL in 50 mM Tris-HCl, pH 7.5, 50 mM NaCl) and incubate for 5–10 minutes to allow it to interact with biotin (Fig. 3d). This step will create a binding surface for biotin labeled samples. Wash out excess unbound streptavidin with the sample buffer, inject 10–25 pM biotinylated sample and allow 5–10 minutes for the sample to interact with the streptavidin (Fig. 3e). Wash out the unbound sample with the sample buffer and inject OSS solution prepared in 2 mM Trolox. After 5–10 minutes, the prepared slide can be placed on the microscope stage and used to acquire data. Detailed protocols about sample preparation, immobilization and detection have been extensively reviewed (17, 18, 20, 24).
After use, the slides can be recycled and reused. Boil the slides in water for ~1 hour to soften any epoxy or tape residue from previous experiments and use a razor blade to scrape off any leftover residue from the slides.
2.3. Formation of Lipid Vesicles
For certain systems, a PEGylated surface is not sufficient to prevent non-specific interactions. This may be partially overcome by using different types of self-assembled monolayers to passivate the surface and surface-immobilize the molecules (22). However, the only way to completely eliminate any interactions with the slide surface is to isolate the system (i.e., a nucleic acid-protein complex) inside a lipid vesicle, for example. In addition, the small volume of lipid vesicles brings the effective concentration of single encapsulated molecules into the micromolar range; this can be very useful in studying weak interactions (45). Lipid vesicles can either be non-porous or porous to allow the exchange of small molecules during experiments (30, 31, 45). Vesicles may be porous due to the properties of the lipids chosen or the addition of bacterial toxins (45, 46). The vesicles can be biotinylated and directly immobilized on a PEGylated surface as described above (Fig. 3). The disadvantage of this approach is that it requires significantly more steps to prepare the sample, and once the sample is isolated in a vesicle it becomes challenging to change the conditions inside the vesicle. The following protocols describe how to prepare and encapsulate the sample in the vesicles, from creation and hydration of a lipid film to extrusion of vesicles.
2.3.1 Creation of a Lipid Film
To create lipid vesicles, a combination of lipids must be first mixed in chloroform to obtain a homogenous mixture. For porous vesicles, it is recommended to use DMPC (14:0 DMPC 1,2-dimyristoyl-sn-glycero-3-phosphocholine, Avanti Polar Lipids, Alabaster, AL) and biotinyl-PE (16:0 Biotinyl Cap PE, 1,2-dihexadecanoyl-sn-glycero-3-phosphoethanolamine-N-(cap biotinyl) (sodium salt), Avanti Polar Lipids) lipids to obtain vesicles that can be easily immobilized (45). However, other combinations of lipids with appropriate transition temperatures (the transition temperature must be lower than 80 °C to use the instrument described in the following sections) can be used with the same protocol; for instance EggPC with 1% DPPE biotin can be used to make non-porous vesicles (46). First, dissolve the lipids in chloroform. Be sure to use only materials that are resistant to chloroform for liquid handling and storage. Lipids dissolved in chloroform can be stored at −20 °C under N2 gas. Mix the lipids in a disposable glass test tube. For porous vesicles, use DMPC and biotinyl-PE in a 100:1 molar ratio, as described (45). Dry under a stream of an inert gas and remove residual chloroform with a vacuum system or dessicator for at least 1–2 hours. It is important to remove all of the chloroform so there will not be an organic phase in the next steps.
2.3.2 Hydration of the Lipid Film
During the hydration step, the lipid film is incubated in an aqueous solution above the transition temperature so that it begins to form vesicles. However, these vesicles will not be homogenous or in the proper size range. During this process, the earlier the sample is added, the more efficiently it will be incorporated into vesicles. However, some samples may not be stable for long periods of time at the temperature used for hydration and extrusion or may not tolerate freeze-thaw cycles well. Therefore, the amount of sample added and the time at which it is added must be determined empirically for each system to obtain one molecular complex per vesicle and to ensure that the sample retains activity.
Heat hydration buffer above the transition temperature of the chosen lipids (23 °C for DMPC).
For optimal incorporation into vesicles, add the sample to the hydration buffer. Add 100 – 400 μl of the pre-warmed buffer to the lipid film.
Allow the lipid film to hydrate for at least 30 minutes above the transition temperature of the lipids with gentle shaking or frequent mixing.
Flash freeze using either liquid nitrogen or a dry ice/ethanol bath and thaw to a temperature above the transition temperature. Repeat 3–5 times.
2.3.3 Vesicle Extrusion
Before extruding vesicles, the apparatus must be prepared. Equilibrate the heating block for the mini-extruder (Avanti Polar Lipids) above the transition temperature and hydrate the polycarbonate membrane and filter supports. Be sure that the heating block is below 80 °C to prevent damage to the apparatus. Assemble the mini-extruder as described by the manufacturer. When choosing the pore size of the polycarbonate membrane, note that pores larger than 200 nm produce less homogenous vesicles and consider the size of the evanescent or confocal field. Samples that are unstable during long incubation periods or freeze/thaw cycles can be added immediately prior to extrusion, but as encapsulation will be less efficient, the molecule(s) of interest should be introduced at a higher concentration compared to samples added during freeze/thaw cycles.
Load hydrated vesicles into one of the syringes and place both syringes carefully into the mini-extruder. Make sure that the empty syringe is set to 0.
Place the assembled extruder in the stand according to the product instructions. Use the swing-arm clips to ensure good contact between the syringes and the heating block.
Allow the temperature to equilibrate for 5–10 min.
Gently push the plunger of the syringe to transfer the sample through the extruder and into the other syringe. For single molecule experiments, it is recommended to repeat this step to obtain a minimum of 20 passes through the membrane. Perform an odd number of transfers such that the final extrusion fills the alternate syringe to ensure a homogenous mixture.
Remove the mini-extruder from the heating block and transfer the sample from the syringe to a clean tube. Store the vesicle preparation above the transition temperature of the lipid during the experiment. When not in use, store vesicles at 4°C but do not freeze. Vesicles may be stable for up to 3 or 4 days
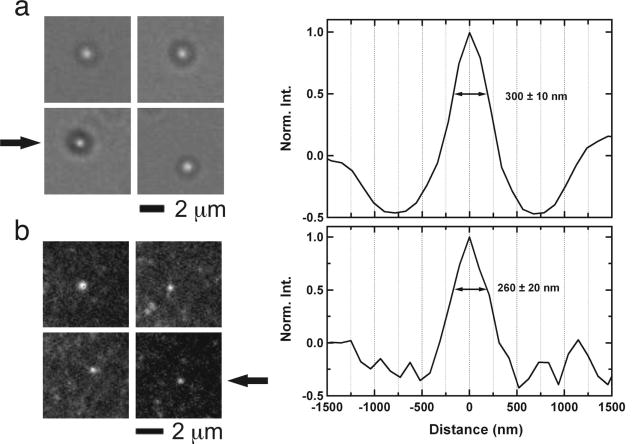
Once the vesicles are prepared with trapped molecules inside, they can readily be immobilized as described above (see section 2.2, Fig. 3e). To ensure that vesicles were properly formed, they can be studied by dynamic light scattering (DLS); for instance, when we extruded vesicles with a 200 nm pore size filter, we obtained vesicles with an average size of 151 ± 27 nm that were reasonably homogenous (polydispersity index of 0.166 ± 0.045). In addition, vesicle formation can be confirmed using brightfield microscopy (Fig. 5a) or using fluorescence microscopy if vesicles contain rhodamine-labeled lipids (Fig. 5b).
Fig. 5.
Microscopy images of vesicles extruded with 200 nm pore size membranes. (a) Brightfield images of 4 vesicles (left panel). The black arrow indicates the vesicle shown as a profile plot (right panel) with the indicated width of a Gaussian fit. Due to the physical properties of vesicles and/or the resolution limit of the microscope, the vesicles appear as a bright circle surrounded by a dark ring. For these reasons, vesicle images may not accurately reflect vesicle size. (b) Fluorescent images of 4 vesicles that contain rhodamine-labeled lipid (1,2-dipalmitoyl-sn- glycerol-3-phosphoethanolamine-N-(lissamine rhodamine B sulfonyl) (ammonium salt) from Avanti Polar Lipids). The black arrow indicates the vesicle shown as a profile plot (right panel) with the indicated width of a Gaussian fit. Again, the images may not accurately reflect vesicle size due to resolution limits of the microscope.
3. Applications
Both approaches, slide passivation using PEG and molecule encapsulation using lipid vesicles, have been extensively applied to study numerous systems including DNA, RNA and proteins. Here, we review some of these experiments to showcase the wide range of systems that become accessible to smFRET experiments when using the described surface passivation and immobilization techniques.
3.1. RNA-protein interactions
PEG-passivated slides have been used to characterize different RNP complexes by smFRET such as, the ribosome, telomerase, group I introns, reverse transcriptase (RNA sequencing) and alternative splicing regulators among others (5, 16, 44, 47–49). Among these, the ribosome is likely one of the most challenging system because of its unusually large size (2.5-megadalton) and the large number of proteins (>50) necessary in functional ribosomes (50); however, the vast number of components provides many potential sites for FRET pairs that can monitor different types of conformational changes (5, 9, 51–53).
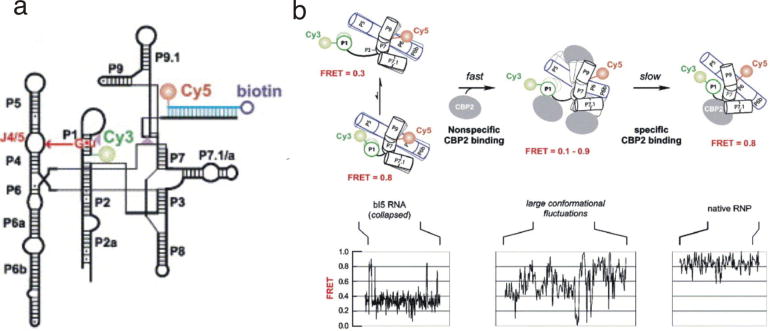
A recent application of PEGylated slides examined a classic example of a protein that promotes RNA folding, the autocatalytic group I intron in bI5 and its cofactor CBP2. Biochemical experiments have shown that CBP2 facilitates bI5 folding through tertiary structure capture, by binding and stabilizing transiently formed native bI5 (54); however, recent single molecule experiments using PEGylated slides have revealed that CBP2 actually acts through a two-step mechanism (47). In these experiments, the conformational dynamics of bI5 were monitored by attaching the fluorophores through hybridized oligos at two positions that were chosen based on previous characterization of this intron (47). In the absence of the protein, the RNA collapses to a 0.3 FRET state and makes transient excursions to a 0.8 FRET state with native-like features (Fig. 6). In the presence of CPB2, fast, non-specific binding occurs first. In these complexes, CBP2 promotes large conformational changes characterized by rapid transitions between 0.1 and 0.9 FRET states in the single molecule FRET trajectories (Fig. 6). In fact, some of these states are not accessible to the RNA alone. The second step is very slow and specific binding of CBP2 stabilizes the native state of this intron through tertiary structure capture, which results in a long lived native species with a 0.8 FRET ratio (Fig. 6). Here, single-molecule experiments that required PEG-passivated slides revealed new and important features of a protein-facilitated RNA-folding pathway.
Fig. 6.
Single molecule study of the bI5 group I intron and its folding dynamics in the presence of CBP2. (a) The secondary structure of the bI5 group I intron showing positions of Cy3, Cy5, and biotin. (b) The proposed two-step model for the formation of bI5-CBP2 complex (upper panel) and the respective single molecule FRET trajectories (lower panel). In the absence of the protein (left), the RNA collapses to a 0.3 FRET state and makes transient excursions to a 0.8 FRET state with native-like features. In the presence of CPB2, a rapid and non-specific binding occurs first, which cause a large conformational fluctuation as shown by the single molecule FRET trajectories (middle). Finally, the slow and specific binding of CBP2 protein to RNA forms a stable (0.8 FRET state) and catalytically active CBP2-bI5 complex (right). This figure was reprinted from (47) with permission from Elsevier.
3.2. DNA-protein interactions
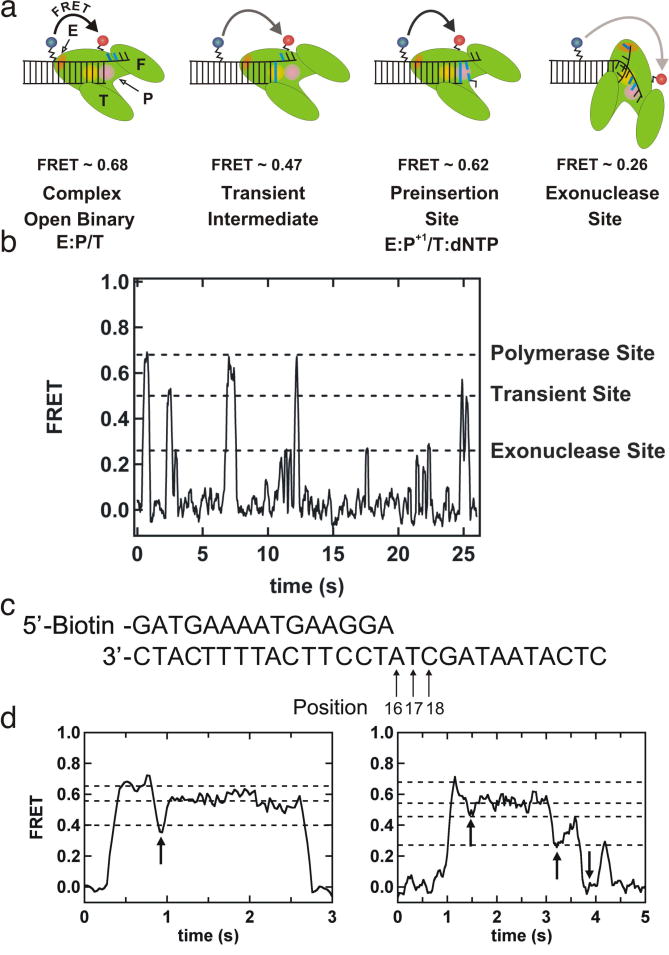
PEG-passivated slides have been used to study several DNA-protein systems including DNA helicases, RecA, DNA polymerase, and DNA sequencing (3, 14, 15, 26, 55). Recently, Christian et al. presented a study of nucleotide incorporation by DNA polymerase I with single base pair resolution (3). In this work, a biotinylated DNA primer hybridized to a Cy3 labeled DNA template was immobilized on a PEG passivated slide surface and Cy5 labeled Klenow Fragment (KF; an active truncated form of polymerase I, Fig. 7a) was injected into the slide chamber with a combination of dTTP, dATP and dGTP. This experiment allowed monitoring the movement of the polymerase on the DNA during the addition of up to three nucleotides to the primer template in real time. The DNA-polymerase dynamics showed distinct 4 states on the basis of FRET values observed during addition of a single nucleotide (Fig. 7a and b). The very first state, polymerase bound to nascent primer template complex, has a high FRET value (~0.68). A transient intermediate state formed during incorporation of a nucleotide has a FRET value of ~0.47. When the polymerase returns to the pre-insertion site, it has a FRET value of ~0.62. Finally, a very low FRET state (~0.26) is assigned to the movement of the primer terminus to the exonuclease site (Fig. 7a and b).
Fig. 7.
Single molecule study of single nucleotide incorporation by a DNA polymerase. (a) Schematic representation of DNA polymerase dynamics showing four different steps. The corresponding FRET values are indicated. F- fingers, P- palm T- thumb, and E- exonuclease (b) A FRET time trace illustrating the different states of the polymerase-bound primer-template complex. The polymerase, transient and exonuclease sites are marked according to their FRET values. (c) A 15-mer-primer template duplex showing the positions of the three products with arrows. (d) FRET trajectory showing the single nucleotide (dTTP) incorporation in the left and three-nucleotide incorporation (dTTP, dATP and dGTP) in the right. Arrows indicate the times at which a nucleotide is being incorporated. This figure is reprinted from (3) with permission.
The real-time polymerization dynamics with single base pair resolution was characterized for one to three incorporation events (Fig. 7d). All time traces began with the polymerase bound to the template (~0.68 FRET). The FRET time trajectories showed incorporation of single nucleotide dTTP (drop to ~0.4 FRET) within 0.83 s followed by return to the pre-insertion site (~0.62 FRET; Fig. 7d, left). When the first three nucleotides (dTTP, dATP and dGTP) were added, a sequential drop in FRET was observed from ~0.68 to ~0.23 as each position was incorporated (Fig. 7d, right). The rate constants of incorporation of dTTP, dATP, and dGTP were found to be comparable so that the polymerase had identical translocation times for each incorporation. Here, single-molecule experiments that were only possible using PEGylated slides have provided a new level of detail about DNA polymerase activity.
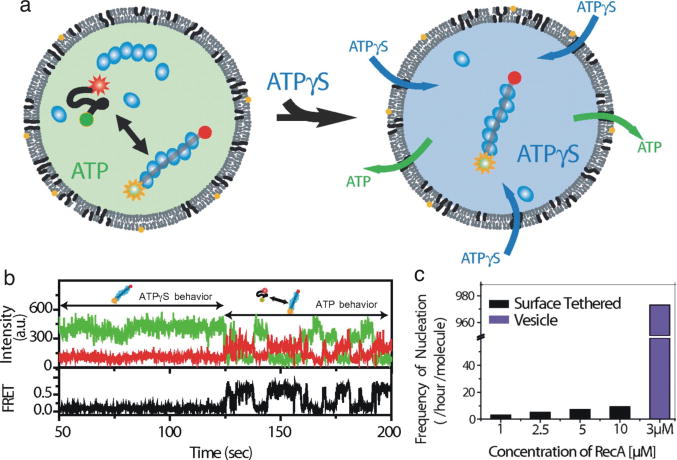
Lipid vesicles have been used to investigate nucleic acid and protein folding (30, 31, 56, 57) and have shown that, in those cases, single-molecule studies were not biased by surface effects (30, 56). The application of lipid vesicles to single-molecule experiments was expanded with the introduction of porous lipid vesicles (45). A porous vesicle can be created using lipids that have a transition temperature near the experimental temperature, such that transient pores are formed. Alternatively, certain bacterial toxins can be used to make porous vesicle (46). Porous vesicles allow exchange of conditions so that a molecule’s response to changes in, for instance, pH, magnesium concentration, or ATP can be directly observed. Porous vesicles have been used to study RNA folding and DNA-protein systems such as RecA/ssDNA and Rep helicase acting on DNA (45, 46). In the study of RecA assembly and disassembly on ssDNA, Cisse et al. were able to use porous vesicles to examine the effects of ATP, and the non-hydrolysable analog ATPγS, at the single-molecule level (Fig. 8a). The doubly labeled ssDNA produced a high FRET signal when free (~0.6), and a low FRET signal when bound by an assembled RecA filament (~0.1); in the presence of ATP, the RecA filament dynamically assembled and disassembled but in the presence of ATPγS the filament did not disassemble and was static in the low FRET state (Fig. 8b).
Fig. 8.
Single-molecule studies of vesicle-encapsulated RecA and ssDNA. (a) This model depicts RecA filament assembly and disassembly on ssDNA in the presence of ATP. Upon addition of ATPγS, the ATP is displaced and the RecA filament is stably assembled. (b) A single-molecule time trace of an encapsulated ssDNA with RecA. In the presence of ATPγS, the low FRET state persists. As ATP displaces ATPγS, the system becomes dynamic, transitioning between the high and low FRET states. (c) The frequency of reassembly of RecA filaments at various concentrations using surface tethered DNA compared to that in lipid vesicles. This figure was reprinted from (45) and is copyrighted to the National Academy of Sciences.
Curiously, however, the authors noted that in the presence of ATP, the frequency of reassembly of the filament was much higher in a vesicle than using surface tethered molecules (Fig. 8c). They attribute this effect to confinement within the vesicle and suggest that partially assembled RecA filaments that dissociate from DNA generally diffuse away using a surface tethered set up such that each nucleation event begins with monomers. However, when confined in a vesicle, partially formed filaments can reassociate with ssDNA (45). In fact, they compare the effect of vesicle encapsulation to the proposed effects of molecular crowding or compartmentalization thought to be used in vivo to facilitate reactions and interactions. Here the authors have shown that RecA has unique activities in vesicles.
3.3. Protein-Protein Interactions
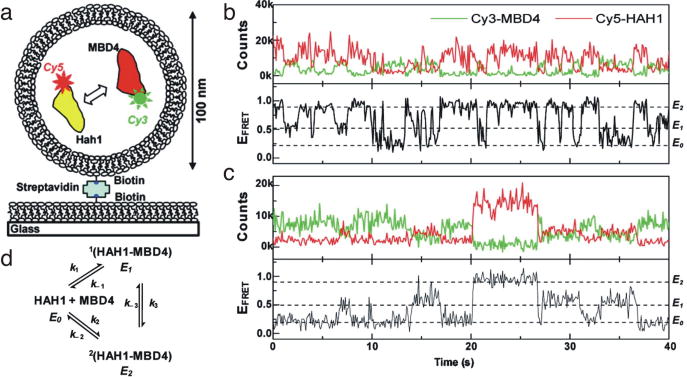
Recently, lipid vesicles were employed to study relatively weak, transient protein-protein interactions between the copper chaperone Hah1 and its target, a metal binding domain (MBD4) of Wilson’s Disease Protein (WDP) (Fig. 9a) (58). Benitez et al. were able to observe two transiently bound states with different FRET ratios (E1 ~ 0.5, E2 ~ 0.9) that can interconvert and quantify all rate constants for the binding scheme (Fig. 9b,c). Indeed, both conformations of the dimers have KDs in the micromolar range (3.9 ± 0.6 and 6.0 ± 1 μM, respectively), concentrations that are readily accessible at the single-molecule level with vesicles (58). They hypothesize that the presence of two bound states could increase the probability of a productive binding event in vivo, or might suggest that Hah1 has the capacity to bind two metal binding domains of its target protein (58). Here, the authors have used vesicles to study a biologically important protein-protein interaction that was too transient to be quantitatively measured in bulk assays, and during their studies revealed not one, but two conformationally distinct bound states.
Fig. 9.
Single-molecule study of Hah1-MBD4 interactions. (a) Cy3-MBD4 and Cy5-Hah1 were encapsulated in 100 nm vesicles and immobilized to the slide. (b) Time traces from two individual vesicles that each contain one Cy3-MBD4 and one Cy5-Hah1. E0, ~0.2 FRETunbound state. E1, ~ 0.5 FRET bound state. E2, ~ 0.9 FRET bound state. (c) Hah1/MBD4 binding schematic. The determined rate constants are: k1 = 4.7 ± 0.7 x 10⁵ M−1s−1, k−1 = 1.8 ± 0.1 s−1, k2 = 2.5 ± 0.4 x 10⁵ M−1s−1, k−2 = 1.5 ± 0.1 s−1, k3 = 1.4 ± 0.2 s−1, k−.3 = 2.4 ± 0.3 s−1. Reprinted from (58) with permission from JACS.
4. Concluding remarks
In summary, single-molecule FRET with surface immobilized biopolymers offers the unique capability to study and characterize biomolecular interactions over long time scales with unprecedented detail because of it removes ensemble averaging and the requirement to synchronize reactions. However, there is an important caveat. Non-specific interactions between the molecules and the surface could alter the molecules’ behavior. To study RNA, DNA and/or protein folding and interactions, especially when proteins are involved, it is therefore necessary to minimize such interactions. This can be accomplished, for instance, by passivating the surface with PEG or by isolating the molecules in lipid vesicles. Here, we have described detailed protocols that make these methods easily accessible to those interested in studying systems with components that may interact with the slide, such as protein-nucleic acid interactions, at the single molecule level, and we have briefly reviewed a number of recent studies that illustrate how these protocols are applied.
Acknowledgments
We would like to thank Dr. Peter Cornish for detailed advice in creating a protocol for forming lipid vesicles. Dr. Christine Chow provided rhodamine-lableled lipid. Dr. Elvin Aléman and Rui Zhao acted as technical resources. D.R. is supported by the National Science Foundation (NSF CAREER award 0747285) and the National Institutes of Health (R01GM085116).
Footnotes
Publisher's Disclaimer: This is a PDF file of an unedited manuscript that has been accepted for publication. As a service to our customers we are providing this early version of the manuscript. The manuscript will undergo copyediting, typesetting, and review of the resulting proof before it is published in its final citable form. Please note that during the production process errors may be discovered which could affect the content, and all legal disclaimers that apply to the journal pertain.
References
- 1.Abbondanzieri EA, Greenleaf WJ, Shaevitz JW, Landick R, Block SM. Nature. 2005;438:460–5. doi: 10.1038/nature04268. [DOI] [PMC free article] [PubMed] [Google Scholar]
- 2.Herbert KM, Greenleaf WJ, Block SM. Annu Rev Biochem. 2008;77:149–76. doi: 10.1146/annurev.biochem.77.073106.100741. [DOI] [PMC free article] [PubMed] [Google Scholar]
- 3.Christian TD, Romano LJ, Rueda D. Proc Natl Acad Sci U S A. 2009;106:21109–14. doi: 10.1073/pnas.0908640106. [DOI] [PMC free article] [PubMed] [Google Scholar]
- 4.Sorokina M, Koh HR, Patel SS, Ha T. J Am Chem Soc. 2009;131:9630–1. doi: 10.1021/ja902861f. [DOI] [PMC free article] [PubMed] [Google Scholar]
- 5.Blanchard SC, Gonzalez RL, Kim HD, Chu S, Puglisi JD. Nat Struct Mol Biol. 2004;11:1008–14. doi: 10.1038/nsmb831. [DOI] [PubMed] [Google Scholar]
- 6.Crawford DJ, Hoskins AA, Friedman LJ, Gelles J, Moore MJ. RNA. 2008;14:170–9. doi: 10.1261/rna.794808. [DOI] [PMC free article] [PubMed] [Google Scholar]
- 7.Steiner M, Karunatilaka KS, Sigel RK, Rueda D. Proc Natl Acad Sci U S A. 2008;105:13853–8. doi: 10.1073/pnas.0804034105. [DOI] [PMC free article] [PubMed] [Google Scholar]
- 8.Guo Z, Karunatilaka KS, Rueda D. Nat Struct Mol Biol. 2009;16:1154–9. doi: 10.1038/nsmb.1672. [DOI] [PMC free article] [PubMed] [Google Scholar]
- 9.Cornish PV, Ermolenko DN, Staple DW, Hoang L, Hickerson RP, Noller HF, Ha T. Proc Natl Acad Sci U S A. 2009;106:2571–6. doi: 10.1073/pnas.0813180106. [DOI] [PMC free article] [PubMed] [Google Scholar]
- 10.Funatsu T, Harada Y, Tokunaga M, Saito K, Yanagida T. Nature. 1995;374:555–9. doi: 10.1038/374555a0. [DOI] [PubMed] [Google Scholar]
- 11.Yildiz A, Forkey JN, McKinney SA, Ha T, Goldman YE, Selvin PR. Science. 2003;300:2061–5. doi: 10.1126/science.1084398. [DOI] [PubMed] [Google Scholar]
- 12.Kaufmann BB, van Oudenaarden A. Curr Opin Genet Dev. 2007;17:107–12. doi: 10.1016/j.gde.2007.02.007. [DOI] [PubMed] [Google Scholar]
- 13.Elf J, Li GW, Xie XS. Science. 2007;316:1191–4. doi: 10.1126/science.1141967. [DOI] [PMC free article] [PubMed] [Google Scholar]
- 14.Harris TD, Buzby PR, Babcock H, Beer E, Bowers J, Braslavsky I, Causey M, Colonell J, Dimeo J, Efcavitch JW, Giladi E, Gill J, Healy J, Jarosz M, Lapen D, Moulton K, Quake SR, Steinmann K, Thayer E, Tyurina A, Ward R, Weiss H, Xie Z. Science. 2008;320:106–9. doi: 10.1126/science.1150427. [DOI] [PubMed] [Google Scholar]
- 15.Eid J, Fehr A, Gray J, Luong K, Lyle J, Otto G, Peluso P, Rank D, Baybayan P, Bettman B, Bibillo A, Bjornson K, Chaudhuri B, Christians F, Cicero R, Clark S, Dalal R, Dewinter A, Dixon J, Foquet M, Gaertner A, Hardenbol P, Heiner C, Hester K, Holden D, Kearns G, Kong X, Kuse R, Lacroix Y, Lin S, Lundquist P, Ma C, Marks P, Maxham M, Murphy D, Park I, Pham T, Phillips M, Roy J, Sebra R, Shen G, Sorenson J, Tomaney A, Travers K, Trulson M, Vieceli J, Wegener J, Wu D, Yang A, Zaccarin D, Zhao P, Zhong F, Korlach J, Turner S. Science. 2009;323:133–8. doi: 10.1126/science.1162986. [DOI] [PubMed] [Google Scholar]
- 16.Ozsolak F, Platt AR, Jones DR, Reifenberger JG, Sass LE, McInerney P, Thompson JF, Bowers J, Jarosz M, Milos PM. Nature. 2009;461:814–8. doi: 10.1038/nature08390. [DOI] [PubMed] [Google Scholar]
- 17.Ha T. Methods. 2001;25:78–86. doi: 10.1006/meth.2001.1217. [DOI] [PubMed] [Google Scholar]
- 18.Roy R, Hohng S, Ha T. Nat Methods. 2008;5:507–16. doi: 10.1038/nmeth.1208. [DOI] [PMC free article] [PubMed] [Google Scholar]
- 19.Walter NG, Huang CY, Manzo AJ, Sobhy MA. Nat Methods. 2008;5:475–89. doi: 10.1038/nmeth.1215. [DOI] [PMC free article] [PubMed] [Google Scholar]
- 20.Zhao R, Rueda D. Methods. 2009 doi: 10.1016/j.ymeth.2009.04.017. [DOI] [PubMed] [Google Scholar]
- 21.Stryer L, Haugland RP. Proc Natl Acad Sci U S A. 1967;58:719–26. doi: 10.1073/pnas.58.2.719. [DOI] [PMC free article] [PubMed] [Google Scholar]
- 22.Aleman EA, Pedini HS, Rueda D. Chembiochem. 2009;10:2862–6. doi: 10.1002/cbic.200900640. [DOI] [PMC free article] [PubMed] [Google Scholar]
- 23.Zhuang X. Annu Rev Biophys Biomol Struct. 2005;34:399–414. doi: 10.1146/annurev.biophys.34.040204.144641. [DOI] [PubMed] [Google Scholar]
- 24.Rueda D, Walter NG. J Nanosci Nanotechnol. 2005;5:1990–2000. doi: 10.1166/jnn.2005.505. [DOI] [PubMed] [Google Scholar]
- 25.Rasnik I, McKinney SA, Ha T. Acc Chem Res. 2005;38:542–8. doi: 10.1021/ar040138c. [DOI] [PubMed] [Google Scholar]
- 26.Ha T, Rasnik I, Cheng W, Babcock HP, Gauss GH, Lohman TM, Chu S. Nature. 2002;419:638–41. doi: 10.1038/nature01083. [DOI] [PubMed] [Google Scholar]
- 27.Cha T, Guo A, Zhu XY. Proteomics. 2005;5:416–9. doi: 10.1002/pmic.200400948. [DOI] [PubMed] [Google Scholar]
- 28.del Rio A, Perez-Jimenez R, Liu R, Roca-Cusachs P, Fernandez JM, Sheetz MP. Science. 2009;323:638–41. doi: 10.1126/science.1162912. [DOI] [PMC free article] [PubMed] [Google Scholar]
- 29.Delanoe-Ayari H, Al Kurdi R, Vallade M, Gulino-Debrac D, Riveline D. Proc Natl Acad Sci U S A. 2004;101:2229–34. doi: 10.1073/pnas.0304297101. [DOI] [PMC free article] [PubMed] [Google Scholar]
- 30.Okumus B, Wilson TJ, Lilley DM, Ha T. Biophys J. 2004;87:2798–806. doi: 10.1529/biophysj.104.045971. [DOI] [PMC free article] [PubMed] [Google Scholar]
- 31.Rhoades E, Gussakovsky E, Haran G. Proc Natl Acad Sci U S A. 2003;100:3197–202. doi: 10.1073/pnas.2628068100. [DOI] [PMC free article] [PubMed] [Google Scholar]
- 32.Smiley RD, Zhuang Z, Benkovic SJ, Hammes GG. Biochemistry. 2006;45:7990–7. doi: 10.1021/bi0603322. [DOI] [PMC free article] [PubMed] [Google Scholar]
- 33.Kartalov EP, Unger MA, Quake SR. Biotechniques. 2003;34:505–10. doi: 10.2144/03343st02. [DOI] [PubMed] [Google Scholar]
- 34.Heyes CD, Groll J, Moller M, Nienhaus GU. Mol Biosyst. 2007;3:419–30. doi: 10.1039/b700055n. [DOI] [PubMed] [Google Scholar]
- 35.Nienhaus GU. Protein Structure, Stability, and Interaction. Vol. 490. Humana; 2009. pp. 311–37. [Google Scholar]
- 36.Zhuang X, Bartley LE, Babcock HP, Russell R, Ha T, Herschlag D, Chu S. Science. 2000;288:2048–51. doi: 10.1126/science.288.5473.2048. [DOI] [PubMed] [Google Scholar]
- 37.Rueda D, Bokinsky G, Rhodes MM, Rust MJ, Zhuang X, Walter NG. Proc Natl Acad Sci U S A. 2004;101:10066–71. doi: 10.1073/pnas.0403575101. [DOI] [PMC free article] [PubMed] [Google Scholar]
- 38.Chaiet L, Wolf FJ. Arch Biochem Biophys. 1964;106:1–5. doi: 10.1016/0003-9861(64)90150-x. [DOI] [PubMed] [Google Scholar]
- 39.Proudnikov D, Mirzabekov A. Nucleic Acids Res. 1996;24:4535–42. doi: 10.1093/nar/24.22.4535. [DOI] [PMC free article] [PubMed] [Google Scholar]
- 40.Newby Lambert M, Vocker E, Blumberg S, Redemann S, Gajraj A, Meiners JC, Walter NG. Biophys J. 2006;90:3672–85. doi: 10.1529/biophysj.105.067793. [DOI] [PMC free article] [PubMed] [Google Scholar]
- 41.Rasnik I, McKinney SA, Ha T. Nat Methods. 2006;3:891–3. doi: 10.1038/nmeth934. [DOI] [PubMed] [Google Scholar]
- 42.Vogelsang J, Kasper R, Steinhauer C, Person B, Heilemann M, Sauer M, Tinnefeld P. Angew Chem Int Ed Engl. 2008;47:5465–9. doi: 10.1002/anie.200801518. [DOI] [PubMed] [Google Scholar]
- 43.Cordes T, Vogelsang J, Tinnefeld P. J Am Chem Soc. 2009;131:5018–9. doi: 10.1021/ja809117z. [DOI] [PubMed] [Google Scholar]
- 44.Stone MD, Mihalusova M, O’Connor MC, Prathapam R, Collins K, Zhuang X. Nature. 2007;446:458–61. doi: 10.1038/nature05600. [DOI] [PMC free article] [PubMed] [Google Scholar]
- 45.Cisse I, Okumus B, Joo C, Ha T. Proc Natl Acad Sci U S A. 2007;104:12646–50. doi: 10.1073/pnas.0610673104. [DOI] [PMC free article] [PubMed] [Google Scholar]
- 46.Okumus B, Arslan S, Fengler SM, Myong S, Ha T. J Am Chem Soc. 2009;131:14844–9. doi: 10.1021/ja9042356. [DOI] [PMC free article] [PubMed] [Google Scholar]
- 47.Bokinsky G, Nivon LG, Liu S, Chai G, Hong M, Weeks KM, Zhuang X. J Mol Biol. 2006;361:771–84. doi: 10.1016/j.jmb.2006.06.048. [DOI] [PMC free article] [PubMed] [Google Scholar]
- 48.Lamichhane R, Daubner GM, Thomas-Crusells J, Auweter SD, Manatchal C, Austin KS, Valniuk O, Allain FT, Rueda D. Proc Natl Acad Sci U S A. 2010 doi: 10.1073/pnas.0907072107. In Press. [DOI] [PMC free article] [PubMed] [Google Scholar]
- 49.Lamichhane R, Daubner GM, Thomas-Crusells J, Auweter SD, Manatschal C, Austin KS, Valniuk O, Allain FH, Rueda D. Proc Natl Acad Sci U S A. 2010;107:4105–10. doi: 10.1073/pnas.0907072107. [DOI] [PMC free article] [PubMed] [Google Scholar]
- 50.Schmeing TM, Ramakrishnan V. Nature. 2009;461:1234–42. doi: 10.1038/nature08403. [DOI] [PubMed] [Google Scholar]
- 51.Blanchard SC, Kim HD, Gonzalez RL, Jr, Puglisi JD, Chu S. Proc Natl Acad Sci U S A. 2004;101:12893–8. doi: 10.1073/pnas.0403884101. [DOI] [PMC free article] [PubMed] [Google Scholar]
- 52.Frank J, Agrawal RK. Nature. 2000;406:318–22. doi: 10.1038/35018597. [DOI] [PubMed] [Google Scholar]
- 53.Cornish PV, Ermolenko DN, Noller HF, Ha T. Mol Cell. 2008;30:578–88. doi: 10.1016/j.molcel.2008.05.004. [DOI] [PMC free article] [PubMed] [Google Scholar]
- 54.Weeks KM, Cech TR. Science. 1996;271:345–8. doi: 10.1126/science.271.5247.345. [DOI] [PubMed] [Google Scholar]
- 55.Roy R, Kozlov AG, Lohman TM, Ha T. Nature. 2009;461:1092–7. doi: 10.1038/nature08442. [DOI] [PMC free article] [PubMed] [Google Scholar]
- 56.Lee JY, Okumus B, Kim DS, Ha T. Proc Natl Acad Sci U S A. 2005;102:18938–43. doi: 10.1073/pnas.0506144102. [DOI] [PMC free article] [PubMed] [Google Scholar]
- 57.Rhoades E, Cohen M, Schuler B, Haran G. J Am Chem Soc. 2004;126:14686–7. doi: 10.1021/ja046209k. [DOI] [PubMed] [Google Scholar]
- 58.Benitez JJ, Keller AM, Ochieng P, Yatsunyk LA, Huffman DL, Rosenzweig AC, Chen P. J Am Chem Soc. 2008;130:2446–7. doi: 10.1021/ja7107867. [DOI] [PMC free article] [PubMed] [Google Scholar]


