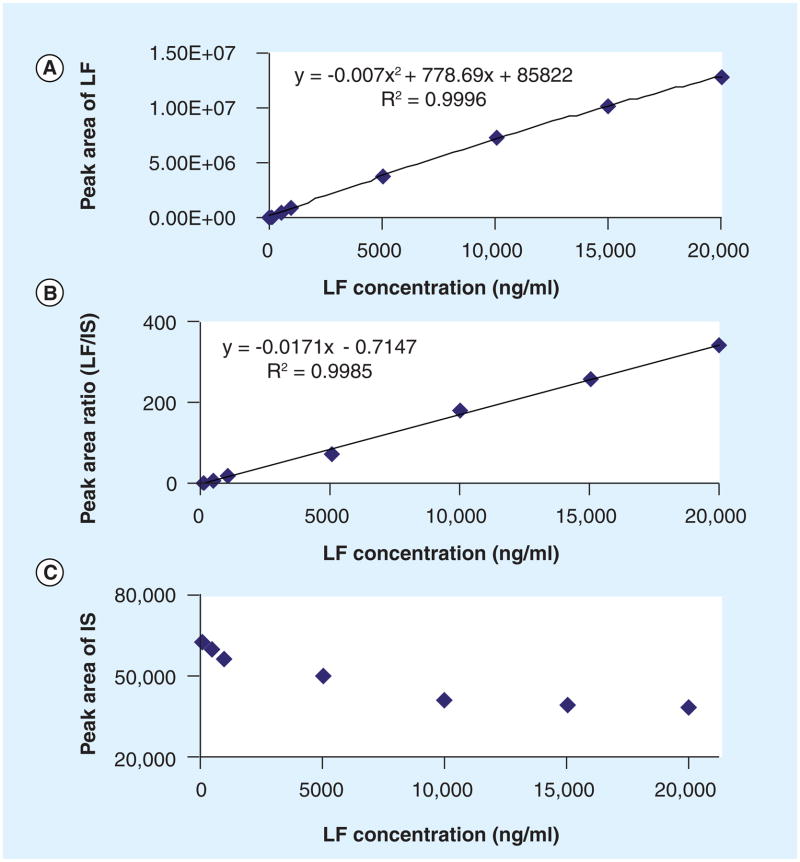
Figure 2. Calibration standard curves with and without deuterated internal standard.
(A) No IS, calibration curve fitted with 1/× weighted quadratic regression. (B) Deuterated LF (LF-D9) as the IS, calibration curve fitted with 1/× weighted linear regression. (C) IS signal intensity at the different calibrator concentrations. The LF-D9 signal decreased at higher LF concentration, indicating signal saturation at the high end of calibrators. The ratio of LF/LF-D9 still increased in a linear mode.
LF: Lumefantrine; IS: Internal standard.

