Abstract
Many pharmacogenetic studies fail to yield any statistically significant associations. Such negative findings may be due to the absence of, or inadequate statistical power to test for, an effect at the genetic variants tested. In many instances, sample sizes are small, making it unclear how to interpret the absence of statistically significant findings. We demonstrate that the amount of information that can be drawn from a negative study is improved by incorporating statistical power and the added context of well-validated pharmacogenetic effects into the interpretation process. This approach permits clearer inferences to be made about the possible range of genetic effects that may be present in, or are likely absent from, small drug studies.
Keywords: adverse drug reaction, pharmacogenetics, pharmacokinetics, statistical inference, statistical power
Many pharmacogenetic studies result in negative findings, such that no statistically significant associations are observed between genetic variants and phenotype. Reasons for negative findings include absence of a genetic effect, not measuring the causal variant, or low power due to small sample sizes, small effect sizes or genetic heterogeneity.1 Interpretation guidelines for negative findings are available for classical clinical studies.2, 3 However, pharmacogenetic studies often differ from other clinical studies by being very exploratory and investigating a large number of variants.4 Nevertheless, we now have a number of well-validated pharmacogenetic effects, which allow us to assess the informativeness of a negative finding by assessing power to detect associations with these validated effects. We propose a strategy for interpretation that supports stronger inferences about the possible range of genetic effects that may be present, but unobserved, in a study. We illustrate our approach by evaluating the negative findings from three studies.
A central question to address is what additional information, aside from failure to reject the null hypothesis of no association between measured genotypes and phenotype, can be drawn from a negative finding. Most genetic studies base their inference primarily on P-values. Such an approach is not without disadvantages. Criticisms of using P-values for inference include the inability to judge the relative probabilities of the null or alternative hypotheses given the data, the abrupt and false dichotomy between significant and not significant, the impact of sample size on the interpretation, and the dependence of power on minor allele frequency.5, 6 One way to address these shortcomings is to adopt a Bayesian approach, such as estimating the posterior probability of association.6 Other useful tools include confidence intervals for effect size and the careful investigation of power to determine what effect sizes could be detected from the study at hand and, thus, what effects sizes can be confidently excluded.
Additional inference can be drawn from negative studies by placing upon the graph points corresponding to well-known pharmacogenetic effect sizes associated with various medicines and clinical outcomes4, 7, 8, 9, 10, 11, 12, 13, 14 (Supplementary Tables 1 and 2) over the power curves for selected levels (see Statistical Methods in Supplementary Material). We can use power levels to differentiate the kind of effects we are likely to miss (e.g., power of 5%), have a reasonable chance of missing (50%) and are very unlikely to miss (95%). By adding the 95% simultaneous confidence intervals of effects estimated for each variant tested, we can assess the range of plausible effects given the observed data.
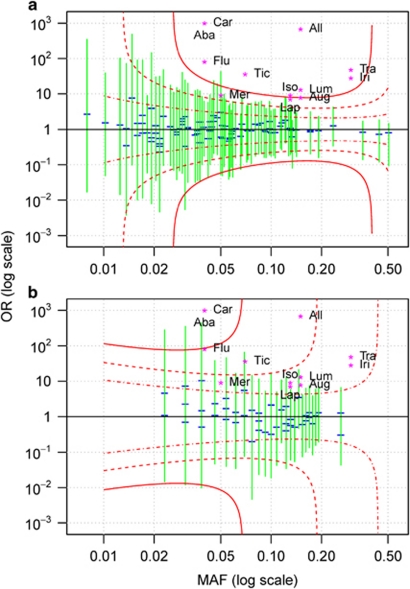
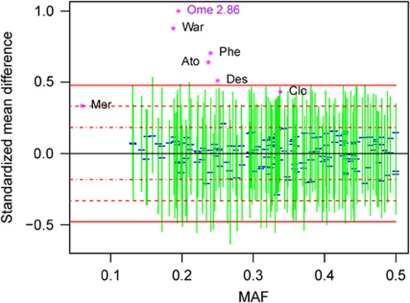
We demonstrate this power-based approach to interpretation using three examples selected from recent studies we have conducted. The first example is based on a pharmacogenetic study of pazopanib-related liver enzyme elevation, consisting of the analysis of 48 cases and 94 controls.15 For the given sample size, the effect sizes for almost all well-established adverse drug reactions lie above the 95% power curve (Figure 1a). Consequently, rejection would have been very likely if similar effects were present among the genetic variants tested. The second example illustrates our method for severe cutaneous adverse reactions in patients who received lamotrigine,11 consisting of 10 cases and 43 controls (Figure 1b). These power curves indicate that only the largest reported effects could be confidently ruled out. The third example is modeled after a pharmacokinetic study investigating drug exposure in 129 subjects (Figure 2). As in the first example, we can confidently exclude the presence of effect sizes observed for most large pharmacokinetic effects. We also applied the Bayesian posterior probability of association to these studies (data not shown). We did not find this measure to provide much additional insight beyond the confidence intervals.
Figure 1.
Power at a type I error of 5 × 10⁻⁴ (simultaneous testing of 100 variants) for pazopanib (a) and lamotrigine (b) studies investigating whether selected human leukocyte antigen genotypes are associated with adverse drug reactions. Data-derived features presented in the plot are the estimated odds ratios (OR; blue horizontal segments) for individual variants, their 95% simultaneous confidence intervals (green) and red power curves corresponding to 95% (solid), 50% (dashed) and 5% (dash-dotted) power. ORs for drugs with well-known pharmacogenetic effects4, 11, 12, 13, 14 are plotted as magenta star characters with the following abbreviations: Aba, Abacavir; Aug Augmentin; All, Allopurinol; Car, Carbamazepine; Flu, Flucloxacillin; Iri, Irinotecan; Iso, Isoniazid; Lap, Lapatinib; Lum, Lumiracoxib; Mer, Mercaptopurine; Tic, Ticlopidine; Tra, Tranilast.
Figure 2.
Power at a type I error of 5 × 10⁻⁴ for a pharmacogenetic investigation of pharmacokinetic variation. Effect size measure is standardized mean difference, described in Online Methods. Drug abbreviations are as follows: Ato, Atomoxetine; Clo, Clopidogrel; Des, Desipramine; Mer, Mercaptopurine; Ome, Omeprazole; Phe, Phenytoin; War, Warfarin. See the legend to Figure 1 for further details.
The combination of power curves, observed effects and examples of well-known effects can help researchers to draw meaningful information about potential pharmacogenetic effects from otherwise ambiguous results. Most of this information is derived from the magnitude of the effects that are likely to be rejected by the study. As expected, the information in a negative study depends strongly on the sample size. For larger negative studies, we can exclude a large part of the effect size space, including most well-known effect sizes with demonstrated clinical utility. Such negative studies are informative, because they confidently exclude the existence of large effects at the measured variants. On the other hand, for a small study, we might have sufficient power to exclude only the largest possible effect sizes, and little power to exclude most known effects. Consequently, the information gained from such a negative finding is low, and researchers should be cautious drawing any conclusions. Although for illustration purposes we used the power curves method retrospectively, this method would provide maximal benefit when used in the experiment design stage. At this stage, the power curves can be produced to inform the researchers about the kinds of effects that could be detected and rejected in a proposed study. On the basis of estimated power for well-known effects, scientists will be better able to predict the possible consequences of the proposed genetic study.
The authors declare no conflict of interest.
Footnotes
Supplementary Information accompanies the paper on the The Pharmacogenomics Journal website (http://www.nature.com/tpj)
Supplementary Material
References
- McClellan J, King MC. Genomic analysis of mental illness: a changing landscape. JAMA. 2010;303:2523–2524. doi: 10.1001/jama.2010.869. [DOI] [PubMed] [Google Scholar]
- Freedman KB, Bernstein J. Sample size and statistical power in clinical orthopaedic research. J Bone Joint Surg Am. 1999;81:1454–1460. doi: 10.2106/00004623-199910000-00011. [DOI] [PubMed] [Google Scholar]
- Motulsky H.Chapter 12. Interpreting nonsignificant P values Oxford University Press: Oxford; 1995 [Google Scholar]
- Nelson MR, Bacanu SA, Mosteller M, Li L, Bowman CE, Roses AD, et al. Genome-wide approaches to identify pharmacogenetic contributions to adverse drug reactions. Pharmacogenomics J. 2008;9:23–33. doi: 10.1038/tpj.2008.4. [DOI] [PubMed] [Google Scholar]
- Spiegelhalter DJ, Abrams KR, Myles JP. Comparison of Alternative Approaches to Inference. Bayesian Approaches to Clinical Trials and Health-Care Evaluation. John Wiley & Sons, Ltd: Chichester, UK; 2004. [Google Scholar]
- Wakefield J. A Bayesian measure of the probability of false discovery in genetic epidemiology studies. Am J Hum Genet. 2007;81:208–227. doi: 10.1086/519024. [DOI] [PMC free article] [PubMed] [Google Scholar]
- Desta Z, Zhao X, Shin JG, Flockhart DA. Clinical significance of the cytochrome P450 2C19 genetic polymorphism. Clin Pharmacokinet. 2002;41:913–958. doi: 10.2165/00003088-200241120-00002. [DOI] [PubMed] [Google Scholar]
- Furman KD, Grimm DR, Mueller T, Holley-Shanks RR, Bertz RJ, Williams LA, et al. Impact of CYP2D6 intermediate metabolizer alleles on single-dose desipramine pharmacokinetics. Pharmacogenetics. 2004;14:279–284. doi: 10.1097/00008571-200405000-00002. [DOI] [PubMed] [Google Scholar]
- Furuta T, Ohashi K, Kosuge K, Zhao XJ, Takashima M, Kimura M, et al. CYP2C19 genotype status and effect of omeprazole on intragastric pH in humans. Clin Pharmacol Ther. 1999;65:552–561. doi: 10.1016/S0009-9236(99)70075-5. [DOI] [PubMed] [Google Scholar]
- Huang YS, Chern HD, Su WJ, Wu JC, Chang SC, Chiang CH. Cytochrome P450 2E1 genotype and the susceptibility to antituberculosis drug-induced hepatitis. Hepatology. 2003;37:924–930. doi: 10.1053/jhep.2003.50144. [DOI] [PubMed] [Google Scholar]
- Kazeem GR, Cox C, Aponte J, Messenheimer J, Brazell C, Nelsen AC, et al. High-resolution HLA genotyping and severe cutaneous adverse reactions in lamotrigine-treated patients. Pharmacogenet Genomics. 2009;19:661–665. doi: 10.1097/FPC.0b013e32832c347d. [DOI] [PubMed] [Google Scholar]
- Sauer JM, Ring BJ, Witcher JW. Clinical pharmacokinetics of atomoxetine. Clin Pharmacokinet. 2005;44:571–590. doi: 10.2165/00003088-200544060-00002. [DOI] [PubMed] [Google Scholar]
- Uno T, Sugimoto K, Sugawara K, Tateishi T. The effect of CYP2C19 genotypes on the pharmacokinetics of warfarin enantiomers. J Clin Pharm Ther. 2008;33:67–73. doi: 10.1111/j.1365-2710.2008.00887.x. [DOI] [PubMed] [Google Scholar]
- Varenhorst C, James S, Erlinge D, Brandt JT, Braun OO, Man M, et al. Genetic variation of CYP2C19 affects both pharmacokinetic and pharmacodynamic responses to clopidogrel but not prasugrel in aspirin-treated patients with coronary artery disease. Eur Heart J. 2009;30:1744–1752. doi: 10.1093/eurheartj/ehp157. [DOI] [PMC free article] [PubMed] [Google Scholar]
- Xu CF, Reck BH, Goodman VL, Xue Z, Huang L, Barnes MR, et al. Association of the hemochromatosis gene with pazopanib-induced transaminase elevation in renal cell carcinoma. J Hepatol. 2011;54:1237–1243. doi: 10.1016/j.jhep.2010.09.028. [DOI] [PubMed] [Google Scholar]
Associated Data
This section collects any data citations, data availability statements, or supplementary materials included in this article.


