

Abstract
Regulating the transition of cells such as T lymphocytes from quiescence (G0) into an activated, proliferating state involves initiation of cellular programs resulting in entry into the cell cycle (proliferation), the growth cycle (blastogenesis, cell size) and effector (functional) activation. We show the first proteomic analysis of protein interaction networks activated during entry into the first cell cycle from G0. We also provide proof of principle that blastogenesis and proliferation programs are separable in primary human T cells. We employed a proteomic profiling method to identify large-scale changes in chromatin/nuclear matrix-bound and unbound proteins in human T lymphocytes during the transition from G0 into the first cell cycle and mapped them to form functionally annotated, dynamic protein interaction networks. Inhibiting the induction of two proteins involved in two of the most significantly upregulated cellular processes, ribosome biogenesis (eIF6) and hnRNA splicing (SF3B2/SF3B4), showed, respectively, that human T cells can enter the cell cycle without growing in size, or increase in size without entering the cell cycle.
Keywords: cell cycle, cell size, mass spectrometry, proteomics, T cells
Introduction
Quiescence (G0) is an actively maintained state (Liu, 2005) and quiescent cells, such as non-activated peripheral blood T cells do not contain many of the proteins necessary for cell proliferation (Thomas et al, 1998; Lea et al, 2003; reviewed in Thomas, 2004; Coller, 2007). For this reason, T cells entering the cell cycle for the first time take 32–40 h to enter S-phase as compared with the 25.6 h it takes actively cycling cells to complete one entire cell cycle (Lea et al, 2003). Presentation of antigen to a memory T cell by an antigen-presenting cell triggers signal transduction through the T-cell receptor (CD3) and co-stimulatory molecules such as CD28, which results in T-cell activation and clonal expansion (Acuto and Michel, 2003). Programs are thus initiated (van Leeuwen and Samelson, 1999; van Oers, 1999) that lead to T-cell proliferation, increase in cell size (blastogenesis) and the induction of effector molecules (activation), which include cytokines and cell surface receptors (Mosmann et al, 1986; Jain et al, 1995). We previously identified a G0 → G1 commitment point (CP) in primary human T cells that controls entry into the cell cycle from quiescence (Lea et al, 2003), which provided proof of principle that entry into the cell cycle and cellular growth cycle can be uncoupled from early expression of T-cell effector (activation) functions, such as production of IL-2, γ-IFN and cell surface CD69, CD44 and CD62L.
In order to expand upon this work, we sought to identify cellular pathways and regulatory proteins that are activated or repressed in primary human T cells as they enter the cell cycle for the first time. We focused our analyses on changes in proteins associated with chromatin and the nuclear matrix (C/NM), as these nuclear structures are likely to be involved in the direct regulation of a number of important processes. The nuclear matrix (reviewed in Nickerson, 2001) binds proteins that can form spatially distinct macromolecular complexes involved in transcription (Misteli, 2004; Zink et al, 2004), RNA splicing and transport, as well as DNA replication (Anachkova et al, 2005). However, dynamic changes in the composition of the C/NM-bound proteome during cell-cycle entry have not been characterized.
In the current study, we utilized a label-free mass spectrometry-based approach to identify C/NM-associated proteins, as well as unbound proteins that are regulated in primary human T cells as they enter the cell cycle. We report for the first time on the protein interaction networks that are regulated during this cell-cycle transition and identify both known and novel aspects of T-cell activation during cell-cycle entry. We show also that entry into the cell cycle and growth cycle can be separated in primary human T cells: the SF3B splicing factor is needed for entry into the cell cycle but not the growth cycle, whereas eIF6, which is involved in 60S ribosome biogenesis, regulates entry into the growth cycle but not the cell cycle. Our data provide proof of principle that entry into the cell cycle and growth cycle are separable and that human T cells can enter the cell cycle at a restricted size.
Results
Identification of chromatin/nuclear matrix-bound proteins in G0 and G1
To identify proteins that change during entry into the cell cycle, we used human non-activated, quiescent (G0) T cells from the peripheral blood of four normal donors, which have normal cellular mechanisms. We isolated near 100% non-activated, quiescent cells and cells 40 h post-stimulation with PMA/ionomycin, when 20.3%±3.46 (mean±s.e.m., n=8) had entered S-phase (Supplementary Figure S1A), <1% had divided once (Lea et al, 2003) and were activated (Supplementary Figure S1B). We use a well-established method throughout to measure protein content by FITC staining as a proxy for entry into the growth cycle (Darzynkiewicz et al, 1982), which has been used for many published cell-cycle studies, including our own (Thomas et al, 1991, 1998; Lea et al, 2003; Orr et al, 2010). This approach correlates well with forward-scatter (FSC) analyses of cell size (Supplementary Figure S1C). Typically, quiescent and stimulated cells were kept in culture for the same periods and the results below do not simply reflect hours in culture.
Cell fractions enriched for C/NM-bound proteins as well as unbound (free) proteins were isolated from the quiescent and stimulated T cells by CSK extraction, as described previously (Lea et al, 2003; Orr et al, 2010; modified from Krude et al, 1996). The extracts were trypsinized and proteins were identified by LC-MS/MS (Washburn et al, 2001). Initial MudPIT experiments identified 611 proteins, of which 250 increased in C/NM binding in G1 (see Supplementary Results; Supplementary Table S1). To expand upon the initial mass spectrometry and validation studies, we conducted a second round of proteomic analyses, this time utilizing an LTQ-Orbitrap mass spectrometer (Thermo Scientific) to increase coverage and improve quantification. Samples of C/NM-bound and -unbound proteins from four biological replicates of T cells in G0 and 40 h +PMA/iomomycin were analyzed, yielding a total of 2894 proteins identified with high confidence (<1% FDR), of which 1724 were observed in the C/NM-bound and 2653 in the unbound fractions (Supplementary Table S2). There was an overlap of 595 of the 611 proteins (97.4%) identified in the initial experiments, although some discrepancies were identified due to a detergent removal step in the Orbitrap protocol (Supplementary Results). A majority of proteins identified in the C/NM-bound fraction (86%) were also observed in the unbound fraction either due to the extraction conditions, or because bound and unbound cellular pools exist (illustrated in Figure 1). Indeed, known C/NM proteins such as histones and lamins were observed in the unbound fraction. This is expected for histones as they are synthesized, assembled into complexes and post-translationally modified in the cytoplasm before being transported to the nucleus (Campos et al, 2010). It is possible that other nuclear complexes are also assembled by a similar mechanism. As expected, the C/NM fraction was strongly enriched for nuclear proteins. GO-term analysis found that 52.4% of bound proteins were nuclear and/or nucleolar, while 9.1% were mitochondrial and only 10.8% were primarily cytosolic. The latter is an overestimate as there are many proteins annotated as ‘cytosolic,’ which have nuclear forms as well. In all, 3.4% of proteins in the C/NM fraction were ribosomal. Ribosome assembly occurs in the nucleolus so it is possible that it is the nucleolar form of these proteins that is being detected or those in transit through the nucleus.
Figure 1.
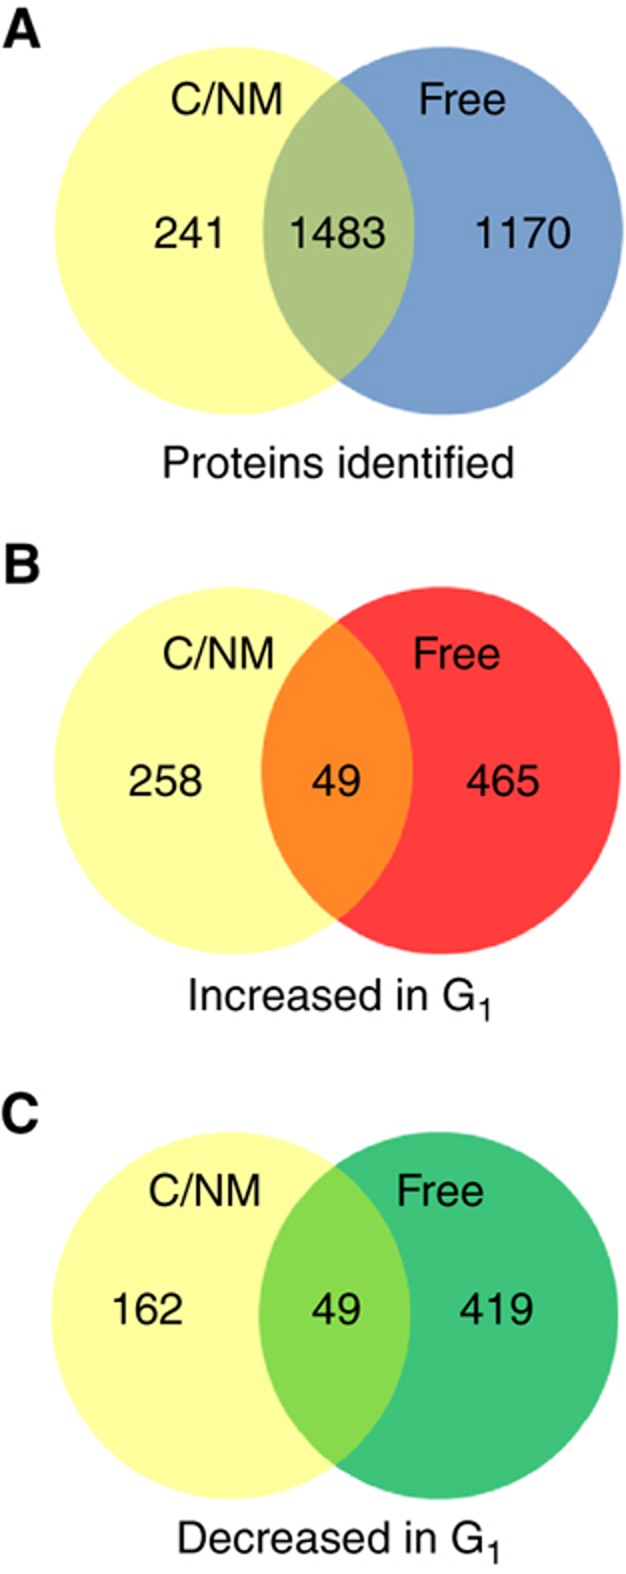
Summary of C/NM-bound and -free fraction proteomic analysis. (A) A total of 2894 proteins were identified at high confidence (<1% FDR) from the combined C/NM-bound and -free fractions, with 1483 proteins (51.2%) identified in both fractions. (B) In all, 772 proteins showed a significant increase in abundance in cells stimulated with PMA/ionomycin as compared with cells in G0 for the C/NM-bound and -free fractions combined, with an overlap of 49 proteins (6.3%). (C) A total of 630 proteins showed a significant decrease in abundance in stimulated cells, with an overlap of 49 proteins (7.8%).
Relative abundances of all proteins during cell-cycle entry were calculated using the APEX method of label-free protein quantification (Lu et al, 2007; Braisted et al, 2008; Vogel and Marcotte, 2008) (C/NM-bound and -unbound proteins; Supplementary Tables S3 and S4), with statistically significant changes in protein abundance assessed by a Z-score cutoff of ±1.96, corresponding to a P-value <0.05. There was a significant increase in the abundance of 307 proteins in the C/NM-bound fraction during cell-cycle entry, while 514 increased in the unbound fraction. In all, 211 bound proteins decreased during cell-cycle entry, along with 468 in the unbound. The overlap between the proteins that increase or decrease in C/NM-bound and free samples is shown as Venn diagrams (Figure 1).
Changes in protein abundance for the C/NM-bound and -unbound fractions can occur either by an overall increase or decrease in protein abundance, or by changes in protein localization. The proteomic data do not allow us to easily distinguish between these two possibilities; however, additional data did allow us to investigate this further. Gene expression array analyses showed that there was an increase in mRNA encoding 44% of the C/NM-bound proteins, which increased during cell-cycle entry (Supplementary Table S5). We validated a subset of changes in C/NM-bound and free proteins identified by our initial mass spectrometry studies by western blotting (Figure 2). These include examples of proteins such as Topo1, RUNX3 and Mcm7, which exhibit changes in overall abundance, while others, such as STAT3 and NF-κB p50, are already present in G0 but become C/NM bound as T cells enter the cell cycle. These data suggest that regulation of both protein abundance and localization play a role in changes to C/NM-bound and -free protein levels as cells enter the cell cycle from G0.
Figure 2.
Validation of proteins identified by mass spectrometry. A subset of proteins identified by the mass spectrometry screen to be C/NM bound in G0 or in cells stimulated with PMA/ionomycin were analyzed by western blotting. The samples analyzed were (A, C, D), total cell lysates of T cells during the G0 or G1 transition (0–40 h +PMA/ionomycin); chromatin/nuclear matrix-bound (Chr) and unbound (free) proteins in G0 or post-stimulation (0 and 40 h +PMA/ionomycin); (B), chromatin/nuclear matrix-bound (Chr) and free samples taken at each of the time points indicated. The patterns of expression and binding for proteins as indicated in (A) are as follows: (a) proteins, such as Topo I, RUNX3 and Mcm7 are present at a low/undetectable level in G0 and are induced and bind C/NM post-stimulation; (b) proteins such as STAT3 and NF-κB p50 are present at similar levels in G0 after stimulation but only bind chromatin in stimulated cells; (c) proteins such as Prohibitin and PARP-1 are present and bind C/NM in G0 but the levels of binding increase when cells are stimulated with PMA/ionomycin. LSP-1 is an example of a protein C/NM bound in G0 but is reduced in stimulated cells. Controls for cell-cycle progression and C/NM-bound versus -unbound proteins and sample loading (Histones stained with Coomassie Blue and p42/p44 MAPK (ERK1/2)) are shown. Representative of n>3 independent experiments for each protein. For each protein analyzed by western blotting, the fold-change of the C/NM binding between cells in G0 and 40 h post-stimulation with PMA/ionomycin, determined by mass spectrometry, is shown in Supplementary Table S8A. Source data is available for this figure in the Supplementary Information.

Dynamic changes of protein interaction networks during the G0 → G1 transition
Proteins that increase in binding to C/NM during cell-cycle entry were assigned to cellular functions by ontology predictions (http://www.geneontology.org) and reading primary papers. In all, 19.6% are involved in the processing of mRNA (RNA splicing (7.8%), transport (1%), decay (2.3%), RNA-binding proteins (3.6%) and RNA helicases (4.9%)), 19.2% in ribosome biogenesis and 12.4% in transcription (Figure 3A). However, these simple classifications hide more complex functional properties of the proteins identified, which can be involved in more than one functional process (see Supplementary Discussion).
Figure 3.

Proteins bound to chromatin/nuclear matrix that increase 40 h post-stimulation with PMA/ionomycin. The C/NM-bound proteins in T cells in G0 and in 40 h after stimulation with PMA/ionomycin were identified by mass spectrometry (LTQ-Orbitrap), as described in the text. The C/NM-bound proteins with a Z-score >1.96 and which are induced >2-fold were identified by APEX. (A) Their functions were annotated by ontology predictions and by reading primary literature for each (see Supplementary Review of T-cell proteomics). A pie-chart of these functions is shown and the percentages are in Supplementary Table S3. (B) A dynamic master protein interaction network of these proteins that are induced during cell-cycle entry was generated by compiling interaction pairs from three different data sets, as described in the text, and visualized using Cytoscape. Each node corresponds to a single protein and the functional category has been assigned a color. MCODE analysis shows clusters of proteins that are involved in the three most highly interconnected subnetworks: (1) ribosome biogenesis, nucleolar proteins, RNA helicases and RNA splicing (2) ribosome biogenesis and (3) nuclear pore complex and splicing proteins (see Supplementary Table S3). Source data is available for this figure in the Supplementary Information.
We wished to visualize the relationships between the proteins that we identified and to establish a dynamic protein interaction network of changes that occur during cell-cycle entry. We mapped the sets of proteins exhibiting significant change in abundance onto the HumanNet functional gene network (Lee et al, 2011a, 2011b) and visualized the resulting maps with Cytoscape (http://www.cytoscape.org), using the yFiles organic layout tool (Figure 3B; Supplementary Figure S2B; networks for both sets of data reported above are also available as .cys Files 1 and 2, which can be viewed in Cytoscape. See also high-resolution PDFs of each in Supplementary Figure S2C and D). The most significant subnetworks that became bound to C/NM during cell-cycle entry include proteins involved in (1) ribosome biogenesis, nucleolar proteins, RNA helicases and RNA splicing; (2) ribosome biogenesis; and (3) nuclear pore complex and splicing proteins (Figure 3B; Supplementary Table S3). These data are consistent with an upregulation of gene expression and protein translation that occurs as quiescent cells enter the cell cycle and proliferate. More detailed discussion of individual proteins identified by our analyses and their cellular functions can be found in Supplementary Discussion. Subnetworks involved in a number of cellular processes induced during cell-cycle entry, such as solute carriers, DNA damage proteins, nuclear pore complex and others, were also predicted using HumanNet (Lee et al, 2011a, 2011b) from seed-sets of proteins identified by the mass spectrometry screen (see Supplementary Results and discussion; Supplementary Figure S4A–E; Supplementary Table S6A–G).
Xin1/Xirp1 is present in the nuclei of human T cells and becomes induced and bound to C/NM during cell-cycle entry
The protein that was induced most in both the C/NM-bound and -free fractions in our mass spectrometry analyses is an actin-binding protein called Xirp1/Xin1 (Pacholsky et al, 2004), implicated in the differentiation of cardiac muscle cells and cardiomyocytes (van der Ven et al, 2006; Claeys et al, 2009; Otten et al, 2010). However, Xirp1 has not previously been reported to be expressed in T cells. To confirm the findings of the mass spectrometry analyses, we used western blotting to analyze the expression of Xirp1 in C/NM and free fractions of T cells entering the cell cycle (Figure 4A). Samples of C/NM-bound and -free fractions from T cells stimulated for 72 h were also crosslinked with formaldehyde and analyzed by western blotting (Figure 5C). These data show that a protein that is detectable with an anti-Xirp1 antibody is induced during cell-cycle entry and becomes bound to C/NM. The induction of this protein was prevented by transfecting the cells with siRNA against Xirp1 (Figure 4A), indicating that it is indeed Xirp1. eIF6 protein expression was also knocked down in these experiments using siRNA against eIF6 and this serves as an additional control for Xirp1 knockdown. Immunocytochemistry was performed on T cells transfected with either a control siRNA or siRNA against Xirp1 then stimulated for 40 h with PMA/ionomycin. The control siRNA-transfected cells show a distinct pattern of Xirp1 staining, which appears to be localized to the nucleus (Figure 4B). This pattern is not present in cells transfected with siRNA against Xirp1, indicating that the staining is due to expression of Xirp1 in the nuclei of human T cells. The nuclear localization of Xirp1 was confirmed using confocal microscopy (Figure 4C).
Figure 4.
Analysis of XIRP1 expression and localization in primary human T cells. (A) The expression of XIRP1 in quiescent T cells and T cells stimulated for 16 and 45 h via CD3/CD28 was determined by western blotting (and see Figure 5B and C). Duplicate sets of transfections of quiescent T cells were carried out with siRNA against XIRP1, or non-targeting siRNA or siRNA against eIF6 as controls, prior to stimulation for the times shown. All samples were run on the same blot. (B) The localization of XIRP1 in T cells stimulated with CD3/CD28 for 40 h was determined by immunofluorescence. The cells analyzed were either transfected with control siRNA (left panel) or XIRP1 siRNA (right panel). Cells were counterstained with DAPI to show the location of nuclei. (C) Induction and nuclear localization of XIRP1 was confirmed by confocal microscopy of quiescent T cells and cells stimulated for 40 h with CD3/CD28. Z-depth was set to reveal the center of nuclei and the bottom panel shows a single optical slice taken through one nucleus. Source data is available for this figure in the Supplementary Information.

Figure 5.
Actin-binding proteins identified by mass spectrometry. A subset of putative actin-binding proteins identified by the mass spectrometry screen to be C/NM bound in G0 or in cells stimulated with PMA/ionomycin were analyzed by western blotting. Western blotting samples of: (A) total cell lysates of T cells during the G0 or G1 transition (0–72 h +PMA/ionomycin); (B) C/NM-bound and -unbound (free) proteins in G0 (0 h) and during cell-cycle entry (24, 48 and 72 h +PMA/ionomycin); (C) C/NM-bound and -unbound (free) proteins in G0 (0 h) and at 72 h +PMA/ionomycin with formaldehyde crosslinking (XL) or without. For each protein analyzed by western blotting, the fold-change of the C/NM binding between cells in G0 and 40 h post-stimulation with PMA/ionomycin, determined by mass spectrometry, is shown in Supplementary Table S8B. Source data is available for this figure in the Supplementary Information.

Other actin-binding proteins were also detected in the C/NM fraction, including hnRNP proteins (Percipalle et al, 2002, 2009), BAF proteins (Zhao et al, 1998; Olave et al, 2002), p54NRB (Ferrai et al, 2009) and Lamin A/C (Simon et al, 2010). These proteins, along with HELLS/Lsh (SMARCA6:SWI/SNF2-related matrix-associated actin-dependent regulator of chromatin) (Lee et al, 2000), were also analyzed by western blotting (Figure 5). Our data suggest that actin-binding proteins may be active in the nucleus and other laboratories have shown a role for these proteins in chromatin remodeling, transcription and RNA processing (see Percipalle et al, 2009; Zheng et al, 2009).
Functional analyses of splicing and ribosome biogenesis during the G0 → G1 transition
The most significantly upregulated cellular processes for proteins that become bound to C/NM during cell-cycle entry are ribosome biogenesis and RNA processing (RNA splicing, transport, editing, decay and RNA-binding proteins). Proteins involved in these two processes, respectively, account for 19.2 and 19.6% of proteins that increase in binding to C/NM as cells enter the cell cycle, and MCODE analyses of the protein interaction map show that the most significant subnetworks are enriched for proteins involved in these functions (see Figure 3B and Supplementary Table S3). We therefore investigated the importance of these processes for transition from quiescence into the cell cycle by inhibiting the induction of two key proteins identified in our mass spectrometry screen. The proteins we chose to target were the splicing factor SF3B2 and eIF6, which is involved in ribosome biogenesis. SF3B2 was identified as becoming bound to C/NM in our initial mass spectrometry experiments and verified by western blotting (Figure 2C). Although none of the SF3B splicing factors identified in subsequent mass spectrometry screens reached the fold-change cutoff of 1.5, we decided to target SF3B2 as it is known to be involved early in 3′-splice site recognition and reducing the expression of this protein would be expected to have profound effects on splicing activity. eIF6 was chosen as it is involved in 60S ribosome biogenesis and because it was very highly upregulated during cell-cycle entry.
SF3B2 is required for entry into the cell cycle but not the growth cycle
SF3B2 is a component of the SF3B splicing factor and is required for the functioning of both the major (U2-type) and the minor (U12-type) spliceosomes (Will et al, 1999). Since many genes are induced as cells enter the cell cycle for the first time (Diehn et al, 2002), depleting SF3B2 would be expected to prevent the expression of these genes and materially affect programs that are stimulated during the G0 → G1 transition. Western blotting analyses showed that SF3B2 is poorly expressed in G0, but is induced and becomes C/NM bound following PMA/ionomycin stimulation (Figure 2C). To study the requirement for SF3B2 during cell-cycle entry, the induction of the protein was blocked with siRNA. A pool of four individual siRNA duplexes reduced SF3B2 expression to <5% of normal levels, as estimated by western blotting for SF3B2 (Figure 6A). Inhibition of the induction of SF3B2 caused a marked reduction in the percentage of cells that entered S-phase (17.2±1.6% with control siRNA versus 7.0±1.7% with SF3B2 siRNA, mean±s.e.m., n=15, P-value 3.4 × 10⁻⁶; Figure 6D). The percentage of SF3B2-depleted cells in S-phase 5 days post-stimulation had still not reached the level of cells transfected with control siRNA, indicating that quantifying the effects of depleting SF3B2 at an earlier time point (day 3) is valid. The effects on cell-cycle progression were also observed with three of the four individual siRNA duplexes (Figure 6E), so it is unlikely that the results are due to off-target effects. Inhibition of SF3B4 expression also led to a decrease in the percentage of cells in S-phase (14.8±1.5% with control siRNA versus 7±1% with SF3B4 siRNA, mean±s.e.m., P-value 8.5 × 10⁻⁵; Figure 6D). SF3B2 and SF3B4 are both components of the SF3B splicing complex (Golas et al, 2003) and are both required for splicing activity. Therefore, these data are consistent with a requirement for SF3B-dependent splicing for T cells to enter S-phase. This could be due either to cell-cycle inhibition in late G1, which prevents cells progressing from G1 into S-phase, or to inhibition of the cell cycle earlier during the G0 to G1 transition but no effect on the growth cycle.
Figure 6.
Consequences of reducing SF3B2 expression. (A) Normal quiescent human T cells were transfected with a pool of four siRNA duplexes against SF3B2 with non-targeting siRNA as control. After stimulation with PMA/ionomycin for 72 h, the expression of SF3B2, phospho-pRbs807/811, cyclin A2, cyclin D3, E2F-1 and Cdc6 was detected by western blotting, with GAPDH as a loading control. (B) The expression of phospho-mTORS2448, phospho-4EBP1T37/46 and phospho-eIF4Es209 was detected in T cells transfected and stimulated as in (A). (C) T cells were transfected with a pool of four siRNA duplexes against SF3B4 or with non-targeting siRNA as control. The cells were stimulated with PMA/ionomycin and the expression of SF3B4, phospho-pRbs807/811, cyclin A2, E2F-1, Cdc6, phospho-4EBP1T37/46 and phospho-eIF4Es209 were detected by western blotting. (D) T cells transfected and stimulated as in (A, B) were fixed with ethanol, stained with PI (DNA content) and FITC (total protein content as a measure of cell size; see main text) and the proportion of cells in each of the cell-cycle phases indicated in the first panel was determined by flow cytometry. A sample of cells transfected as in (A) was also sampled after 5 days in culture and analyzed in the same way. The percentages for this experiment are shown and the mean±s.e.m. for all repeat experiments is indicated in the text. (E) Quiescent T cells were transfected with each of the four individual siRNA duplexes then stimulated for 72 h with PMA/ionomycin. The percentage of cells in each cell-cycle phase was determined by flow cytometry as described in (D). Source data is available for this figure in the Supplementary Information.

Analyses of the expression of proteins that regulate the cell cycle showed that depletion of SF3B2 prevented the induction of cyclin D3, which normally occurs early in G1 once T cells have passed the G0 → G1 CP (Lea et al, 2003) (Figure 6A). SF3B2 inhibition also prevented the phosphorylation of pRb on S807/811, which is dependent on cdk4/6-cyclin D and normally occurs within 16 h of PMA/ionomycin stimulation (Figure 6A and see Lea et al, 2003). The inhibition of pRb phosphorylation and the lack of cyclin D3 expression are consistent with inhibition of the transition from quiescence into the cell cycle (Lea et al, 2003). E2F-1 is normally induced later in G1 and activation of this transcription factor is necessary for the induction of many genes encoding proteins required for cell-cycle progression, for example, Mcm7 (Orr et al, 2010), Cdc6, Cdc2 (Cdk1) and cyclin A2 (DeGregori et al, 1995). The induction of E2F-1 and its downstream targets CCNA2 (cyclin A2) and CDC6 were not detected in SF3B2-depleted cells after 72 h of PMA/ionomycin stimulation (Figure 6A). These data show that SF3B-depleted cells are prevented from entering the cell cycle, but are still capable of an increase in size, consistent with entry into the growth cycle (Zetterberg, 1996).
In order to enter the growth cycle, a cell must increase protein synthesis, which is largely mediated through the mammalian target of Rapamycin (mTOR) (see Supplementary Figure S5 for normal kinetics of induction in T cells). mTOR is a direct downstream target of protein kinase B (PKB) and is phosphorylated on S2448 in response to growth factor stimuli (Nave et al, 1999). Inhibition of SF3B2 induction with siRNA did not significantly reduce the amount of detectable phosphorylation of mTORS2448 and had little effect on the phosphorylation status of 4EBP1 (Figure 6B). Cells in G0 are normally prevented from initiating 5′ cap-dependent protein synthesis by the presence of a hypophosphorylated form of 4EBP1, so the presence of a phosphorylated form of 4EBP1T37/46 in SF3B2-depleted cells that have been stimulated with PMA and ionomycin is evidence that these cells have entered the growth cycle. No change was detected in the amount of phosphorylated eIF4ES209 when SF3B2 was depleted (Figure 6B). Depletion of SF3B4 also had the same effects (Figure 6C), suggesting that the effects observed are due to an inactivation of the SF3B splicing complex rather than to the depletion of SF3B2 or SF3B4 specifically. The increase in size in SF3B2/4-depleted cells was identified by flow cytometry analyses of protein content (Figure 6D), and the western blot analyses are confirmatory evidence that proteins involved in regulating cell growth, for example, 4EBP1 and eIF4E are phosphorylated in SF3B2/4-depleted cells. Taken together, these data show that SF3B is required for entry into the cell cycle, but not for entry into the growth cycle. Furthermore, these data show that entry into the cell cycle and growth cycle are separable in primary T cells.
Reducing eIF6 affects the growth cycle but not the cell cycle
There is a significant increase in the rate of protein synthesis during the G0 → G1 transition accompanied by a four-fold increase in ribosome number (Ahern and Kay, 1971). A three- to four-fold increase in protein content occurs as cells progress from G0 to M-phase for the first time (Supplementary Figure S1A) and proliferating cells must double in size during progression through the cell cycle to maintain cell size with each division. The eIF6 protein is required for 60S ribosomal subunit biogenesis. eIF6 is not expressed or expressed at a low level in quiescent T cells and becomes expressed in mid-G1 (16 h post-stimulation; Figure 4A). Inhibition of eIF6 induction in G1 would be expected to reduce the number of ribosomes, protein synthesis and growth cycle entry. To investigate this requirement for the increase in cell size during cell-cycle entry, quiescent T cells were transfected with siRNA against eIF6. Pools of eIF6 protein exist in cells that turn over slowly and might be sufficient to maintain 60S ribosomal subunit biogenesis (Gandin et al, 2008). Therefore, the siRNA-transfected cells were cultured for 3 days without stimulus to reduce the background levels of eIF6 and then stimulated with anti-CD3/CD28 beads. Samples were taken for western blotting and cell-cycle analysis at day 2 and day 3 following CD3/CD28 stimulation. Transfection with siRNA against eIF6 caused a reduction in eIF6 expression to <5% of normal levels as estimated by western blotting (Figure 7A). In contrast to results found when SF3B2 expression was inhibited, inhibition of eIF6 did not lead to a significant reduction in the percentage of cells entering the cell cycle (cells in S and G2/M-phase: 19.1±3.9% with control siRNA versus 18±3.1% with eIF6 siRNA, mean±s.e.m., P-value=0.39; Figure 7B). However, cells that were depleted of eIF6 had lower protein content (indicates cell size) than cells transfected with control siRNA (FITC staining, vertical axis; Figure 7B). In particular, the mean fluorescence intensity of FITC staining (used as a measure of protein content) of cells that had entered S and G2/M-phases was significantly reduced when eIF6 was depleted (484.42±3.36 with eIF6 siRNA versus 626.43±22.7 with control siRNA, mean±s.e.m., P-value=0.008, n=3; Figure 7B). It is interesting to note that the variability in the protein content of cells, as indicated by the range of FITC staining (see Figure 7B; y axis) in S and G2/M was much reduced when eIF6 was depleted (range: 454±33 with eIF6 siRNA versus 638.5±12 with control siRNA, mean±s.e.m., n=3). Thus, we show not only that reducing an important intracellular protein affects the average size of T cells in S+G2/M, but the range of cell size is decreased by depleting eIF6. The molecular mechanisms in T cells controlling the range of protein content remain to be investigated.
Figure 7.
Consequences of reducing eIF6 expression. (A) Normal quiescent human T cells were transfected with siRNA against eIF6 or with non-targeting siRNA as control. After stimulation with PMA/ionomycin for 72 h, expression of the proteins indicated was detected by western blotting. (B) Quiescent T cells transfected and stimulated as in (A) were ethanol fixed and stained with PI (DNA content) and FITC (total protein content (cell size)). Note that cells transfected with siRNA against eIF6 are smaller, with a lower protein content than those transfected with control siRNA (y axis) and mean±s.e.m. values are given in the main text. The percentage of cells in each cell-cycle phase was determined by flow cytometry. Representative of n=3 experiments. Source data is available for this figure in the Supplementary Information.

The reduction in cell size observed in eIF6-depleted cells suggests an inhibition of protein synthesis. There was a significant decrease in the amount of eIF4ES209 and 4EBP1T37/46 in eIF6-depleted cells, along with a reduction in mTORs2448 (Figure 7A). This strongly suggests an inhibition of 5′ cap-dependent protein synthesis, which would explain the observed reduction in cell size and protein content. The expression of proteins involved in cell-cycle entry was also studied by western blotting. Mcm7 was induced normally in both control and eIF6-depleted cells (Figure 7A), indicating that depletion of eIF6 did not affect the ability of cells to enter S-phase, as shown by cell-cycle analyses (Figure 7B). However, phosphorylation of pRb on S807/811 was detected at lower levels and cyclin A2 was not detected in cells that had been depleted of eIF6 (Figure 7A). These data show that cells depleted of eIF6 are able to express and activate some proteins required for entry into the cell cycle, but have a reduction in the activation of proteins that are required for the initiation of protein synthesis. Thus, cells which are smaller and with lower protein content than normal are nevertheless capable of entering the cell cycle, showing that there is not an obligate coupling of cell-cycle progression with cell size, which human T cells achieve under normal conditions.
Discussion
The data presented here show that identifying proteins that bind to C/NM as cells enter the cell cycle can be used to determine changes in protein interaction networks that occur during the re-programming of a cell from a quiescent to an actively cycling, activated state. These networks include chromatin remodeling, transcription, RNA processing, ribosome biogenesis, DNA replication and structural elements, such as nuclear actin-binding proteins and components of the nuclear matrix. Proteins in these networks identified in our study as well as specific predicted subnetworks are discussed in detail in Supplementary Discussion.
In addition to identifying protein interaction networks, we carried out siRNA experiments, which show that it is possible to decouple cellular programs (the cell cycle and the growth cycle) that are normally tightly regulated. This builds on a previous study carried out in our laboratory, which showed that T cells could undergo functional activation without entering the cell cycle (Lea et al, 2003).
Inhibition of the induction of SF3B prevents entry into the cell cycle but not the growth cycle
Reducing the expression of SF3B2 or SF3B4 to <5% of normal levels prevented T cells entering the cell cycle. This was expected as many genes are induced de novo during entry into G1 (Diehn et al, 2002 and data presented here), including a number required for cell-cycle entry. However, it would be expected that other processes, such as entry into the growth cycle, would also be affected by a reduction in splicing activity. Rather, the data presented here show that cells depleted of either SF3B2 or SF3B4 do still increase in size and protein content, indicating that these cells are still capable of entering the growth cycle. This suggests that the pre-spliced mRNAs encoding proteins necessary for growth are already present during G0. This is borne out by an analysis of mRNA expression in quiescent T cells (Supplementary Table S7). These data show that the top 100 most highly expressed mRNAs in G0 include those encoding proteins involved in translation (including mRNA encoding 7 initiation factor subunits), ribosome proteins and cytoskeletal proteins. Therefore, mRNAs are already present in G0 and do not need to be transcribed. Furthermore, we demonstrate that at least 45 translation initiation and elongation factors are already present in quiescent cells (listed in Supplementary Table S7).
Our mRNA expression and mass spectrometry data therefore support the hypothesis that mRNAs encoding translation initiation and elongation factors, involved in control of the growth cycle are already present in quiescent cells and are thus probably unaffected by a reduction in splicing activity. A number of translation factors, such as eIF4E, are further induced during the G0 → G1 transition by mitogenic stimulation (Supplementary Table S2; Supplementary Figure S5; Rosenwald et al, 1993), but the mRNA expression data suggest that quiescent T cells are primed to enter the growth cycle, but splicing of de novo transcripts that are induced in G1, such as MCM7 (Orr et al, 2010), is required for cells to enter the cell cycle.
Depletion of eIF6 allows entry into the cell cycle at reduced cell size
We showed here that T cells in which eIF6 has been reduced are able to enter the cell cycle, but they do so at a restricted size. Studies of yeast demonstrated that eIF6 is involved in the biosynthesis of the large (60S) ribosomal subunit (Fatica and Tollervey, 2002; Horsey et al, 2004; Volta et al, 2005). In higher eukaryotes, reducing eIF6 expression in mouse fibroblasts to about 20% of normal using siRNA did not affect ribosome biogenesis as a pool of nucleolar eIF6 remained (Gandin et al, 2008). Cells depleted of eIF6 by siRNA treatment have sufficient ribosomes to translate the proteins necessary for survival and core metabolic processes, but are not capable of responding normally to a mitogenic stimulus. However, a homozygous EIF6 knockout is embryonic lethal and it was concluded that eIF6 is necessary for ribosome biogenesis.
Under normal, non-limiting conditions, increase in cell size and protein content keeps in step with progression through the cell-cycle phases so that cellular homeostasis is maintained with each cell division. However, work on Schwann cells showed that the homeostatic cell size can be changed over several cell divisions by limiting the availability of extracellular factors (Conlon and Raff, 2003). Cell divisions that do not result in cell growth occur during Xenopus and Drosophila embryonic development, although the mechanisms in Drosophila and mammalian cells that regulate cell growth and proliferation are different (Montagne et al, 1999; Miron et al, 2001; Conlon and Raff, 2003; Ohanna et al, 2005; Dowling et al, 2010). The data presented here show that if endogenous levels of eIF6 in human quiescent T cells are reduced and the induction of eIF6 that normally occurs in response to CD3/CD28 stimulation is inhibited, the cells enter the cell cycle as normal but at a reduced size. This indicates that T cells are capable of progressing through the cell cycle when protein content and cell size is restricted, even in the presence of non-limiting conditions of extracellular stimuli, showing that progression through the cell cycle is coincident with but not completely dependent on cell size. The role of eIF6 is to prevent the premature association of the 60S and 40S subunits (Valenzuela et al, 1982), leading to the accumulation of inactive 80S particles (Gandin et al, 2008), which would sequester 40S subunits. So, reducing eIF6 will reduce the availability of 40S ribosome subunits to initiate translation. Our data show that the mTOR/eIF4E/4EBP1 pathway is also affected by reducing eIF6, although the mechanisms remain to be determined. The role of mTORC1 in mediating proliferation but not cellular growth by affecting the selection of mRNA translated was shown recently (Dowling et al, 2010).
The roles of initiation factors are complex and there are no a priori rules as to the effects that a particular factor may have on cell growth and proliferation. For example, eIF4B depletion in cancer cells attenuates proliferation (Shahbazian et al, 2010a, 2010b) but not cell size (Dowling et al, 2010). Reduction in proliferation involves the selective translation of mRNA encoding proteins, such as cyclin D3, ODC and VEGF. In contrast, eIF4GI depletion impairs cell proliferation and cell size in MCF10A breast epithelial cells, while depletion or overexpression of other eIF4G family members does not (Ramirez-Valle et al, 2008). Depletion of eIF4GI isoforms in HeLa cells causes mitotic abnormalities, including multi-nucleated cells (Coldwell and Morley, 2006). So, abrogation of translation factors have different effects and it is not expected that eIF6 would necessarily affect cell growth but not cell-cycle progression. In addition, splenic pre-B cells in EIF6−/+ mice have a small reduction in the percentage of S-phase cells and an increase in G0/G1 cells in response to induction of Myc, but this did not occur in pre-B cells in the bone marrow. However, cell size was not measured (Miluzio et al, 2011). Therefore, reducing the level of a eukaryotic initiation factor (haploinsufficiency in EIF6) decreases proliferation of pre-B cells but only in the spleen and not the bone marrow.
The consequences of a defect in eIF6 function are illustrated by Shwachman–Bodian–Diamond syndrome. Clinical features include exocrine pancreatic insufficiency, defects in hematopoeisis and a predisposition toward leukemias, in particular myelodysplastic syndrome (MDS) and acute myeloblastic leukemia (AML) (Woods et al, 1981; Dror et al, 1998). There are also effects on lymphocyte-mediated immunity, including decreased B-cell proliferation, reduction in the number of T cells in the peripheral blood and defects in the CD4/CD8 ratio (Dror et al, 2001). This is an autosomal recessive disorder, caused by mutations in the SBDS gene (Boocock et al, 2003), and no abnormalities in EIF6 have been reported. The function of the protein encoded by the SBDS gene was determined by studies on its ortholog in yeast, Sdo1 (Menne et al, 2007). Mutations in this gene lead to defects in 60S ribosome biogenesis, with the nuclear retention of pre-60S ribosomes that would normally be exported to the cytoplasm (Menne et al, 2007). This effect was reversed by gain-of-function mutants of Tif6, which is the yeast ortholog of human EIF6. Two important papers on mammalian eIF6 were published recently. The first describes the mechanism in Shwachman–Bodian–Diamond syndrome involving SBDS, EFL1 and eIF6 in late cytoplasmic ribosomes, catalyzing translational activation (Finch et al, 2011). The second shows a role for eIF6 in response to growth factors and its requirement for lymphomagenesis (Miluzio et al, 2011).
We have shown here that a high-throughput mass spectrometry approach can be used to identify regulatory mechanisms involved in the re-programming of T cells during the G0 → G1 transition. We have also shown that cell-cycle entry can be dissociated from entry into the growth cycle by inhibiting the induction of the splicing factors SF3B2/SF3B4 or the ribosome biogenesis factor, eIF6. There are a number of other C/NM-bound protein interaction subnetworks that we identify in our study, for example, solute carriers, nuclear pore complex proteins and others (Supplementary Results and discussion). Such subnetworks are likely to have important roles in re-programming quiescent T cells to enter the cell and growth cycles and to become activated. A combination of stringent bioinformatic predictions of binding partners of proteins in these subnetworks as well as wet-lab confirmation and analyses of the roles of such subnetworks in the G0 → G1 transition will no doubt shed further light on the integration of cellular programs necessary for peripheral T-cell expansion and functional activation.
Materials and methods
T-cell isolation and stimulation
Normal, non-activated, quiescent human T cells were isolated by negative selection (Dynal, Invitrogen) from single-donor buffy coats (Lea et al, 2003) and assays to analyze T-cell activation and cell-cycle progression were as described in Lea et al (2003).
Isolation and trypsinization of chromatin/nuclear matrix proteins
Non-activated or stimulated T cells from four individual donors (biological replicates) (usually 3 × 10⁷ cells) were pelletted and resuspended in 20 μl/106 cells ice-cold CSK buffer (10 mM PIPES pH 6.8, 100 mM NaCl, 300 mM sucrose, 1 mM MgCl2, 1 mM EDTA, 0.1% (v/v) Triton X-100, 0.1 mM ATP, protease and phosphatase inhibitors (Complete, Roche)) as described (Lea et al, 2003). The insoluble pellet, containing chromatin/nuclear matrix-bound proteins (Krude et al, 1996), was centrifuged at 1000 g and washed 3 × with 50 μl PBS. The CSK-soluble proteins (‘free’ fraction) were precipitated by adding four volumes of −20°C acetone. Both ‘free’ and ‘chromatin’ pellets were resuspended in 10 mM Tris–HCl pH 7.8, 10 mM KCl, 1.5 mM MgCl2. Residual Triton X-100 was removed with the OrgoSol DetergentOUT Detergent removal kit (G-Biosciences). Following detergent removal and resuspension, proteins were denatured by addition of trifluoroethanol (TFE) to 50% (v/v). Proteins were reduced (15 mM DTT at 56°C for 45 min) and alkylated (55 mM iodoacetamide at 25°C for 30 min). Samples were diluted 10-fold with digestion buffer (50 mM Tris–HCl pH 7.8, 2 mM CaCl2) to decrease the TFE concentration to 5% (v/v). Each sample was treated with 2 μg Proteomics Grade trypsin (Sigma) and incubated at 37°C for 4 h. Trypsin activity was halted by the addition of 1% formic acid, and sample volume was reduced to ∼20 μl by SpeedVac centrifugation. Samples were resuspended to 150 μl with Buffer C (95% H2O, 5% acetonitrile (ACN), 0.1% formic acid). To remove undesirable contaminants, digested samples were cleaned up by reverse phase chromatography on Hypersep C18 Columns (Thermo) and filtered on Microcon 10 kDa Spin Tubes (Centricon) prior to LC-MS/MS.
Mass spectrometry
LC/MS/MS analysis was carried out on an Eksigent nanoflow LC system connected to an LTQ-Orbitrap XL (Thermo). Four injections were carried out per sample. Tryptic peptide mixtures were separated online by reverse phase chromatography on a Zorbax C18 reverse phase column (Agilent) by 5–38% ACN gradient over the course of 230 min. Eluted peptides were directly injected by electrospray ionization into an LTQ-Orbitrap XL hybrid mass spectrometer (Thermo) equipped with a nano-spray ion source for analysis. Full spectra (MS1) were collected at 100 000 resolution. Ion fragmentation spectra (MS2) were collected in a data-dependent manner, with ions required to carry +2 or greater charge for MS2 selection. The top 12 most intense qualifying peaks were selected per round, with peaks selected twice within 30 s excluded from selection for 45 s. Spectra were searched using the Sequest search algorithm against the non-redundant Ensembl 57 Homo sapiens (NCBI36) protein-coding data set. Search results were submitted to PeptideProphet (Keller et al, 2002) and ProteinProphet (Nesvizhskii et al, 2003) via TPP (Keller et al, 2005) and filtered to 1% false positive rate using a target-decoy method with a reverse-concatenated database.
Bioinformatic analysis
Generation of protein lists
For each biological replicate fraction, four separate LC-MS/MS injections were performed and analyzed independently. Data sets corresponding to the same biological replicate fraction were then merged, with spectral counts summed within each set. All data sets were aligned, and proteins observed in only one biological replicate fraction were removed. Keratins were also removed from the data set. To account for the occurrence of degenerate peptides assigned to multiple proteins, the data set was curated to assign all peptides to a single unique protein or protein group. Protein groups consisted of the smallest set of proteins needed to account for non-unique peptide identifications, whereby all group members shared equal evidence of occurrence.
Protein quantification
Proteins were quantified by comparison of spectral counts, as described in Lu et al (2007) and Vogel and Marcotte (2008). In summary, frequencies of observation were calculated from spectral counts for each protein in each biological replicate fraction, and individual Z-scores were calculated by comparing frequencies at 0 and 40 h time points to determine the statistical significance of differences in relative abundance (Lu et al, 2007; Vogel and Marcotte, 2008). A z-score of ±1.96, corresponding to a P-value <0.05, was used as a determinant of significance. Composite Z-scores for free and bound fractions were then calculated from the individual Z-scores for each biological replicate. Fold-change was estimated as a ratio of frequencies of observation for each protein at 0 and 40 h time points. For each protein, a pseudo-count of 1 was added to each spectral count total prior to frequency calculations in order to adjust for proteins with a zero-count.
Ontology annotations
Each protein was assigned a function by GO annotation (http://www.geneontology.org) and the functional categories used for the pie-chart shown in Figure 3A and Supplementary Figure S2 were curated based on reading the primary literature for each protein (see Supplementary Review of T-cell proteomics).
siRNA and transfection
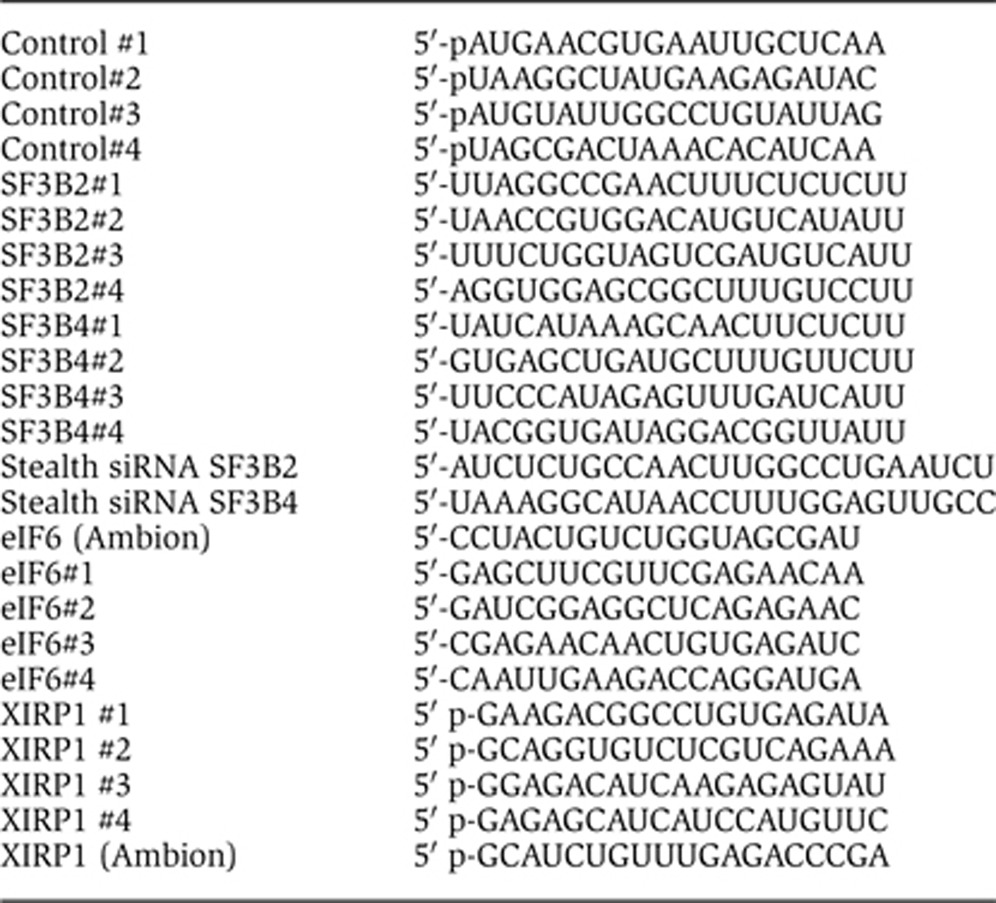
Pools of SF3B2, SF3B4 and control siRNA (SmartPool, Dharmacon), or each of four individual siRNA (siGenome, Dharmacon) or stabilized siRNA (Stealth, Invitrogen) were transfected into quiescent primary human T cells by electroporation (Nucleofection, Amaxa) (Orr et al, 2010). Sequences of the siRNA used are shown on the next page (antisense sequences).
Cells transfected with siRNA were cultured overnight without stimulus to recover, stimulated with PMA/ionomycin and samples were typically taken 72 h later for further analyses. Samples were also analyzed at other time points up to 128 h (5 days) later, as indicated in the text. For eIF6, the siRNA-transfected cells were left in culture for 3 days to deplete low levels of endogenous protein present in quiescent cells before stimulation. The level of SF3B2 or eIF6 protein expressed after siRNA transfection was determined by western blotting using 2 × 10⁵ cells per well and the signal obtained was compared with incremental amounts of the sample transfected with control siRNA (4 × 10³–2 × 10⁵ cells, that is, 2–100% of the SF3B2 siRNA-transfected cells) that was run on the same blot.
Western blotting
Western blotting was carried out with 4–12% (w/v) polyacrylamide Bis-Tris gels (Invitrogen-Novex). Antibodies used were Apobec 3C (C8-1, Professor Neuberger, MRC, Cambridge, UK); BAF53 (Dr Michael Cole, Dartmouth College, USA); HnRNP-K (C-terminus, Professor Bomsztyk, U Washington, USA); p68 (DDX5) (PAb204, Upstate; from Professor Frances Fuller-Pace, Dundee, Scotland); Prohibitin (Ab-1, Neomarkers; from Professor Eric Lam, Imperial College, London); RUNX3 (Professor Paul Farrell, Imperial College, London); SAFB1 (Dr S Osterreich, MD Anderson, Houston, TX, USA); Topoisomerase I (C21, BD-Pharmingen; from Dr Andrew Porter, Imperial College, London); MeCP2 (ab3752), HP1γ (ab10480), Histone H3 (ab1791) SF3B4 (ab11803) (Abcam); cyclin A2 (BF683), NF-κB-p50 (K10-895.12.50), PARP-1 (C2-10), pRb (PMG3245), STAT3 (Ab-84) (BD-Pharmingen); p54nrb (611278), BAF190 (610390), Mcm2 (BM28) (BD Transduction Laboratories); eIF6 (#3263; from Professor Alan Warren, University of Cambridge); p44/42 MAP kinase; phospho-mTOR (S2448), phospho-eIF4EBP1 (T37/46), phospho-eIF4E (S209), RPS6 (#2317) (Cell Signaling Technology); GAPDH (MAB374), PP1-α (AB4082, Chemicon); phospho-pRb(S807/811) (New England BioLabs, Hertfordshire, UK); Aly/THOC4 (sc-32311), cdc2 (Cdk1) (17), Cdc6 (C19), cdk6 (C21), cyclin D3 (C16), E2F-1 (C20), HELLS/Lsh (H-4, sc-46665), Lamin A/C (N-18; sc-6215), SAM68 (C20), Xin1/Xirp1 (D8, T-20) (Santa Cruz Biotechnology, Inc., Santa Cruz, CA); hnRNP-A2/B1 (DP3B3), Mcm7 (DCS 141) (Sigma); LSP-1 (Ab-16) (Transduction Laboratories). In the course of this study, western blot membranes were either routinely cut into sections and each section probed with a different antibody or the blots were re-probed sequentially with different antibodies, which recognize proteins of different molecular weights (e.g., Mcm2 and Mcm7). Sections of the films that showed the bands corresponding to each antibody (determined by size comparison with molecular weight markers) were selected in the scanner software (Epson Scan 3.04), scanned individually as separate image files and saved as JPEGs. In some cases, changes in brightness and/or contrast were applied linearly equally across the entire image. These are available as Source Data.
Immunofluorescence
Cytospin preparations of 40 000 T cells were made on poly-lysine-coated microscope slides (Shandon Cytospin 4 (Thermo)). Slides were fixed in 2% (w/v) paraformaldehyde for 30 min at room temperature, washed three times with PBS and stored immersed in PBS at 4°C. Cells were permeabilized with 0.2% (v/v) Triton X-100 in PBS for 10 min at room temperature, washed three times in PBS, blocked in PBS/10% (w/v) BSA and washed three times with PBS. Slides were incubated overnight with 1/100 Xirp1 antibody in blocking solution at 4°C, washed three times with PBS, incubated for 1 h in 1:200 TRITC-conjugated donkey anti-goat secondary antibody (Jackson Laboratories) in blocking solution, then washed as above. Cells were counterstained with a DNA stain (DAPI), rinsed in PBS, mounted using Antifade and analyzed with an Olympus (Provis AX70, Olympus) fluorescent microscope with DAPI/FITC/rhodamine triple pass filters. Confocal microscopy and Z-stacks of 50 optical slices was performed using a Leica DMIRE2 instrument (with thanks to Dr M-J Bijlmakers, Immunology Department, KCL).
Gene expression analysis
Gene expression arrays (U133A, Affymetrix) were probed with RNA isolated from at least four biological replicates of T cells in G0 and at time points corresponding to cells during the G0 → G1 transition (1–8 h), mid/late G1 (24 and 32 h) and later in the first cell cycle (48 h). The procedures were according to the manufacturer's protocols (one-round amplification; Affymetrix). Data were normalized using the VSN algorithm (version 3.2.1) (Huber et al, 2002) implemented in Bioconductor (Biobase/Affymetrix versions 1.16.2/1.16.0) (Gentleman et al, 2004) and R version 2.6.1 (Dessau and Pipper, 2008). The probe sets were mapped on the ENSEMBL (Hubbard et al, 2009), NCBI 36 assembly, allowing for one alignment error between the probe and transcripts sequences. Probe sets containing probes matching more than one gene, or which matches contained alignment errors, were ignored for further analysis. The final expression values were averaged over replicated time points, and over probe sets reporting the same gene.
Protein interaction network analysis
A network consisting of human protein–protein interaction pairs was generated using HumanNet (http://www.functionalnet.org/humannet/) (Lee et al, 2011a, 2011b). HumanNet is a probabilistic functional gene network derived from the integration of large-scale ‘omics’ data sets across multiple species. Proteins showing significant changes in abundance (1.96 ⩾Z-score ⩽−1.96, fold-change ⩾2) in the bound and unbound fractions were mapped onto the network and visualized using Cytoscape (http://www.cytoscape.org).
Biological replicate experiments and statistical analysis
Each experiment was carried out with cells isolated from at least three independent donors (n=X indicates X independent donors). Results are expressed as mean±standard error of the mean for the n=X experiments. The significance of differences between conditions was assessed by the Students ‘t’-test.
Archiving mass spectrometry and microarray data
All mass spectrometry data described in this paper are publically available through PeptideAtlas (http://www.peptideatlas.org/PASS/PASS00016). Microarray data have been deposited in GEO with the accession number GSE32607.
Supplementary Material
The contents are listed in the Table of Contents on the first two pages of this file
Acknowledgments
This study was supported by grants from the Charles Wolfson Charitable Trust, Leukaemia Research Fund (LRF; now Leukaemia and Lymphoma Research (LLR)), Medical Research Council (MRC), Elimination of Leukaemia Fund (ELF), Department of Trade and Industry (dti), the Welch (F1515) and Packard Foundations and the National Institutes of Health (NIH). We sincerely thank each of the people who kindly provided and/or recommended antibodies. We also thank Tony Ng, Eric So and Farzin Farzaneh for critical comments on the manuscript.
Author contributions: NSBT and EMM conceived the study and supervised the work. SJO and DRB contributed equally to the work. SJO, DRB, RW, CC, NCL, TT, EH, HM and EB performed wet-lab experiments and/or analyzed the data. SJO, DRB, EH, HM, EMM and NSBT wrote the manuscript, with intellectual input and revisions from all authors. All authors discussed the results, provided intellectual input and commented on the manuscript.
Footnotes
The authors declare that they have no conflict of interest.
References
- Acuto O, Michel F (2003) CD28-mediated co-stimulation: a quantitative support for TCR signalling. Nat Rev Immunol 3: 939–951 [DOI] [PubMed] [Google Scholar]
- Ahern T, Kay JE (1971) Control of protein synthesis during lymphocyte stimulation. Biochem J 125: 73P–74P [DOI] [PMC free article] [PubMed] [Google Scholar]
- Anachkova B, Djeliova V, Russev G (2005) Nuclear matrix support of DNA replication. J Cell Biochem 96: 951–961 [DOI] [PubMed] [Google Scholar]
- Boocock GR, Morrison JA, Popovic M, Richards N, Ellis L, Durie PR, Rommens JM (2003) Mutations in SBDS are associated with Shwachman--Diamond syndrome. Nat Genet 33: 97–101 [DOI] [PubMed] [Google Scholar]
- Braisted JC, Kuntumalla S, Vogel C, Marcotte EM, Rodrigues AR, Wang R, Huang ST, Ferlanti ES, Saeed AI, Fleischmann RD, Peterson SN, Pieper R (2008) The APEX Quantitative Proteomics Tool: generating protein quantitation estimates from LC-MS/MS proteomics results. BMC Bioinformatics 9: 529. [DOI] [PMC free article] [PubMed] [Google Scholar]
- Campos EI, Fillingham J, Li G, Zheng H, Voigt P, Kuo WH, Seepany H, Gao Z, Day LA, Greenblatt JF, Reinberg D (2010) The program for processing newly synthesized histones H3.1 and H4. Nat Struct Mol Biol 17: 1343–1351 [DOI] [PMC free article] [PubMed] [Google Scholar]
- Claeys KG, van der Ven PF, Behin A, Stojkovic T, Eymard B, Dubourg O, Laforet P, Faulkner G, Richard P, Vicart P, Romero NB, Stoltenburg G, Udd B, Fardeau M, Voit T, Fürst DO (2009) Differential involvement of sarcomeric proteins in myofibrillar myopathies: a morphological and immunohistochemical study. Acta Neuropathol 117: 293–307 [DOI] [PubMed] [Google Scholar]
- Coldwell MJ, Morley SJ (2006) Specific isoforms of translation initiation factor 4GI show differences in translational activity. Mol Cell Biol 26: 8448–8460 [DOI] [PMC free article] [PubMed] [Google Scholar]
- Coller HA (2007) What's taking so long? S-phase entry from quiescence versus proliferation. Nat Rev Mol Cell Biol 8: 667–670 [DOI] [PubMed] [Google Scholar]
- Conlon I, Raff M (2003) Differences in the way a mammalian cell and yeast cells coordinate cell growth and cell-cycle progression. J Biol 2: 7. [DOI] [PMC free article] [PubMed] [Google Scholar]
- Darzynkiewicz Z, Crissman H, Traganos F, Steinkamp J (1982) Cell heterogeneity during the cell cycle. J Cell Physiol 113: 465–474 [DOI] [PubMed] [Google Scholar]
- DeGregori J, Kowalik T, Nevins JR (1995) Cellular targets for activation by the E2F1 transcription factor include DNA synthesis- and G1/S-regulatory genes [published erratum appears in Mol Cell Biol 1995; 15(10): 5846--7]. Mol Cell Biol 15: 4215–4224 [DOI] [PMC free article] [PubMed] [Google Scholar]
- Dessau RB, Pipper CB (2008) [‘R’—project for statistical computing]. Ugeskr Laeger 170: 328–330 [PubMed] [Google Scholar]
- Diehn M, Alizadeh AA, Rando OJ, Liu CL, Stankunas K, Botstein D, Crabtree GR, Brown PO (2002) Genomic expression programs and the integration of the CD28 costimulatory signal in T cell activation. Proc Natl Acad Sci USA 99: 11796–11801 [DOI] [PMC free article] [PubMed] [Google Scholar]
- Dowling RJ, Topisirovic I, Alain T, Bidinosti M, Fonseca BD, Petroulakis E, Wang X, Larsson O, Selvaraj A, Liu Y, Kozma SC, Thomas G, Sonenberg N (2010) mTORC1-mediated cell proliferation, but not cell growth, controlled by the 4E-BPs. Science 328: 1172–1176 [DOI] [PMC free article] [PubMed] [Google Scholar]
- Dror Y, Ginzberg H, Dalal I, Cherepanov V, Downey G, Durie P, Roifman CM, Freedman MH (2001) Immune function in patients with Shwachman--Diamond syndrome. Br J Haematol 114: 712–717 [DOI] [PubMed] [Google Scholar]
- Dror Y, Squire J, Durie P, Freedman MH (1998) Malignant myeloid transformation with isochromosome 7q in Shwachman--Diamond syndrome. Leukemia 12: 1591–1595 [DOI] [PubMed] [Google Scholar]
- Fatica A, Tollervey D (2002) Making ribosomes. Curr Opin Cell Biol 14: 313–318 [DOI] [PubMed] [Google Scholar]
- Ferrai C, Naum-Ongania G, Longobardi E, Palazzolo M, Disanza A, Diaz VM, Crippa MP, Scita G, Blasi F (2009) Induction of HoxB transcription by retinoic acid requires actin polymerization. Mol Biol Cell 20: 3543–3551 [DOI] [PMC free article] [PubMed] [Google Scholar]
- Finch AJ, Hilcenko C, Basse N, Drynan LF, Goyenechea B, Menne TF, Gonzalez Fernandez A, Simpson P, D'Santos CS, Arends MJ, Donadieu J, Bellanné-Chantelot C, Costanzo M, Boone C, McKenzie AN, Freund SM, Warren AJ (2011) Uncoupling of GTP hydrolysis from eIF6 release on the ribosome causes Shwachman--Diamond syndrome. Genes Dev 25: 917–929 [DOI] [PMC free article] [PubMed] [Google Scholar]
- Gandin V, Miluzio A, Barbieri AM, Beugnet A, Kiyokawa H, Marchisio PC, Biffo S (2008) Eukaryotic initiation factor 6 is rate-limiting in translation, growth and transformation. Nature 455: 684–688 [DOI] [PMC free article] [PubMed] [Google Scholar]
- Gentleman RC, Carey VJ, Bates DM, Bolstad B, Dettling M, Dudoit S, Ellis B, Gautier L, Ge Y, Gentry J, Hornik K, Hothorn T, Huber W, Iacus S, Irizarry R, Leisch F, Li C, Maechler M, Rossini AJ, Sawitzki G et al. (2004) Bioconductor: open software development for computational biology and bioinformatics. Genome Biol 5: R80. [DOI] [PMC free article] [PubMed] [Google Scholar]
- Golas MM, Sander B, Will CL, Luhrmann R, Stark H (2003) Molecular architecture of the multiprotein splicing factor SF3b. Science 300: 980–984 [DOI] [PubMed] [Google Scholar]
- Horsey EW, Jakovljevic J, Miles TD, Harnpicharnchai P, Woolford JL Jr (2004) Role of the yeast Rrp1 protein in the dynamics of pre-ribosome maturation. RNA 10: 813–827 [DOI] [PMC free article] [PubMed] [Google Scholar]
- Hubbard TJ, Aken BL, Ayling S, Ballester B, Beal K, Bragin E, Brent S, Chen Y, Clapham P, Clarke L, Coates G, Fairley S, Fitzgerald S, Fernandez-Banet J, Gordon L, Graf S, Haider S, Hammond M, Holland R, Howe K et al. (2009) Ensembl 2009. Nucleic Acids Res 37: D690–D697 [DOI] [PMC free article] [PubMed] [Google Scholar]
- Huber W, von Heydebreck A, Sultmann H, Poustka A, Vingron M (2002) Variance stabilization applied to microarray data calibration and to the quantification of differential expression. Bioinformatics 18(Suppl 1): S96–104 [DOI] [PubMed] [Google Scholar]
- Jain J, Loh C, Rao A (1995) Transcriptional regulation of the IL-2 gene. Curr Opin Immunol 7: 333–342 [DOI] [PubMed] [Google Scholar]
- Keller A, Eng J, Zhang N, Li XJ, Aebersold R (2005) A uniform proteomics MS/MS analysis platform utilizing open XML file formats. Mol Syst Biol 1: 0017. [DOI] [PMC free article] [PubMed] [Google Scholar]
- Keller A, Nesvizhskii AI, Kolker E, Aebersold R (2002) Empirical statistical model to estimate the accuracy of peptide identifications made by MS/MS and database search. Anal Chem 74: 5383–5392 [DOI] [PubMed] [Google Scholar]
- Krude T, Musahl C, Laskey RA, Knippers R (1996) Human replication proteins hCdc21, hCdc46 and P1Mcm3 bind chromatin uniformly before S-phase and are displaced locally during DNA replication. J Cell Sci 109 (Part 2): 309–318 [DOI] [PubMed] [Google Scholar]
- Lea NC, Orr SJ, Stoeber K, Williams GH, Lam EW-F, Ibrahim MAA, Mufti GJ, Thomas NSB (2003) Commitment point during G0->G1 that controls entry into the cell cycle. Mol Cell Biol 23: 2351–2361 [DOI] [PMC free article] [PubMed] [Google Scholar]
- Lee DW, Zhang K, Ning ZQ, Raabe EH, Tintner S, Wieland R, Wilkins BJ, Kim JM, Blough RI, Arceci RJ (2000) Proliferation-associated SNF2-like gene (PASG): a SNF2 family member altered in leukemia. Cancer Res 60: 3612–3622 [PubMed] [Google Scholar]
- Lee I, Blom M, Wang PI, Shim JE, Marcotte EM (2011a) Prioritizing candidate disease genes by network guilt-by-association of genome-wide association data. 21: 1109–1121 [DOI] [PMC free article] [PubMed]
- Lee I, Blom UM, Wang PI, Shim JE, Marcotte EM (2011b) Prioritizing candidate disease genes by network-based boosting of genome-wide association data. Genome Res 21: 1109–1121 [DOI] [PMC free article] [PubMed] [Google Scholar]
- Liu JO (2005) The yins of T cell activation. Sci STKE 2005: re1. [DOI] [PubMed] [Google Scholar]
- Lu P, Vogel C, Wang R, Yao X, Marcotte EM (2007) Absolute protein expression profiling estimates the relative contributions of transcriptional and translational regulation. Nat Biotechnol 25: 117–124 [DOI] [PubMed] [Google Scholar]
- Menne TF, Goyenechea B, Sanchez-Puig N, Wong CC, Tonkin LM, Ancliff PJ, Brost RL, Costanzo M, Boone C, Warren AJ (2007) The Shwachman-Bodian-Diamond syndrome protein mediates translational activation of ribosomes in yeast. Nat Genet 39: 486–495 [DOI] [PubMed] [Google Scholar]
- Miluzio A, Beugnet A, Grosso S, Brina D, Mancino M, Campaner S, Amati B, de Marco A, Biffo S (2011) Impairment of cytoplasmic eIF6 activity restricts lymphomagenesis and tumor progression without affecting normal growth. Cancer Cell 19: 765–775 [DOI] [PubMed] [Google Scholar]
- Miron M, Verdu J, Lachance PE, Birnbaum MJ, Lasko PF, Sonenberg N (2001) The translational inhibitor 4E-BP is an effector of PI(3)K/Akt signalling and cell growth in Drosophila. Nat Cell Biol 3: 596–601 [DOI] [PubMed] [Google Scholar]
- Misteli T (2004) Spatial positioning; a new dimension in genome function. Cell 119: 153–156 [DOI] [PubMed] [Google Scholar]
- Montagne J, Stewart MJ, Stocker H, Hafen E, Kozma SC, Thomas G (1999) Drosophila S6 kinase: a regulator of cell size. Science 285: 2126–2129 [DOI] [PubMed] [Google Scholar]
- Mosmann TR, Cherwinski H, Bond MW, Giedlin MA, Coffman RL (1986) Two types of murine helper T cell clone. I. Definition according to profiles of lymphokine activities and secreted proteins. J Immunol 136: 2348–2357 [PubMed] [Google Scholar]
- Nave BT, Ouwens M, Withers DJ, Alessi DR, Shepherd PR (1999) Mammalian target of rapamycin is a direct target for protein kinase B: identification of a convergence point for opposing effects of insulin and amino-acid deficiency on protein translation. Biochem J 344 (Part 2): 427–431 [PMC free article] [PubMed] [Google Scholar]
- Nesvizhskii AI, Keller A, Kolker E, Aebersold R (2003) A statistical model for identifying proteins by tandem mass spectrometry. Anal Chem 75: 4646–4658 [DOI] [PubMed] [Google Scholar]
- Nickerson J (2001) Experimental observations of a nuclear matrix. J Cell Sci 114: 463–474 [DOI] [PubMed] [Google Scholar]
- Ohanna M, Sobering AK, Lapointe T, Lorenzo L, Praud C, Petroulakis E, Sonenberg N, Kelly PA, Sotiropoulos A, Pende M (2005) Atrophy of S6K1(−/−) skeletal muscle cells reveals distinct mTOR effectors for cell cycle and size control. Nat Cell Biol 7: 286–294 [DOI] [PubMed] [Google Scholar]
- Olave IA, Reck-Peterson SL, Crabtree GR (2002) Nuclear actin and actin-related proteins in chromatin remodeling. Annu Rev Biochem 71: 755–781 [DOI] [PubMed] [Google Scholar]
- Orr SJ, Gaymes T, Ladon D, Chronis C, Czepulkowski B, Wang R, Mufti GJ, Marcotte EM, Thomas NS (2010) Reducing MCM levels in human primary T cells during the G(0) → G(1) transition causes genomic instability during the first cell cycle. Oncogene 29: 3803–3814 [DOI] [PMC free article] [PubMed] [Google Scholar]
- Otten J, van der Ven PF, Vakeel P, Eulitz S, Kirfel G, Brandau O, Boesl M, Schrickel JW, Linhart M, Hayess K, Naya FJ, Milting H, Meyer R, Fürst DO (2010) Complete loss of murine Xin results in a mild cardiac phenotype with altered distribution of intercalated discs. Cardiovasc Res 85: 739–750 [DOI] [PubMed] [Google Scholar]
- Pacholsky D, Vakeel P, Himmel M, Lowe T, Stradal T, Rottner K, Furst DO, van der Ven PF (2004) Xin repeats define a novel actin-binding motif. J Cell Sci 117: 5257–5268 [DOI] [PubMed] [Google Scholar]
- Percipalle P, Jonsson A, Nashchekin D, Karlsson C, Bergman T, Guialis A, Daneholt B (2002) Nuclear actin is associated with a specific subset of hnRNP A/B-type proteins. Nucleic Acids Res 30: 1725–1734 [DOI] [PMC free article] [PubMed] [Google Scholar]
- Percipalle P, Raju CS, Fukuda N (2009) Actin-associated hnRNP proteins as transacting factors in the control of mRNA transport and localization. RNA Biol 6: 171–174 [DOI] [PubMed] [Google Scholar]
- Ramirez-Valle F, Braunstein S, Zavadil J, Formenti SC, Schneider RJ (2008) eIF4GI links nutrient sensing by mTOR to cell proliferation and inhibition of autophagy. J Cell Biol 181: 293–307 [DOI] [PMC free article] [PubMed] [Google Scholar]
- Rosenwald IB, Rhoads DB, Callanan LD, Isselbacher KJ, Schmidt EV (1993) Increased expression of eukaryotic translation initiation factors eIF-4E and eIF-2 alpha in response to growth induction by c-myc. Proc Natl Acad Sci USA 90: 6175–6178 [DOI] [PMC free article] [PubMed] [Google Scholar]
- Shahbazian D, Parsyan A, Petroulakis E, Hershey J, Sonenberg N (2010a) eIF4B controls survival and proliferation and is regulated by proto-oncogenic signaling pathways. Cell Cycle 9: 4106–4109 [DOI] [PMC free article] [PubMed] [Google Scholar]
- Shahbazian D, Parsyan A, Petroulakis E, Topisirovic I, Martineau Y, Gibbs BF, Svitkin Y, Sonenberg N (2010b) Control of cell survival and proliferation by mammalian eukaryotic initiation factor 4B. Mol Cell Biol 30: 1478–1485 [DOI] [PMC free article] [PubMed] [Google Scholar]
- Simon DN, Zastrow MS, Wilson KL (2010) Direct actin binding to A- and B-type lamin tails and actin filament bundling by the lamin A tail. Nucleus 1: 264–272 [DOI] [PMC free article] [PubMed] [Google Scholar]
- Thomas NS, Burke LC, Bybee A, Linch DC (1991) The phosphorylation state of the retinoblastoma (RB) protein in G0/G1 is dependent on growth status. Oncogene 6: 317–322 [PubMed] [Google Scholar]
- Thomas NS, Pizzey AR, Tiwari S, Williams CD, Yang J (1998) p130, p107, and pRb are differentially regulated in proliferating cells and during cell cycle arrest by alpha-interferon. J Biol Chem 273: 23659–23667 [DOI] [PubMed] [Google Scholar]
- Thomas NSB (2004) Cell cycle regulation. In Textbook of Malignant Haematology, Degos L, Griffin JD, Linch DC, Lowenberg B (eds), pp 33–63. London: Martin Dunitz [Google Scholar]
- Valenzuela DM, Chaudhuri A, Maitra U (1982) Eukaryotic ribosomal subunit anti-association activity of calf liver is contained in a single polypeptide chain protein of Mr=25 500 (eukaryotic initiation factor 6). J Biol Chem 257: 7712–7719 [PubMed] [Google Scholar]
- van der Ven PF, Ehler E, Vakeel P, Eulitz S, Schenk JA, Milting H, Micheel B, Furst DO (2006) Unusual splicing events result in distinct Xin isoforms that associate differentially with filamin c and Mena/VASP. Exp Cell Res 312: 2154–2167 [DOI] [PubMed] [Google Scholar]
- van Leeuwen JE, Samelson LE (1999) T cell antigen-receptor signal transduction. Curr Opin Immunol 11: 242–248 [DOI] [PubMed] [Google Scholar]
- van Oers NS (1999) T cell receptor-mediated signs and signals governing T cell development. Semin Immunol 11: 227–237 [DOI] [PubMed] [Google Scholar]
- Vogel C, Marcotte EM (2008) Calculating absolute and relative protein abundance from mass spectrometry-based protein expression data. Nat Protoc 3: 1444–1451 [DOI] [PubMed] [Google Scholar]
- Volta V, Ceci M, Emery B, Bachi A, Petfalski E, Tollervey D, Linder P, Marchisio PC, Piatti S, Biffo S (2005) Sen34p depletion blocks tRNA splicing in vivo and delays rRNA processing. Biochem Biophys Res Commun 337: 89–94 [DOI] [PubMed] [Google Scholar]
- Washburn MP, Wolters D, Yates JR 3rd (2001) Large-scale analysis of the yeast proteome by multidimensional protein identification technology. Nat Biotechnol 19: 242–247 [DOI] [PubMed] [Google Scholar]
- Will CL, Schneider C, Reed R, Luhrmann R (1999) Identification of both shared and distinct proteins in the major and minor spliceosomes. Science 284: 2003–2005 [DOI] [PubMed] [Google Scholar]
- Woods WG, Roloff JS, Lukens JN, Krivit W (1981) The occurrence of leukemia in patients with the Shwachman syndrome. J Pediatr 99: 425–428 [DOI] [PubMed] [Google Scholar]
- Zetterberg A (1996) Cell growth and cell cycle progression in mammalian cells. In Apoptosis and Cell Cycle Control in Cancer,, Thomas NSB (ed) pp 17–36. Oxford, UK: Bios Scientific Publishers Ltd [Google Scholar]
- Zhao K, Wang W, Rando OJ, Xue Y, Swiderek K, Kuo A, Crabtree GR (1998) Rapid and phosphoinositol-dependent binding of the SWI/SNF-like BAF complex to chromatin after T lymphocyte receptor signaling. Cell 95: 625–636 [DOI] [PubMed] [Google Scholar]
- Zheng B, Han M, Bernier M, Wen JK (2009) Nuclear actin and actin-binding proteins in the regulation of transcription and gene expression. FEBS J 276: 2669–2685 [DOI] [PMC free article] [PubMed] [Google Scholar]
- Zink D, Fischer AH, Nickerson JA (2004) Nuclear structure in cancer cells. Nat Rev 4: 677–687 [DOI] [PubMed] [Google Scholar]
Associated Data
This section collects any data citations, data availability statements, or supplementary materials included in this article.
Supplementary Materials
The contents are listed in the Table of Contents on the first two pages of this file