

Abstract
The RNA interference (RNAi) pathway can be exploited using short hairpin RNAs (shRNAs) to durably inactivate pathogenic genes. Prediction of optimal target sites is notoriously inaccurate and current approaches applied to HIV-1 show weak correlations with virus inhibition. In contrast, using a high-content model for disrupting pre-existing intramolecular structure in the HIV-1 RNA, as achievable using high-resolution SHAPE (selective 2′-hydroxyl acylation analyzed by primer extension) chemical probing information, we discovered strong correlations between inhibition of HIV-1 production in a quantitative cell-based assay and very simple thermodynamic features in the target RNA. Strongest inhibition occurs at RNA target sites that both have an accessible “seed region” and, unexpectedly, are structurally accessible in a newly identified downstream flanking sequence. We then used these simple rules to create a new set of shRNAs and achieved inhibition of HIV-1 production of 90% or greater for up to 82% of designed shRNAs. These shRNAs inhibit HIV-1 replication in therapy-relevant T cells and show no or low cytotoxicity. The remarkable success of this straightforward SHAPE-based approach emphasizes that RNAi is governed, in significant part, by very simple, predictable rules reflecting the underlying RNA structure and illustrates principles likely to prove broadly useful in understanding transcriptome-scale biological recognition and therapeutics involving RNA.
Introduction
Interactions between RNAs and molecular ligands, proteins, and other RNAs govern numerous cellular regulatory processes. These targeting and binding events are strongly influenced by the structure of the target RNA.1 One biologically and clinically important example of intermolecular interactions between RNAs involves the RNA interference (RNAi) pathway.2 The RNAi pathway regulates gene expression in organisms from plants to humans3 and immune defense via destruction of pathogenic RNAs.4 This pathway can be exploited to destroy pathogenic RNAs using synthetic short interfering RNA (siRNA) or short hairpin RNA (shRNA) expression vectors.5 The ~19 nucleotide (nt) guide strands generated from cellular transcripts or synthetic RNAs are loaded into the RNA-induced silencing complex (RISC). Base complementarity between the guide strand and target RNA signals the Argonaute protein in RISC to cleave the target RNA. Both siRNA and shRNA approaches have been used successfully to inhibit HIV-1 production and replication in cell culture.6,7,8
The pathways for incorporation of siRNAs into RISC and their recognition of RNA targets are complex and not all sequences can be targeted efficiently. Most randomly selected sequences are not efficiently repressed by siRNAs or shRNAs directed against them.6,9 Accurate identification of repressible sequences remains an unmet challenge that has motivated the development of a wide variety of target selection algorithms.9,10,11,12,13,14,15,16,17,18,19,20,21,22 Most algorithms were developed for selection of siRNAs and are usually assumed to apply to shRNA design, although there is evidence that siRNA and shRNA prediction require distinct, but overlapping, rules.23,24 Degradation of transfected siRNAs in vivo makes them primarily suitable for short-term clinical applications, such as the treatment of acute infection. In contrast, for stable, long-term suppression as likely required for chronic infections, including HIV-1, we are especially interested in understanding the rules that govern shRNA-directed inhibition.
ter Brake et al.6 reported the ability of 84 shRNA constructs to inhibit HIV-1 production in cell culture. This set of inhibitors was attractive as a training dataset because it was developed without using any si/shRNA selection rules. With a view towards potential therapeutic applications, shRNAs were instead chosen based on sequence conservation in the HIV-1 RNA. In addition, viral inhibition was assessed at low, generally subsaturating, shRNA transfection levels. As a result, viral inhibition levels achieved by these shRNAs spanned a wide range of inhibition levels.
Correlations between virus production inhibition by shRNAs in this dataset6 and rankings given by previously described prediction algorithms9,12,14,15,16,17,18,19,20,21 are generally poor. This poor performance includes algorithms both that consider sequence signatures in the target RNA sequence and that additionally incorporate thermodynamic metrics to identify favorable interactions between an si/shRNA and its target (Table 1).
Table 1. Correlation between HIV-1 inhibition and si/shRNA target prediction algorithms.
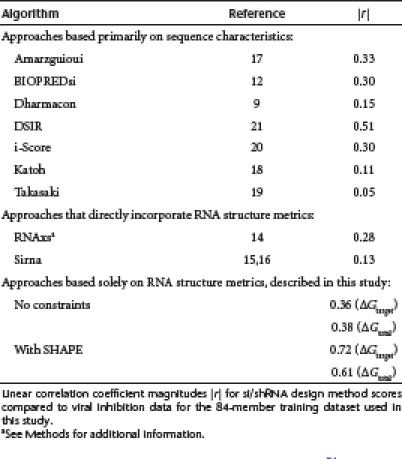
We therefore sought to explore whether nucleotide-resolution information about an RNA target structure might make it possible to design potent shRNA inhibitors efficiently. We show that, if the underlying RNA structure is known with good accuracy, very simple thermodynamics-based rules yield excellent predictions for highly potent shRNA inhibitors of HIV-1 replication. Our prediction accuracy exceeds all current approaches when applied to the HIV-1 RNA genome, a notable result given that the rules developed in this work are much simpler than alternative approaches. In broad terms, this work shows how profoundly RNA structure influences biological function and emphasizes the importance of developing high-content models for an RNA fold to understand RNA-based therapeutics and biological mechanisms.
Results
Strategy
To derive new rules for designing shRNA inhibitors, we focused on one of the simplest possible models for the thermodynamics of the guide strand-HIV RNA target interaction. In this model (Figure 1), the unstructured guide strand binds to a complementary region of the target RNA to form the guide strand-target duplex. We assumed that protein contacts with RISC maintained the guide strand in a single-stranded conformation, poised to interact with the target RNA. This equilibrium is thus described by a free energy change, ΔGduplex, and is calculated using nearest neighbor-thermodynamic rules.25,26 ΔGduplex depends only on the RNA sequence and is independent of RNA structure because the unstructured guide strand is assumed to interact with a fully unfolded site in the target RNA.
Figure 1.

The guide strand-target RNA interaction equilibrium. RISC Argonaute protein is represented by an orange oval, although only RNA–RNA thermodynamics were considered in this study. RISC, RNA-induced silencing complex.
In reality, the target RNA folds back on itself to form base paired secondary (and higher order) structures. Thus, a prerequisite for effective binding by RISC is that a site in the target RNA be unfolded to allow interaction with the guide strand. The strength of these pre-existing interactions is termed ΔGtarget (Figure 1). We consider a very simple model in which ΔGduplex and ΔGtarget dominate the equilibrium for forming a putative guide strand-target RNA interaction. The total free energy change ΔGtotal of the interaction reflects a favorable contribution from duplex formation and the unfavorable cost of disrupting pre-existing structures in the target RNA:
In contrast to ΔGduplex, which is independent of RNA structure, accurate calculation of the free energy change required to unfold the target RNA (ΔGtarget) depends critically on the RNA structure model. Conventional thermodynamics-based RNA secondary structure prediction algorithms typically attain accuracies of 50–70%; accuracies are at the lower end of this range as RNA length increases.26,27 This level of accuracy provides a helpful overall glimpse of an RNA structure but, in the context of HIV-1 inhibition by shRNAs, is insufficient for consistent prediction of optimal guide strand binding sites (Table 1). Secondary structure predictions can be improved dramatically by incorporating additional experimental information. In particular, nucleotide-resolution measurements of molecular structure obtained from SHAPE (selective 2′-hydroxyl acylation analyzed by primer extension) chemical probing experiments28,29 can be incorporated as pseudo-free energy corrections into a thermodynamics-based RNA folding algorithm.30 The resulting RNA secondary structure models are generally highly accurate even for RNAs on the kilobase scale.27 We therefore used a SHAPE-directed secondary structure model of an entire ~9 kb HIV-1 genome31 to calculate ΔGtarget.
Concentration dependence of shRNA inhibition
Ideally, RNAi-mediated knockdown of a target gene should be accomplished using the lowest effective concentration of shRNA, for two reasons. First, the RNAi pathway contains a finite complement of protein mediators, which can become saturated by the expression of large amounts of exogenous siRNA. Such saturation is thought to be an important cause of off-target effects and of general cell toxicity.32,33 Second, artificial production of large amounts of guide strand-RISC complexes can increase targeting of suboptimal sequences and thus obscure important physiological differences in targetability.
We therefore sought to determine the minimum level of transfected shRNA-encoding plasmid that achieved inhibition of HIV-1 production in our cell-based assay.6 We titrated plasmids expressing five shRNA sequences over the range from 1 to 125 ng (Figure 2). Individual shRNAs differ significantly in their ability to inhibit HIV-1 production and inhibition by a given shRNA increased as amount of transfected plasmid increased. All five shRNA sequences tested showed significantly stronger inhibition at 125 ng transfected plasmid versus 25 ng plasmid. In this work, we use 25 ng transfected plasmid because this amount showed a high level of knockdown for optimal sequences, was subsaturating in our experimental system, and is therefore most appropriate for facilitating accurate identification of highly potent shRNAs.
Figure 2.

Relative levels of virus production for five shRNAs. shRNA-encoding plasmids were transfected into 293T cells in amounts ranging from 1 to 125 ng per well. Each shRNA is labeled by the first nucleotide position of its binding site on the NL4-3 HIV-1 messenger RNA (see Supplementary Table S1).
Weak target folding energy characterizes effectively repressed sequences
Local accessibility has been shown to be an important determinant for efficient si/shRNA-mediated knockdown of a target gene14,16,34,35,36,37 (see ΔGtarget, Figure 1). However, it is not obvious precisely which portion of the target RNA sequence needs to be accessible, or unfolded. An unfolding window is characterized by two parameters: its size and position. We calculated the free energy change, ΔGtarget, of base pair formation in the SHAPE-based HIV-1 RNA structure31 as a function of window size and position. We then calculated the linear correlation coefficient, r, between these ΔGtarget values and the experimental viral production inhibition values obtained by ter Brake et al.6 for each of the 84 shRNAs in the training set (Figure 3 and Supplementary Table S1). The magnitudes of the correlation coefficients quantify the strength of the ΔGtarget metric for predicting inhibition, whereas the window size and position parameters identify the target RNA window that should be unstructured for optimal shRNA-mediated inhibition (Figure 4 and Supplementary Table S2).
Figure 3.

HIV-1 genome locations of the 84 target sequences for the shRNAs in the ter Brake et al. dataset6 used to derive design rules (top) and of the 26 sequences, designed by the rules defined in this work (bottom). Numbers indicate the position of the 5′ nucleotide of each shRNA target site in the HIV-1 NL4-3 messenger RNA.
Figure 4.

Correlation coefficients (r) between calculated target folding energies, ΔGtarget, and experimental activity values for the 84 shRNAs in the training dataset. (a) Linear r-values as a function of target unfolding window size (vertical axis) and position (horizontal axis). Colors denote the relative strength of the correlation. A white box highlights the strongest correlation. (b) Optimal accessible target window. Window positions are numbered relative to the 5′ end of the guide strand binding site on the target RNA. The window size denotes the length of the window extending downstream of the window position value. The accessible target window that yielded the strongest correlation is shown by a gray rectangle.
The strongest correlation was obtained for a 13-nt window that begins at position 14 of the target RNA (Figure 4a, white box) and has an r-value of -0.72 (Figure 5a). The negative correlation confirmed that more readily unfolded, or less structured, target windows were more readily silenced. The first 5–6 nts of the position window overlapped closely with the “seed region”, the guide strand sequence that interacts initially with the target RNA before complete unfolding of the target to form the ~19-nt long duplex38 (Figure 1).
Figure 5.

Relative viral production versus (a) target folding energies, ΔGtarget, and (b) total binding energies, ΔGtotal, for the 84 shRNAs in the training dataset. The optimal target unfolding window, identified in Figure 4, was used for ΔGtarget calculations. The SHAPE-directed HIV-1 secondary structure model31 was used to calculate ΔGtarget. The same correlations for (c) ΔGtarget and (d) ΔGtotal calculated without using experimental constraints to estimate the secondary structure.
Unexpectedly, the 13-nt window also extended seven nucleotides beyond the 3′ end of the target RNA binding site (Figure 4b, gray box). This indicates that the most effectively targeted RNA sequences are characterized by a 13-nt unstructured window that includes the seed region binding site and a previously unrecognized requirement that extends ~7 additional nucleotides beyond the region directly bound by the guide strand in RISC.
Strong total binding energy characterizes effectively repressed sequences
The formation of a ~19-nt duplex between guide strand nucleotides target is required for proper recognition and subsequent cleavage of the target by RISC Argonaute proteins. We estimated the strength of this binding as the overall binding free energy ΔGtotal of the complete 19-nt interface. We then computed the correlation between ΔGtotal and viral production inhibition for each of the shRNAs in the training set. Total binding energy correlated strongly with shRNA inhibition (r = 0.61) (Figure 5b).
Strong thermodynamic correlations are specific to the SHAPE-directed RNA structure model
Strong correlations between HIV-1 inhibition and the energetic cost of disrupting pre-existing structures in the viral RNA (ΔGtarget) and for overall strength of guide strand binding (ΔGtotal) were obtained when these free energies were calculated using the experimentally supported model for an HIV-1 genomic RNA.31 This model was obtained using authentic genomic RNA gently extracted from virions and was used to represent structures at any targetable stage in the HIV-1 replication cycle. This SHAPE-directed model shares only ~45% of base pairs with a model obtained using the same nearest-neighbor parameters but without experimental data (data not shown).
Using the structure predicted without experimental SHAPE constraints, we obtained much weaker correlations between viral inhibition and any simple thermodynamic metric for guide strand interaction (Supplementary Table S3). The correlations between viral production values for the training set shRNAs and ΔGtarget calculated for the 13-nt window or for ΔGtotal, which includes the guide strand-target duplex formation interaction, had modest r-values of -0.36 and +0.38, respectively (Figure 5c,d). These correlations, although poor, are actually at the higher end relative to current si/shRNA prediction algorithms (Table 1), even though these later approaches use more complex rules than the very simple thermodynamic approach outlined here (Figure 1).
These results emphasize that target RNA secondary structure plays a profound role in RNAi activity, that current thermodynamics-only calculations do not recapitulate this contribution, and that SHAPE-directed secondary structure prediction provides significant additional information.
Experimental validation of shRNA design rules
The strong correlations between inhibition of viral production and ΔGtarget and ΔGtotal, calculated using the SHAPE-derived secondary structure for HIV-1 (Figure 5a,b), suggest two remarkably simple rules for shRNA design. First, the target RNA in the newly defined, optimal 13-nt window should have minimal pre-existing structure. Second, the total binding energy for the guide strand-target RNA interaction should be strong. We tested these two rules by designing a new, independent set of shRNA inhibitors and measured their ability to inhibit HIV-1 viral production. We calculated ΔGtarget and ΔGtotal for all possible 19-nt sequences in the 9,173 nt NL4-3 HIV-1 genome and initially required ΔGtarget to be greater than or equal to 0 kcal/mol and ΔGtotal to be less than -25 kcal/mol. Approximately 500 sequences (~5% of all possible 19-mers) satisfied these two rules. Of these, we tested 26 randomly selected sequences (Figure 3, bottom; and Supplementary Table S4).
The percentages of shRNAs that achieved a defined level of HIV-1 inhibition were calculated for the initial training set and for the independently designed test sequences (Figure 6a). Strikingly, 23 of the 26 shRNAs (88%) selected based on our rules reduced HIV-1 production by a factor of two or more. Moreover, this simple thermodynamics-based approach was especially successful at identifying highly potent inhibitors: 54% (14/26) of the designed shRNAs inhibited viral production by 90% or greater (see -25 kcal/mol data, Figure 6a). Very simple thermodynamics-based selection rules thus yielded a dramatic improvement in selection of potent shRNAs (compare Figure 6a,b).
Figure 6.

Prediction success rates of designed shRNAs. (a) Inhibition of HIV-1 production by shRNAs in the test set. Target sequences were chosen to have accessible 13-nucleotide windows (ΔGtarget ≥0 kcal/mol) and strong overall binding energy ΔGtotal. Prediction success rates are shown for ΔGtotal criteria of -25, -27, and -29 kcal/mol; n, the numbers of shRNAs meeting a given threshold. (b) Inhibition of HIV-1 production by shRNAs in the 84-member training set. (c) Prediction success rates for 16 shRNAs that failed the target accessibility criterion. ΔGtarget <0 corresponds to RNA target sites with some pre-existing structure.
The total binding energy plays a major role in governing shRNA inhibition. Increasing the stringency of ΔGtotal from -25 to -27 and to -29 kcal/mol yields a monotonic increase in prediction success of the most potent shRNA inhibitors in the test set (Figure 6a). At the -29 kcal/mol threshold, 82% (9/11) of designed shRNAs inhibit viral production by 90% or greater (Figure 6a). In the HIV-1 genome, only about 2% of 19-mers are both completely accessible in the 13-nt optimal window and bind at the ≤ -29 kcal/mol threshold.
To further evaluate the importance of the target accessibility rule, we also assayed 16 shRNAs that had total binding energies < -25 kcal/mol but did not conform to the rules developed here because they had nonzero target folding energies in the optimal 13-nt window. Of these sequences, 56% (9/16) reduce HIV-1 viral production by a factor of two or more but only one of the 16 shRNAs (6%) resulted in highly potent, greater than 90%, inhibition (Figure 6c). Poor inhibition by these sequences emphasizes the importance of an accessible optimal target window for potent RNAi-mediated repression.
shRNA repression and toxicity in human T cells
Measuring shRNA-mediated inhibition by the 293T cell transfection assay used in this study is advantageous because of its quantitative accuracy. However, an shRNA-based HIV-1 therapeutic will need to be effective in natural host immune cells. We therefore used a lentiviral vector to stably transduce a human T cell line, SupT1, with single copies of eight selected shRNA expression constructs identified in our test set. Cells were subsequently challenged with low and high doses of HIV-1 and the durability of inhibition was monitored (Supplementary Figure S1). In all cultures, HIV-1 replication was either completely inhibited or was significantly delayed by shRNA expression, whereas HIV-1 replicated efficiently on cells transduced with the empty JS1 vector.
A key concern for therapeutic shRNA use is the potential for stimulating unintended off-target and cytotoxic effects. To quantify these effects, we transduced SupT1 cells with lentiviral constructs expressing this same set of shRNAs and measured the impact of lentiviral vector integration and shRNA expression using a competitive cell growth assay.39 No negative effect was caused by integration of the empty lentiviral vector, as observed previously.39 Of the shRNA constructs from our test set that were evaluated (Supplementary Figure S2), we observed no effects for shRNAs 1033, 1876, 4308, 4610, and 8302, and only minimal effects on SupT1 cell growth for shRNAs 8220 and 8221. Only one shRNA (4384) caused a significant reduction in cell growth (of ~4.5%).
In sum, shRNAs identified in the quantitative cell-based assay using 293T cells (Figure 6) also inhibit HIV-1 replication when stably transduced into T cells (Supplementary Figure S1) and generally show no or minimal impairment of cellular replication (Supplementary Figure S2).
Partial SHAPE information is sufficient to identify potent shRNA inhibitors
The requirement for performing SHAPE to develop a high-content secondary structure model is the experimental cost of this approach for accurate shRNA design. SHAPE is rapidly becoming easier to perform and, with current mature technologies, it is straightforward to obtain structural data for ~500 nts.29 We thus evaluated whether obtaining partial SHAPE information might be sufficient to identify potent shRNA inhibitors. Prior experience emphasizes that there can be very strong “end effects” in RNA folding such that incorrect definition of the 5′ and 3′ ends of an RNA can cause large refolding at internal sequences. We therefore used SHAPE data from two 500-nt regions, each flanked by 1,000 additional nucleotides of HIV-1 sequence in our folding analysis. Two test regions were chosen based on their spanning the largest number of shRNAs in our test set. We folded each of the two 2,500 nt regions (spanning nts 601–3,100 and 3,201–5,700), using SHAPE data for only the central 500 nts (1,601–2,100 and 4,200–4,700). We then calculated the resulting free energies, ΔGtarget and ΔGtotal, for the test shRNAs in these regions. The energy values obtained using these partial folds are similar to energies obtained when using the complete genome model. In contrast, the structural models obtained without using SHAPE constraints yield free energy values that agree poorly with the SHAPE-directed models (Supplementary Table S5). This analysis suggests that shRNA design is significantly improved through the inclusion of partial SHAPE data for a large RNA.
Discussion
Essentially all recognition processes involving RNA are critically dependent on the underlying base paired secondary (and higher-order tertiary) structure. The central role of accessibility at single target sites is well established for RNAi-mediated knockdown.14,16,34,35,36,37 Correspondingly, siRNA and shRNA prediction methods often incorporate estimates of target site accessibility into their algorithms. However, the structure of a long target RNA is generally incompletely understood a priori and the resulting correlations between predicted and effective si/shRNAs are often poor (Table 1). Given this difficulty, newer algorithms have tended to become more complex and to meld thermodynamic calculations with sequence signature and heuristic rules. However, these rules, applied to shRNA-mediated inhibition of HIV-1 production, do not consistently identify potent inhibitors.
In this work, we find that an extremely simple approach, involving the calculation of two straightforward thermodynamic terms, significantly outperforms existing approaches when applied to inhibition of HIV-1 (Table 1). Our model considered only two simple RNA–RNA interactions central to the RISC ribonucleoprotein machinery (Figure 1). Strong inhibition correlated with weak free energies of target folding (r = -0.72) within an optimal 13-nt window (Figure 4b, gray bar) and with strong total binding energy (r = 0.61). These correlations were much weaker when SHAPE data was not used to direct calculation of the target HIV-1 RNA secondary structure model (Figure 5 and Table 1), highlighting the requirement for an accurate target RNA structure in selection of shRNAs.
The correlation coefficient for our total binding energy metric is moderately weaker than that for the target folding energy metric (|r| = 0.61 versus 0.72, respectively). However, requiring stronger ΔGtotal improves the prediction success rate for sequences containing an optimal, fully accessible target window. In addition, sequences with strong ΔGtotal but less accessible optimal target windows were rarely potently repressed (Figure 6c). Thus, a completely accessible optimal window appears critical for efficient repression and, once this condition is met, strong total binding energy improves prediction accuracies.
The correlations are consistent with models of target RNA association with the guide strand that involve an initial interaction with the seed region, followed by propagation to form a duplex containing all guide strand nucleotides (Figure 1).38,40,41 Our data also identify a previously unrecognized feature in which the optimal accessible target window extends seven nucleotides downstream of the seed region binding site (Figure 4). The required lack of secondary structure in this region of the target RNA may reflect unexplored interactions involving protein components of RISC.
Many RNAi design criteria are based on specific sequence signatures found more frequently in effectively repressed shRNA targets. Some of these signatures are consistent with the results of the present study. In particular, the observed preference for (more weakly pairing) A/U nucleotides at the 3′ end of the target binding interface,9,42,43 sometimes termed the asymmetry rule, likely corresponds to a qualitative sequence signature for an accessible seed region, which we quantify as ΔGtarget. Our work emphasizes that strong correlations can be obtained using structure-based thermodynamic metrics without considering sequence characteristics, and likely reflects a more direct physical basis for observed sequence effects.
In designing shRNAs to test our two structure-based design principles, we ignored other design criteria. Consequently, many of our successful test shRNAs violate sequence-based si/shRNA design principles identified in previous studies. These include having an A/U at position 10 of the guide strand to facilitate cleavage at this site44 and avoidance of consecutive runs of identical nucleotides. Nevertheless, our tested shRNAs achieved highly potent HIV-1 inhibition (Figure 6a), suggesting that these sequence-based design rules have limited applicability in this system.
There were two distinctive features of this study that may explain differences, and the relative success of our simple approach, as compared to prior work.
First, several prediction algorithms have emphasized the role of pre-existing target RNA structure in reducing RNAi efficiency14,15,16,22 and have obtained good siRNA predictions in the systems studied. However, we find that these measures of target accessibility do not correlate with shRNA-mediated knockdown for the training dataset used in our study (Table 1). The importance of structural accessibility and for an accurate model of secondary structure in the target RNA may vary with the targeted system and it appears to be especially critical in the context of shRNA-mediated inhibition of the highly structured31 HIV-1 RNA genome.
Second, RNAi-mediated knockdown is highly sensitive to the effective concentration of the si/shRNA. Higher concentrations of shRNA yield increased inhibition (Figure 2 and ref. 8) but also potentially contribute to saturation of the RNAi machinery, yield off-target effects, and stimulate cytotoxic innate immune responses.32,33 We therefore focused on shRNA-mediated inhibition at subsaturating amounts of transfected shRNA constructs. Importantly, when we probed cytotoxic effects induced by shRNA transduction of SupT1 T cells using a sensitive competitive cell growth assay,39 we found that all but one designed shRNA showed no or minimal reduction in cell growth.
The use of subsaturating shRNA amounts may also permit the simultaneous expression of several different shRNAs and thereby reduce the chance of developing escape mutants. This is an especially important consideration for clinical applications when targeting rapidly mutating viruses such as HIV-1 with RNAi-based gene therapies.45,46 Potential shRNA-based therapeutics will have to function in human T cells, the natural HIV-1 host. While we used human 293T cells in our quantitative virus production inhibition studies, the potent shRNA inhibitors that we identified in 293T cells were generally able to inhibit HIV-1 replication in human SupT1 T cells, consistent with the observation that determinants of shRNA repression appear to be conserved between evolutionarily disparate cell types.42
In sum, an extremely simple model is sufficient to identify potent shRNAs that strongly inhibit HIV-1 production in cell culture, even when the shRNAs are used at subsaturating concentrations. These sequences are strong candidate targets for further evaluation in preclinical anti-HIV assays. Critically, our approach emphasizes the profound role of RNA structure in tuning RNAi function and absolutely requires an accurate secondary structure model of the RNA target, as obtainable from SHAPE chemical probing information. The inclusion of partial SHAPE data, corresponding to that obtainable in a single experiment covering ~500 nts, also yields significant improvements in identification of potent shRNA inhibitors. In the broadest terms, this work shows how profoundly RNA structure influences biological function and emphasizes that, if a high-content model for an RNA fold is obtained experimentally, deep insight into underlying mechanisms can be obtained.
Materials and Methods
Plasmid constructs. The shRNA expression plasmids pSuper-shRNA were constructed as described,47 were verified by sequencing, and were expected to yield 19-nt guide strands upon processing by the cellular miRNA biogenesis pathway. The pLAI plasmid was used to express the HIV-1 isolate LAI (GenBank accession K02013). The pRL-CMV plasmid (Promega, Madison, WI) expressing Renilla luciferase was cotransfected to control for transfection efficacy. For shRNA titration experiments, the pBluescript plasmid (Stratagene, La Jolla, CA) was used to normalize plasmid amounts.6 To generate lentiviral vectors expressing the shRNAs, the H1-shRNA cassettes were cloned into the lentiviral vector JS1 (pRRLcpptpgkgfppreSsin),48 as described previously.6 JS1 harbors a GFP cassette for easy identification of transduced cells. For lentivirus production, the JS1 variants were cotransfected with the packaging plasmids pSYNGP, pVSVg, and 250 ng pRSV-rev.
Cell culture. Human embryonic kidney 293T adherent cells were grown in Dulbecco's modified Eagle's medium, supplemented with 10% fetal calf serum, 100 U/ml penicillin, and 100 µg/ml streptomycin in a humidified chamber at 37 °C and 5% CO2. The SupT1 T cell line was maintained in Advanced RPMI (Gibco, Carlsbad, CA) supplemented with -glutamine, 1% fetal calf serum, 30 U/ml penicillin and 30 µg/ml streptomycin; cells were maintained at 37 °C and 5% CO2.
Transfections and HIV-1 production experiments. For the HIV-1 production assay, cotransfections of pLAI and the shRNA vector were performed in a 24-well format. On the first day, 1.5 × 10⁵ 293T cells were seeded per well in Dulbecco's modified Eagle's medium without antibiotics. The next day, 250 ng pLAI, 25 ng of shRNA vector, and 1 ng pRL-CMV in Lipofectamine 2000 (Invitrogen, Carlsbad, CA; following the manufacturer's protocol) were added. After 48 hours, samples of cell supernatant were taken for CA-p24 ELISA quantification and cells were lysed for measurement of Renilla luciferase activity (Renilla Luciferase Assay System; Promega). All transfections were carried out in duplicate and repeated twice. Negative controls were performed using an empty pSuper vector and with an shRNA directed against the firefly luciferase gene. Positive inhibition controls were performed using shRNAs directed against known efficiently repressed HIV-1 targets (LDR9, GagC, Pol1, and Nef19).6 For shRNA titrations, 250 ng pLAI was cotransfected with 1–125 ng pSuper shRNA variants and 1 ng pRL-CMV. Variable amounts of pBluescript were added to yield equivalent DNA concentrations per transfection. All data from transfection experiments were corrected with factor correction to compensate for interexperimental differences.49
For lentivirus production, 293T cells were seeded in a 6-well plate format 1 day before transfection to reach 70% confluency and subsequently transfected with 950 ng lentiviral plasmid JS1-shRNA or empty JS1, 600 ng pSYNGP, 330 ng pVSVg, and 250 ng pRSV-rev with Lipofectamine 2000, as described.6
The HIV-1 virus stock was produced in 293T cells, which were seeded in a T75 flask to yield 70% confluency 1 day before transfection; 40 µg HIV-1 pLAI was transfected following the Lipofectamine 2000 protocol and supernatant was harvested at 48 hours post-transfection. Cells were removed by centrifugation (4,000g) and the supernatant was aliquoted and stored at -80 °C. The HIV-1 LAI virus stock was quantified for CA-p24 by ELISA measurement.
Lentiviral transduction, HIV-challenge experiments, and competitive cell growth assay. First, lentiviral titers were determined via titration on SupT1 cells, scoring the percentage of green fluorescent protein (GFP)-positive cells by fluorescence-activated cell sorting.6 Then, a multiplicity of infection of 0.15 was used for transduction of SupT1 T cells.6 Four days later, cells were sorted for GFP-expression by fluorescence-activated cell sorting. 2 × 10⁵ transduced SupT1 cells were challenged with HIV-1 (0.01 or 0.05 ng CA-p24, corresponding to low and high titers, respectively) and monitored daily for up to 90 days by eye and light microscopy to score for cytopathic effects. Supernatants were collected in parallel three times per week to determine CA-p24 levels. Transduced SupT1 cells were screened for a negative impact on the cell growth as induced by lentiviral integration (JS1 control cells) and shRNA expression using the competitive cell growth assay.39 In brief, SupT1 cells were transduced to obtain around 30% GFP+ cells. The GFP+/GFP- ratio was analyzed over a 30-day period by fluorescence-activated cell sorting measurement, and the ratio at day 3 was normalized to one. Impact on cell growth can be converted as percentage reduction in cell growth.39
Free energy calculations. Free energies were calculated using the OligoWalk algorithm in the RNAstructure package.50 OligoWalk takes an RNA secondary structure model as input and considers a bimolecular equilibrium between this folded RNA and every possible complementary RNA oligonucleotide of a user-defined length. The duplex annealing energy ΔGduplex and target unfolding energy ΔGtarget are calculated. We assumed that shRNAs were cleaved into 19-nt guide strands. The target unfolding energy ΔGtarget was calculated as the energy required to break base pairs in the input secondary structure model (break local structure option in OligoWalk). The structural model was inputted in connect file (.ct) format. Our SHAPE-based secondary structure model differs from the published model31 in two regions: the transfer RNA primer and a heuristically predicted pseudoknot are absent in our input file because OligoWalk only permits single molecule inputs and does not allow pseudoknots. We excluded shRNA target sequences in these two regions because removal of their binding partners resulted in falsely weak target folding energies and falsely strong total binding energies; these regions are very inaccessible and thus poor candidates for RNAi targets.31 We also created a secondary structure model of the NL4-3 HIV-1 RNA using only thermodynamic parameters by folding the RNA in RNAstructure without any experimental constraints. Perl scripts were created to vary the length and position parameters by changing the input oligomer length and by shifting the target energy window relative to the guide strand binding site, respectively.
Correlation calculations for other algorithms. We calculated correlation coefficients between our 84 member-training dataset and siRNA design algorithm scores using the i-Score Designer tool (http://www.med.nagoya-u.ac.jp/neurogenetics/i_Score/i_score.html) for all methods except for RNAxs and Sirna. Sirna scores were calculated using the online Sfold package (http://sfold.wadsworth.org). We applied the RNAxs algorithm using Perl scripts generously provided by the Hofacker lab. The RNAxs algorithm evaluates siRNA sequences by filters which include accessibility criteria. Twenty-one of our 84 training set sequences were predicted to be good inhibitors by RNAxs. Of these 21 sequences, 10 (48%) inhibited HIV-1 production by more than 50% and 4 (19%) showed greater than 90% inhibition. To compute the linear correlation coefficient between RNAxs ranks for all 84 training sequences and the experimental inhibition data (Table 1), RNAxs filters were set to zero.
Viral production datasets. We used fully independent datasets to train and test our rules (Figure 3). Our training dataset was comprised of the shRNA sequences previously published by ter Brake et al.6 Viral production values were obtained using relatively low plasmid transfection amounts (20 ng) and sequences were chosen without using si/shRNA selection rules; instead, sequences were selected based on sequence conservation among HIV-1 isolates. A total of 86 HIV-1 sequences were targeted by the shRNAs in this dataset. However, two sequences were, by coincidence, identical (Supplementary Table S1, asterisks). In the current study, we averaged the viral production values for the identical sequences and used the resulting 84 sequences in our correlation calculations. The 26-member test dataset was created as described in the text by applying the two thermodynamic rules derived from the training dataset. As with the training dataset, no additional si/shRNA design rules were invoked.
SUPPLEMENTARY MATERIAL Figure S1. Inhibition of HIV-1 replication in transduced SupT1 T cells. Cells were transduced with the empty JS1 lentivirus (negative control), JS1-shPol1 (a known effective inhibitor),6 or lentiviral variants expressing eight shRNAs randomly selected from among the most potent test set shRNAs. Cultures with CA-p24 amounts above a 1 ng/ml threshold were scored as positive for viral replication. The color code indicates when virus replication was apparent: within 1 week (white), 2 weeks (light gray), 3 weeks (dark gray), or no observable replication for up to 2 months (black). Figure S2. Competitive cell growth curves of representative potent shRNAs from the test set. SupT1 T cells were transduced with lentiviral vectors expressing both shRNA and GFP and cultured together with nontransduced SupT1 T cells. To score effects induced by the lentiviral integration, cells were transduced with the empty JS1 vector expressing GFP but no shRNA. FACS measurements were used to quantify GFP+ and GFP- cell populations, corresponding to transduced and nontransduced cells, respectively. The GFP+/GFP- ratio (y-axis), quantifies cell growth defects.39 Table S1. shRNA training dataset sequences and their relative viral production values.6 Table S2. Linear correlation coefficients (r) between duplex annealing energies ΔGduplex, target folding energies ΔGtarget, and total binding energies ΔGtotal and HIV-1 inhibition activity values for the 84 shRNAs in the training dataset6 calculated using a SHAPE-directed secondary structure model.31 Table S3. Linear correlation coefficients (r) between calculated duplex annealing energies ΔGduplex, target folding energies ΔGtarget, and total binding energies ΔGtotal and experimental activity values for the 84 shRNAs in the training dataset6 but calculated without using experimental information to derive the secondary structure model. Table S4. shRNA test dataset core sequences designed using the two thermodynamic rules identified in this study and their relative viral production values. Table S5. Free energy values for test shRNA sequences calculated using two 2,500 nt folds of HIV-1 genome segments.
Acknowledgments
This work was supported by National Institutes of Health grant AI068462 (to K.M.W.) and a Netherlands Organization for Scientific Research Division of Chemical Sciences (NWO-CW) TOP grant (to B.B.). J.T.L. was supported by National Research Service Award F30DA027364 and Medical Scientist Training Program T32GM008719; S.A.K. was supported by a fellowship from the Deutscher Akademischer Austausch-dienst (DAAD); and J.M.W. was a Postdoctoral Fellow of the UNC Lineberger Comprehensive Cancer Center. The authors declared no conflict of interest.
Supplementary Material
Inhibition of HIV-1 replication in transduced SupT1 T cells. Cells were transduced with the empty JS1 lentivirus (negative control), JS1-shPol1 (a known effective inhibitor),6 or lentiviral variants expressing eight shRNAs randomly selected from among the most potent test set shRNAs. Cultures with CA-p24 amounts above a 1 ng/ml threshold were scored as positive for viral replication. The color code indicates when virus replication was apparent: within 1 week (white), 2 weeks (light gray), 3 weeks (dark gray), or no observable replication for up to 2 months (black).
Competitive cell growth curves of representative potent shRNAs from the test set. SupT1 T cells were transduced with lentiviral vectors expressing both shRNA and GFP and cultured together with nontransduced SupT1 T cells. To score effects induced by the lentiviral integration, cells were transduced with the empty JS1 vector expressing GFP but no shRNA. FACS measurements were used to quantify GFP+ and GFP- cell populations, corresponding to transduced and nontransduced cells, respectively. The GFP+/GFP- ratio (y-axis), quantifies cell growth defects.39
shRNA training dataset sequences and their relative viral production values.6
Linear correlation coefficients (r) between duplex annealing energies ΔGduplex, target folding energies ΔGtarget, and total binding energies ΔGtotal and HIV-1 inhibition activity values for the 84 shRNAs in the training dataset6 calculated using a SHAPE-directed secondary structure model.31
Linear correlation coefficients (r) between calculated duplex annealing energies ΔGduplex, target folding energies ΔGtarget, and total binding energies ΔGtotal and experimental activity values for the 84 shRNAs in the training dataset6 but calculated without using experimental information to derive the secondary structure model.
shRNA test dataset core sequences designed using the two thermodynamic rules identified in this study and their relative viral production values.
Free energy values for test shRNA sequences calculated using two 2,500 nt folds of HIV-1 genome segments.
REFERENCES
- Cruz JA., and, Westhof E. The dynamic landscapes of RNA architecture. Cell. 2009;136:604–609. doi: 10.1016/j.cell.2009.02.003. [DOI] [PubMed] [Google Scholar]
- Mello CC., and, Conte D., Jr Revealing the world of RNA interference. Nature. 2004;431:338–342. doi: 10.1038/nature02872. [DOI] [PubMed] [Google Scholar]
- Wu L., and, Belasco JG. Let me count the ways: mechanisms of gene regulation by miRNAs and siRNAs. Mol Cell. 2008;29:1–7. doi: 10.1016/j.molcel.2007.12.010. [DOI] [PubMed] [Google Scholar]
- Umbach JL., and, Cullen BR. The role of RNAi and microRNAs in animal virus replication and antiviral immunity. Genes Dev. 2009;23:1151–1164. doi: 10.1101/gad.1793309. [DOI] [PMC free article] [PubMed] [Google Scholar]
- Wadhwa R, Kaul SC, Miyagishi M., and, Taira K. Vectors for RNA interference. Curr Opin Mol Ther. 2004;6:367–372. [PubMed] [Google Scholar]
- ter Brake O, Konstantinova P, Ceylan M., and, Berkhout B. Silencing of HIV-1 with RNA interference: a multiple shRNA approach. Mol Ther. 2006;14:883–892. doi: 10.1016/j.ymthe.2006.07.007. [DOI] [PubMed] [Google Scholar]
- Naito Y, Nohtomi K, Onogi T, Uenishi R, Ui-Tei K, Saigo K.et al. (2007Optimal design and validation of antiviral siRNA for targeting HIV-1 Retrovirology 480. [DOI] [PMC free article] [PubMed] [Google Scholar]
- McIntyre GJ, Groneman JL, Yu YH, Jaramillo A, Shen S., and, Applegate TL. 96 shRNAs designed for maximal coverage of HIV-1 variants. Retrovirology. 2009;6:55. doi: 10.1186/1742-4690-6-55. [DOI] [PMC free article] [PubMed] [Google Scholar]
- Reynolds A, Leake D, Boese Q, Scaringe S, Marshall WS., and, Khvorova A. Rational siRNA design for RNA interference. Nat Biotechnol. 2004;22:326–330. doi: 10.1038/nbt936. [DOI] [PubMed] [Google Scholar]
- Ui-Tei K, Naito Y, Takahashi F, Haraguchi T, Ohki-Hamazaki H, Juni A.et al. (2004Guidelines for the selection of highly effective siRNA sequences for mammalian and chick RNA interference Nucleic Acids Res 32936–948. [DOI] [PMC free article] [PubMed] [Google Scholar]
- Shabalina SA, Spiridonov AN., and, Ogurtsov AY. Computational models with thermodynamic and composition features improve siRNA design. BMC Bioinformatics. 2006;7:65. doi: 10.1186/1471-2105-7-65. [DOI] [PMC free article] [PubMed] [Google Scholar]
- Huesken D, Lange J, Mickanin C, Weiler J, Asselbergs F, Warner J.et al. (2005Design of a genome-wide siRNA library using an artificial neural network Nat Biotechnol 23995–1001. [DOI] [PubMed] [Google Scholar]
- Matveeva O, Nechipurenko Y, Rossi L, Moore B, Saetrom P, Ogurtsov AY.et al. (2007Comparison of approaches for rational siRNA design leading to a new efficient and transparent method Nucleic Acids Res 35e63. [DOI] [PMC free article] [PubMed] [Google Scholar]
- Tafer H, Ameres SL, Obernosterer G, Gebeshuber CA, Schroeder R, Martinez J.et al. (2008The impact of target site accessibility on the design of effective siRNAs Nat Biotechnol 26578–583. [DOI] [PubMed] [Google Scholar]
- Ding Y, Chan CY., and, Lawrence CE. Sfold web server for statistical folding and rational design of nucleic acids. Nucleic Acids Res. 2004;32 Web Server issue:W135–W141. doi: 10.1093/nar/gkh449. [DOI] [PMC free article] [PubMed] [Google Scholar]
- Shao Y, Chan CY, Maliyekkel A, Lawrence CE, Roninson IB., and, Ding Y. Effect of target secondary structure on RNAi efficiency. RNA. 2007;13:1631–1640. doi: 10.1261/rna.546207. [DOI] [PMC free article] [PubMed] [Google Scholar]
- Amarzguioui M., and, Prydz H. An algorithm for selection of functional siRNA sequences. Biochem Biophys Res Commun. 2004;316:1050–1058. doi: 10.1016/j.bbrc.2004.02.157. [DOI] [PubMed] [Google Scholar]
- Katoh T., and, Suzuki T. Specific residues at every third position of siRNA shape its efficient RNAi activity. Nucleic Acids Res. 2007;35:e27. doi: 10.1093/nar/gkl1120. [DOI] [PMC free article] [PubMed] [Google Scholar]
- Takasaki S, Kotani S., and, Konagaya A. An effective method for selecting siRNA target sequences in mammalian cells. Cell Cycle. 2004;3:790–795. [PubMed] [Google Scholar]
- Ichihara M, Murakumo Y, Masuda A, Matsuura T, Asai N, Jijiwa M.et al. (2007Thermodynamic instability of siRNA duplex is a prerequisite for dependable prediction of siRNA activities Nucleic Acids Res 35e123. [DOI] [PMC free article] [PubMed] [Google Scholar]
- Vert JP, Foveau N, Lajaunie C., and, Vandenbrouck Y. An accurate and interpretable model for siRNA efficacy prediction. BMC Bioinformatics. 2006;7:520. doi: 10.1186/1471-2105-7-520. [DOI] [PMC free article] [PubMed] [Google Scholar]
- Lu ZJ., and, Mathews DH. Efficient siRNA selection using hybridization thermodynamics. Nucleic Acids Res. 2008;36:640–647. doi: 10.1093/nar/gkm920. [DOI] [PMC free article] [PubMed] [Google Scholar]
- Taxman DJ, Livingstone LR, Zhang J, Conti BJ, Iocca HA, Williams KL.et al. (2006Criteria for effective design, construction, and gene knockdown by shRNA vectors BMC Biotechnol 67. [DOI] [PMC free article] [PubMed] [Google Scholar]
- Schopman NC, Liu YP, Konstantinova P, ter Brake O., and, Berkhout B. Optimization of shRNA inhibitors by variation of the terminal loop sequence. Antiviral Res. 2010;86:204–211. doi: 10.1016/j.antiviral.2010.02.320. [DOI] [PubMed] [Google Scholar]
- Xia T, SantaLucia J, Jr, Burkard ME, Kierzek R, Schroeder SJ, Jiao X.et al. (1998Thermodynamic parameters for an expanded nearest-neighbor model for formation of RNA duplexes with Watson-Crick base pairs Biochemistry 3714719–14735. [DOI] [PubMed] [Google Scholar]
- Mathews DH, Sabina J, Zuker M., and, Turner DH. Expanded sequence dependence of thermodynamic parameters improves prediction of RNA secondary structure. J Mol Biol. 1999;288:911–940. doi: 10.1006/jmbi.1999.2700. [DOI] [PubMed] [Google Scholar]
- Deigan KE, Li TW, Mathews DH., and, Weeks KM. Accurate SHAPE-directed RNA structure determination. Proc Natl Acad Sci USA. 2009;106:97–102. doi: 10.1073/pnas.0806929106. [DOI] [PMC free article] [PubMed] [Google Scholar]
- Merino EJ, Wilkinson KA, Coughlan JL., and, Weeks KM. RNA structure analysis at single nucleotide resolution by selective 2'-hydroxyl acylation and primer extension (SHAPE) J Am Chem Soc. 2005;127:4223–4231. doi: 10.1021/ja043822v. [DOI] [PubMed] [Google Scholar]
- Wilkinson KA, Gorelick RJ, Vasa SM, Guex N, Rein A, Mathews DH.et al. (2008High-throughput SHAPE analysis reveals structures in HIV-1 genomic RNA strongly conserved across distinct biological states PLoS Biol 6e96. [DOI] [PMC free article] [PubMed] [Google Scholar]
- Mathews DH, Disney MD, Childs JL, Schroeder SJ, Zuker M., and, Turner DH. Incorporating chemical modification constraints into a dynamic programming algorithm for prediction of RNA secondary structure. Proc Natl Acad Sci USA. 2004;101:7287–7292. doi: 10.1073/pnas.0401799101. [DOI] [PMC free article] [PubMed] [Google Scholar]
- Watts JM, Dang KK, Gorelick RJ, Leonard CW, Bess JW, Jr, Swanstrom R.et al. (2009Architecture and secondary structure of an entire HIV-1 RNA genome Nature 460711–716. [DOI] [PMC free article] [PubMed] [Google Scholar]
- Jackson AL., and, Linsley PS. Recognizing and avoiding siRNA off-target effects for target identification and therapeutic application. Nat Rev Drug Discov. 2010;9:57–67. doi: 10.1038/nrd3010. [DOI] [PubMed] [Google Scholar]
- Judge AD, Sood V, Shaw JR, Fang D, McClintock K., and, MacLachlan I. Sequence-dependent stimulation of the mammalian innate immune response by synthetic siRNA. Nat Biotechnol. 2005;23:457–462. doi: 10.1038/nbt1081. [DOI] [PubMed] [Google Scholar]
- Westerhout EM, Ooms M, Vink M, Das AT., and, Berkhout B. HIV-1 can escape from RNA interference by evolving an alternative structure in its RNA genome. Nucleic Acids Res. 2005;33:796–804. doi: 10.1093/nar/gki220. [DOI] [PMC free article] [PubMed] [Google Scholar]
- Schubert S, Grünweller A, Erdmann VA., and, Kurreck J. Local RNA target structure influences siRNA efficacy: systematic analysis of intentionally designed binding regions. J Mol Biol. 2005;348:883–893. doi: 10.1016/j.jmb.2005.03.011. [DOI] [PubMed] [Google Scholar]
- Westerhout EM., and, Berkhout B. A systematic analysis of the effect of target RNA structure on RNA interference. Nucleic Acids Res. 2007;35:4322–4330. doi: 10.1093/nar/gkm437. [DOI] [PMC free article] [PubMed] [Google Scholar]
- Ameres SL, Martinez J., and, Schroeder R. Molecular basis for target RNA recognition and cleavage by human RISC. Cell. 2007;130:101–112. doi: 10.1016/j.cell.2007.04.037. [DOI] [PubMed] [Google Scholar]
- Filipowicz W. RNAi: the nuts and bolts of the RISC machine. Cell. 2005;122:17–20. doi: 10.1016/j.cell.2005.06.023. [DOI] [PubMed] [Google Scholar]
- Eekels JJM, Pasternak AO, Schut AM, Geerts D, Jeeninga RE., and, Berkhout B.2011A competitive cell growth assay for the detection of subtle effects of gene transduction on cell proliferation Gene Therin press. [DOI] [PubMed]
- Yuan YR, Pei Y, Ma JB, Kuryavyi V, Zhadina M, Meister G.et al. (2005Crystal structure of A. aeolicus argonaute, a site-specific DNA-guided endoribonuclease, provides insights into RISC-mediated mRNA cleavage Mol Cell 19405–419. [DOI] [PMC free article] [PubMed] [Google Scholar]
- Tomari Y., and, Zamore PD. Perspective: machines for RNAi. Genes Dev. 2005;19:517–529. doi: 10.1101/gad.1284105. [DOI] [PubMed] [Google Scholar]
- Fellmann C, Zuber J, McJunkin K, Chang K, Malone CD, Dickins RA.et al. (2011Functional identification of optimized RNAi triggers using a massively parallel sensor assay Mol Cell 41733–746. [DOI] [PMC free article] [PubMed] [Google Scholar]
- Schwarz DS, Hutvágner G, Du T, Xu Z, Aronin N., and, Zamore PD. Asymmetry in the assembly of the RNAi enzyme complex. Cell. 2003;115:199–208. doi: 10.1016/s0092-8674(03)00759-1. [DOI] [PubMed] [Google Scholar]
- Elbashir SM, Martinez J, Patkaniowska A, Lendeckel W., and, Tuschl T. Functional anatomy of siRNAs for mediating efficient RNAi in Drosophila melanogaster embryo lysate. EMBO J. 2001;20:6877–6888. doi: 10.1093/emboj/20.23.6877. [DOI] [PMC free article] [PubMed] [Google Scholar]
- von Eije KJ, ter Brake O., and, Berkhout B. Human immunodeficiency virus type 1 escape is restricted when conserved genome sequences are targeted by RNA interference. J Virol. 2008;82:2895–2903. doi: 10.1128/JVI.02035-07. [DOI] [PMC free article] [PubMed] [Google Scholar]
- Schopman NC, ter Brake O., and, Berkhout B. Anticipating and blocking HIV-1 escape by second generation antiviral shRNAs. Retrovirology. 2010;7:52. doi: 10.1186/1742-4690-7-52. [DOI] [PMC free article] [PubMed] [Google Scholar]
- Brummelkamp TR, Bernards R., and, Agami R. A system for stable expression of short interfering RNAs in mammalian cells. Science. 2002;296:550–553. doi: 10.1126/science.1068999. [DOI] [PubMed] [Google Scholar]
- Seppen J, Rijnberg M, Cooreman MP., and, Oude Elferink RP. Lentiviral vectors for efficient transduction of isolated primary quiescent hepatocytes. J Hepatol. 2002;36:459–465. doi: 10.1016/s0168-8278(01)00308-7. [DOI] [PubMed] [Google Scholar]
- Ruijter JM, Thygesen HH, Schoneveld OJ, Das AT, Berkhout B., and, Lamers WH. Factor correction as a tool to eliminate between-session variation in replicate experiments: application to molecular biology and retrovirology. Retrovirology. 2006;3:2. doi: 10.1186/1742-4690-3-2. [DOI] [PMC free article] [PubMed] [Google Scholar]
- Mathews DH, Burkard ME, Freier SM, Wyatt JR., and, Turner DH. Predicting oligonucleotide affinity to nucleic acid targets. RNA. 1999;5:1458–1469. doi: 10.1017/s1355838299991148. [DOI] [PMC free article] [PubMed] [Google Scholar]
Associated Data
This section collects any data citations, data availability statements, or supplementary materials included in this article.
Supplementary Materials
Inhibition of HIV-1 replication in transduced SupT1 T cells. Cells were transduced with the empty JS1 lentivirus (negative control), JS1-shPol1 (a known effective inhibitor),6 or lentiviral variants expressing eight shRNAs randomly selected from among the most potent test set shRNAs. Cultures with CA-p24 amounts above a 1 ng/ml threshold were scored as positive for viral replication. The color code indicates when virus replication was apparent: within 1 week (white), 2 weeks (light gray), 3 weeks (dark gray), or no observable replication for up to 2 months (black).
Competitive cell growth curves of representative potent shRNAs from the test set. SupT1 T cells were transduced with lentiviral vectors expressing both shRNA and GFP and cultured together with nontransduced SupT1 T cells. To score effects induced by the lentiviral integration, cells were transduced with the empty JS1 vector expressing GFP but no shRNA. FACS measurements were used to quantify GFP+ and GFP- cell populations, corresponding to transduced and nontransduced cells, respectively. The GFP+/GFP- ratio (y-axis), quantifies cell growth defects.39
shRNA training dataset sequences and their relative viral production values.6
Linear correlation coefficients (r) between duplex annealing energies ΔGduplex, target folding energies ΔGtarget, and total binding energies ΔGtotal and HIV-1 inhibition activity values for the 84 shRNAs in the training dataset6 calculated using a SHAPE-directed secondary structure model.31
Linear correlation coefficients (r) between calculated duplex annealing energies ΔGduplex, target folding energies ΔGtarget, and total binding energies ΔGtotal and experimental activity values for the 84 shRNAs in the training dataset6 but calculated without using experimental information to derive the secondary structure model.
shRNA test dataset core sequences designed using the two thermodynamic rules identified in this study and their relative viral production values.
Free energy values for test shRNA sequences calculated using two 2,500 nt folds of HIV-1 genome segments.