

Abstract
Gene expression profiles from microarray experiments that include samples or biological replicates representing various classes, groups or states (e.g. treatments, developmental stages, health status) have been used to predict gene networks. To further mine the information from samples within and across classes, a framework that integrates Bayesian networks, mixture of gene co-expression models and clustering using on all the genes in the network is proposed. The approach was evaluated on two independent pathways using data from two microarray experiments. The postulated algorithm succeeded on reconstructing the topology of the gene pathways when benchmarked against empirical reports and randomized data sets. The majority or all the samples within a class shared the same co-expression model and were classified within the corresponding class. Our approach uncovered both, gene relationships and profiles that are unique to a particular class or shared across classes.
Keywords: Gene pathway, Bayesian network, starch and sucrose metabolism pathway, circadian rhythm pathway, gene expression and co-expression models
1 Introduction
Gene expression profiles obtained from microarray experiments have been used to detect relationships between genes using Bayesian networks (Friedman et al., 2000; Imoto et al., 2002; Pe’er et al., 2001; Hartemink et al., 2002). Most implementations of Bayesian networks assume a single model to describe the gene expression and co-expression patterns across all the classes (e.g. treatments, ages, health status) considered and all the samples or biological replicates within class. Consequently, these studies have not explored the potential fluctuation of gene expression and co-expression patterns in pathways across classes or samples within class.
Davies and Moore (2000) proposed the use of multiple models to describe the relationship between the nodes of a Bayesian network and used Gaussian mixtures to combine the models. The application of mixture Bayesian networks using a sparse candidate algorithm to data sets with no or limited (only two) samples per class reported by Ko et al. (2009) did not allow the consideration of samples to uncover variation in gene pathways within and across classes. Furthermore, their approach considered each gene individually and did not integrate the co-expression mixture models from all the genes in the pathway simultaneously.
In most microarray experiments, multiple samples are available within class. This type of experimental designs can be represented by a hierarchical structure with samples nested within classes. It is expected that the samples within a class are more likely to share gene expression and co-expression models amongst themselves than with samples from another class. Furthermore, some or all classes can also share gene co-expression models. However, the co-expression profiles of some classes may be more variable than others and not all the samples within a class may be adequately described by the same gene co-expression model. The detection and characterization of different co-expression models across and within class can be useful for class prediction, design of follow-up functional studies and assessment of the plasticity of samples across classes. However, there are no reports of the consideration of samples to infer a gene network and gain more information on co-expression patterns.
The aim of this study is to demonstrate that fluctuations in gene pathways across classes and samples can be uncovered and used to accurately classify samples. The integration of three modeling paradigms, Bayesian networks, mixture of co-expression models and clustering was used to model the co-expression of all the genes in the network. Of interest is to identify samples that either share or differ in the expression (e.g. expression level and variation) and co-expression (e.g. correlation) patterns and to detect gene network variability that can help in sample classification. The proposed approach was applied to two pathways. Data from two microarray experiments that investigated the profiles of brain gene expression in response to environmental stimuli characterized by the age and behavior structure of honey bee colonies was used. Interpretation of the parameter estimates and network topology provided novel insights into the flexibility of genes in pathways to accommodate changes in the environment.
2 Methods
2.1 Gene expression and co-expression models
To accommodate for potentially multiple gene expression and co-expression patterns across samples and classes, multiple co-expression models were combined using a mixture approach. The joint probability distribution P over a set of correlated random variables such as the expression abundances of gene gi and the correlated genes g1, g2,…, gq denoted Ψ(gi) across samples can be represented with a multivariate Gaussian mixture model (Davies and Moore, 2000). The density function R⃗(i) for the set of genes (gi, Ψ(gi) ) is:
| (1) |
where πk is the weight for k-th mixture component or model and the sum of the weights of the models for . The joint probability distribution P(R⃗(i) ) is represented by the mixture of λi multivariate Gaussian distributions with mean vector μ⃗k and covariance matrix Σ⃗k where the upper script arrow (e.g. R⃗, μ⃗, Σ→) denotes matrix notation. For example, to describe the joint density function for three correlated genes, R⃗ denotes a 3 by 1 vector, μ⃗ represents a 3 by 1 vector and Σ⃗ represents a 3 by 3 matrix. Gaussian density is suitable for the gene expression data considered but other densities can be specified in Eq. 1. The combination of Gaussian models accommodate potentially multiple co-expression patterns among the genes in the pathway but does not model directional (parent-child) relationships between genes. In this study, the directional relationships between genes and the general topology of the pathway is uncovered using Bayesian networks.
2.2 Bayesian network
The gene expression information across samples and classes can be used to infer the overall network depicting the relationship between genes in a pathway. A Bayesian network allows to represent the relationships between random variables such as gene expression profiles in a statistical probabilistic context. The relationship between genes in a Bayesian network can be characterized as a directed acyclic graph where each node corresponds to a gene, and gene interactions are shown as directed edges between the nodes. For a set of genes, a Bayesian network G can be represented as the joint probability distribution over all genes in G (Davies and Moore, 2000). The conditional independent Markov assumption underlying graph G allows the decomposition of the joint distribution. In particular, each gene gi is independent of other genes in the network conditional on the expression of the parent genes, denoted Ψ(gi). Thus, the joint probability distribution can be written:
| (2) |
where P(gi, Ψ(gi)) is the joint probability density of the gene and parent genes and P(Ψ(gi)) is the marginal probability density of the parent genes. The gene and the parent genes (e.g. gi, Ψ(gi) ) denote a sub-network and the overall Bayesian network G is viewed as a set of N subnetworks.
2.3 Hierarchical gene network model
A comprehensive characterization of a gene pathway can be obtained by combining the parameter estimates from the gene co-expression models and the inferred Bayesian network topology (Moore and Davies, 2000; Ko et al., 2009). The joint and marginal probability density functions in Eq. 2 can be presented as mixtures of Gaussian models. Consider the availability of expression information on N genes from L samples that correspond to one of the W classes such as treatments. In this study, two latent or hidden set of variables Λ and Φ are introduced. The first latent variable set, Λ = {λ1, λ2, …, λN}, is related to the number of co-expression models needed to adequately describe the joint probability distribution of each set of related genes. For example, λi is the number of models that adequately describe the joint probability distribution P(gi, Ψ(gi) ) that corresponds to the numerator in Eq. 2. The second latent variable set, , denotes the model indicator associated with the L samples over each gene sub-networks. For instance, represents that the l-th sample is drawn from the k-th model for the i-th sub-network.
Integrating the concepts of Bayesian networks and co-expression models, the numerator in Eq. 2 can be represented by Eq. 1, and the denominator P(Ψ(gi)), called marginalization of a joint probability P(gi, Ψ(gi)), could be easily computed. The marginal probability distribution has the same number of models in the joint probability distribution and the same model weight π. The means and covariances of the marginal mixture are obtained from the corresponding ones in the joint probability distribution after removing the elements that pertain to the marginal term gi. Thus, the overall likelihood of the data given network G is:
| (3) |
and is expression values associated with the l-th sample over a set of genes R⃗(i).
| (4) |
Parameter Estimation
The Expectation-Maximization algorithm (EM) was used to estimate the parameters of the models. In the E-step, the probability that the l-th sample was drawn from the k-th co-expression model in the i-th gene sub-network was calculated given the current parameter values Θ :
In the M-step, parameter estimates were computed:
In addition to the EM algorithm, the Bayesian Information Criterion (BIC) score was used to estimate the number of co-expression models (Schwarz, 1978). The estimation process starts with one model to describe each gene sub-network, and increases the number of models in the network structure only if there is substantial improvement of the BIC score from the additional model. Otherwise, the simple structure having smaller number of models is chosen.
Simulated Annealing
The overall algorithm consists of two inference procedures: the inference of the network structure and the inference of network models. First, the network structure is inferred using simulated annealing method (Tomshine and Kaznessis, 2006). At each iteration, the simulated annealing algorithm randomly jumps from the current status (network structure) to another nearby status (different neighbor structure). The probability of jumping to another status depends on the annealing temperature that is empirically adjusted based on pilot runs. If the candidate structure is not accepted, then a new candidate structure is proposed from a current structure. This procedure is repeated iteratively until convergence. Given the current network structure, the next network structure is proposed solely by local changes (i.e. addition, deletion or reversion of an edge). Thus, the evaluation of the next network structure requires only the re-estimation of the models (including the number of mixtures and parameter estimates) corresponding to the changed subnetwork. This strategy allows for the exploration of a possible candidate structure space in a computationally efficient way. Once a candidate structure is proposed by the simulated annealing algorithm, the number of models best supported by the data is found using the BIC score and parameters of the models are estimated using the EM algorithm. These processes are iterated until there was no improvement in the score. The number of co-expression models favored by the majority of the subnetworks is used across all sub-networks to facilitate the interpretation of the assignment of samples to co-expression models across all the genes in the network.
Clustering
The integration of mixture models and Bayesian networks provides a mixture of co-expression models to describe a set of co-regulated genes within the overall network topology. To improve the identification of samples with common or distinct pathways, the co-expression models of all the genes in the inferred network were combined. This systems biology approach was accomplished by implementing both k-means clustering analysis and principal component analysis of the assignment of samples to co-expression models across all the genes in each pathway. To assess the reliability of the classification of samples to classes based on the co-expression models, a leave-one-out cross-validation approach was used.
3 Data
Honey bee is a well-established model organism to study neuro-genomic plasticity (Whitfield et al., 2003). In traditional scenarios, after adult emergence the young bees are termed nurses (N) because they are responsible for brood care. At approximately two and a half weeks of age, the honey bees forage for pollen and nectar and thus are termed foragers (F). Two independent pathways were inferred using data from two honey bee microarray experiments described by Whitfield et al. (2003). The gene expression of individual European honey bees (samples) representing different maturation stages age-behavioral groups (classes) was measured in these studies. A microarray platform including 8872 cDNA probes (6878 cDNAs accounting for approximately 20% of gene redundancy) was used. Each honey bee brain or sample was analyzed on 2 or 4 microarrays, balanced for dye labeling.
In one of the microarray experiments, Whitfield et al. (2003) identified substantial differences in gene expression patterns between typical or traditional young nurses (TN) and traditional old foragers (TF) classes using gene expression profiles from 18 honey bees per class. To discriminate the changes in gene expression due to age versus behavior, a second experiment was performed. Whitfield et al. (2003) created “single-cohort” colonies or hives composed of one age group (either N or F). Given the known plasticity of the honey bee, it was expected that some of the bees in the cohort would undertake the missing or under-represented role when necessary. For instance, in young bee colonies, some young bees matured faster and started foraging at early ages (young foragers or YF), and in old bee colonies some bees slowed down their maturation process and took on nurse behaviors (old nurses or ON). Gene expression from individual honey bees belonging to one of four age-behavior classes: traditional young nurses (YN), non-traditional young (“precocious”) foragers (YF), traditional old foragers (OF) and non-traditional old (“overage”) nurses (ON) were measured. Six honey bees were obtained per class, for a total of 24 samples. In total, gene expression profiles from 60 individual honey bees were measured on 72 microarrays of which 24 microarrays included comparisons within each study (totaling 48 microarrays) and 24 microarrays included comparisons between the two microarray studies.
The two gene networks inferred in this study were based on the complete data set including six age-behavior classes. Processing of the data from double spotted cDNA microarrays included background subtraction and log2-transformation of fluorescence intensities, and removal of flagged spots or spots that did not surpass a minimum intensity threshold. The log2 intensity values were normalized using a loess transformation, the observations from duplicated spots were collapsed and global dye and microarray effects were removed following procedures that are described by Rodriguez-Zas et al. (2006) and Adams et al. (2008) and implemented in Beehive (http://stagbeetle.animal.uiuc.edu/Beehive).
Two independent pathways, starch and sucrose metabolism and circadian rhythm, were selected to assess the performance of the proposed combination of mixture models, Bayesian networks and multi-gene clustering analyses. The starch and sucrose metabolism pathway is a carbohydrate metabolism pathway and carbohydrate metabolism genes have been found to be differentially expressed between traditional nurse and forager honey bees in independent studies (Whitfield et al., 2006; Rodriguez-Zas et al., 2006; Adams et al., 2008). Thus, the study of this pathway was expected to serve as proof-of-concept that the proposed approach can uncover changes in co-expression profiles across nurse and forager classes and samples. On the other hand, the circadian rhythm pathway was selected because there has been no report of changes in the expression pattern of genes in this pathway between typical nurse and forager honey bees exposed to the same light cycle (Whitfield et al., 2003; Rodriguez-Zas et al., 2006; Adams et al., 2008). Thus, the study of this pathway was expected to serve as proof-of-concept that the proposed approach is not biased towards inferring changes in co-expression profiles that are not supported by the data. Results from the inference of the starch and sucrose metabolism and the circadian rhythm networks were compared against the corresponding fruit fly pathways available in the KEGG database (http://www.genome.jp/kegg/). This comparison was selected because there is at the present no honey bee circadian rhythm pathway in the KEGG database, the gene relationships that are present in both the fruit fly and honey bee KEGG starch and sucrose pathways are consistent, and the honey bee starch and sucrose pathway is less complete than the corresponding fruit fly pathway. In total, 10 and 5 genes in the fruit fly starch and sucrose metabolism and circadian rhythm pathways available in the KEGG database respectively, were present on the microarray platform used to obtain the gene expression microarray data, and were used to reconstruct these pathways.
Types of gene relationships and benchmark
The relationships between genes inferred by our approach were compared to relationships reported in the KEGG database. The KEGG database provides two different kinds of relationships: directional (cause-effect) and non-directional (co-relation) relationships. Both relationships were considered in the assessment of the inferred networks. To address the situation that some pathway genes are not represented in the microarray, we defined two types of relationships among genes: direct and indirect relationships (not to be confused with directional and non-directional). Direct relationships are inferred relationships between two genes that correspond to direct relationships in the KEGG pathway database. Indirect relationships were relationships between two genes not with direct interaction but through other intermediate genes not present on the microarray platform.
To confirm the reliability of the gene networks predicted by the integrated method, a permutation-based resampling approach was used to generate 500 randomized data sets with the same structure as the original circadian rhythm data set. These data sets were analyzed using the integrated approach that combined a mixture co-expression model with Bayesian networks and the predicted networks were compared to the observed network and the known pathway in the database.
4 Results and Discussion
4.1 Starch and sucrose metabolism pathway
The overall topology of the gene network pertaining to the starch and sucrose metabolism pathway and gene co-expression models expressed among the 60 honey bees or samples from six age-behavior classes were identified. Figure 1 depicts the starch and sucrose metabolism gene network predicted by our Bayesian network approach and reported in KEGG. All except one relationship between genes predicted by our approach were present in the KEGG pathway. The exception is the relationship between genes UTP-glucose-1-phosphate uridylyl transferase (UGP) and glycogen phosphorylase (GlyP) that was detected, albeit with opposite direction by our approach. This result may be due to the active role that UGP in the expression of other genes in the starch and sucrose pathway. Cooper et al. (2006) found that the regulatory interaction networks follow a power-law distribution with a small number of well-connected ‘hub’ genes. The predicted network suggests that UGP may take on the role of a hub gene in this pathway and this is supported by the literature (Ciereszko et al., 2001).
Figure 1.
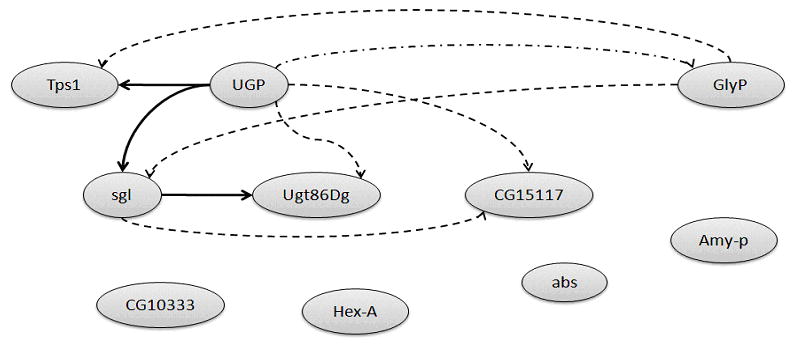
Comparison of the predicted and expected relationships between genes pertaining to the starch and sucrose metabolism pathway.
Note: Solid arrows denote direct relationships predicted by the Bayesian network approach encompassing multiple co-expression models and confirmed in the fruit fly KEGG starch and sucrose metabolism pathway. Dashed arrows represent indirect relationships predicted and confirmed in the KEGG pathway. Dashed-dot arrows represent a predicted relationships that is found in the KEGG pathway with opposite direction. Genes: sgl = sugarless; abs = abstract; CG15117 = beta-glucuronidase; Amy-p = Amylase proximal; Hex-A = Hexokinase A; Tps1 = Trehalose-6-phosphate synthase 1; CG10333 = DmRH19; UGP = UTP-glucose-1-phsphate uridylyltransferase; Ugt86Dg = Glucuronosyltransferase; GlyP = Glycogen phosphorylase.
For the majority of the gene sub-networks studied in the starch and sucrose metabolism pathway, a mixture of three gene co-expression models was favored by the data (Table 1). Although a mixture of three co-expression models was used to describe all sub-networks, the adequacy of models to describe the gene abstract (abs) and hexokinase A (Hex-A) subnetworks resulted in the samples having equal probability to be assigned to either models in each sub-network. The parameter estimates and the assignment of sample to co-expression models for each gene in the pathway offered novel insights into the variation in gene profiles and relationships between age-behavior classes. For example, combination of Models 1, 2 and 3 with weights 0.53, 0.19 and 0.28, respectively was best suited to describe relationships between the genes in the gene sugarless (sgl) sub-network. The major differences between the models were the level of gene sgl (lower in Model 1 relative to Models 2 and 3), and the correlations between gene sgl and parent genes UGP and GlyP that were higher in Model 2 (0.90 and 0.81, respectively) and Model 3 (0.72 and 0.81, respectively) relative to Model 1 (0.51 and 0.17, respectively).
Table 1.
Distribution of the honey bee samples pertaining to the six age-behavior classes based on a network with three co-expression models (Model 1, Model 2 and Model 3) for all the genes studied in the starch and sucrose metabolism pathway studied.
| Model | Gene | Age-behavior class | |||||
|---|---|---|---|---|---|---|---|
| TN | YN | ON | YF | OF | TF | ||
| Model1 | CG15117 | 16 | 6 | 0 | 0 | 4 | 14 |
| Model 2 | CG15117 | 0 | 0 | 5 | 6 | 0 | 0 |
| Model 3 | CG15117 | 2 | 0 | 1 | 0 | 2 | 4 |
|
| |||||||
| Model 1 | Ugt86dc | 16 | 5 | 0 | 0 | 4 | 13 |
| Model 2 | Ugt86dc | 0 | 0 | 5 | 3 | 0 | 0 |
| Model 3 | Ugt86dc | 2 | 1 | 1 | 3 | 2 | 5 |
|
| |||||||
| Model 1 | Tps1 | 11** | 5 | 0 | 2 | 3 | 12 |
| Model 2 | Tps1 | 0 | 0 | 5 | 4 | 2 | 1 |
| Model 3 | Tps1 | 5 | 1 | 1 | 0 | 1 | 5 |
|
| |||||||
| Model 1 | sgl | 13 | 3* | 0 | 2 | 3 | 13 |
| Model 2 | sgl | 1 | 0 | 5 | 4 | 2 | 1 |
| Model 3 | sgl | 4 | 2 | 1 | 0 | 1 | 4 |
|
| |||||||
| Model 1 | CG10333 | 10*** | 6 | 0 | 0 | 4* | 13* |
| Model 2 | CG10333 | 0 | 0 | 5 | 6 | 0 | 0 |
| Model 3 | CG10333 | 5 | 0 | 1 | 0 | 1 | 4 |
|
| |||||||
| Model 1 | Amy-p | 13 | 6 | 0 | 2 | 4* | 12 |
| Model 2 | Amy-p | 1 | 0 | 5 | 4 | 0 | 1 |
| Model 3 | Amy-p | 4 | 0 | 1 | 0 | 1 | 5 |
|
| |||||||
| Model 1 | GlyP | 16 | 5 | 0 | 0 | 4 | 13 |
| Model 2 | GlyP | 0 | 0 | 5 | 6 | 0 | 0 |
| Model 3 | GlyP | 2 | 1 | 1 | 0 | 2 | 5 |
|
| |||||||
| Model 1 | UGP | 15** | 5 | 0 | 0 | 3 | 13 |
| Model 2 | UGP | 0 | 0 | 5 | 6 | 2 | 1 |
| Model 3 | UGP | 1 | 1 | 1 | 0 | 1 | 4 |
Note: Each entry in the table indicates the number of samples assigned to each co-expression model. There are 18 samples for classes TN and TF and 6 samples for classes YN, ON, YF and OF, where OF: Old Forager, TF: Traditional Forager, YF: Young Forager, ON: Old Nurse, TN: Traditional Nurse and YN: Young Nurse. For the subnetworks of genes abs and Hex-A the assignment of the samples to the models was equally likely and are not reported. *, **, and *** indicate there are one, two, and three samples that have approximately the same probability of pertaining to the two co-expression models, respectively. Genes: sgl = sugarless; abs = abstrokt; CG15117 = beta-glucuronidase; Amy-p = Amylase proximal; Hex-A = Hexokinase A; Tps1 = Trehalose-6-phosphate synthase 1; UGP = UTP-glucose-1-phsphate uridylyltransferase; Ugt86Dg = Glucuronosyltransferase; GlyP = Glycogen phosphorylase; CG10333 = DmRH19.
The inferred sgl sub-network exemplifies the ability of our approach to characterize gene co-expression profiles that can vary widely across samples. For example the relationship between sgl and parent GlyP are strong in gene co-expression Models 2 and 3 but very weak in Model 1. Thus, provided there is sufficient evidence in the data supporting a relationship between two genes, this relationship will be uncovered. However, in scenarios when not all samples share this relationship, the mixture co-expression models allow to uncover co-expression profiles supported by all or a subset of the samples.
The assignment of samples to each of the three models (Model 1, Model 2 and Model 3) for all the genes is summarized in Table 1. All or the majority of the samples within a class were assigned to a single model. For example, all the samples representing classes YN and YF were assigned to the same model for the gene CG15117 sub-network. In addition, most of the samples within the other classes (TN, ON, OF, TF) were also consistently assigned to the same model. Among the 18 samples from TN and TF, 16 and 14 samples, respectively, were assigned to the Model 1 and the remaining 2 and 4 samples were assigned to Model 3. The subnetwork for gene Ugt86Dc showed similar model assignment patterns. This result is consistent with the gene expression profiles in the Heat Map graph. These results suggest that the sub-networks for genes CG15117 and Ugt86Dc are not rigid within class and that the starch and sucrose pathway is not affected by oscillations on the relationships among these genes.
In general, most genes in the inferred starch network had high expression levels in the YF and ON classes, but low expression levels in TN, TF, YN and OF classes. This expression pattern was well captured by the estimates of our method and provided insights into the general or unique expression levels corresponding to specific age and behavior classes. As expected, the expression and co-expression models of the traditional (TF, TN) and standard (YN, OF) age-behavior classes were consistent and the samples in each class were assigned to the same models. On the other hand, the classes representing non-traditional age-behavior combinations (“precocious” young foragers or YF and “overage” old nurses or ON) were assigned to a co-expression model different from that describing the expression patterns of the traditional samples. These assignments were consistent with the strong age-behavior effect previously discussed and reported by Whitfield et al. (2003) and Adams et al. (2008).
The simultaneous consideration of the co-expression mixture models of all the genes in the starch and sucrose pathway using principal component and k-means clustering analysis uncovered three distinct networks. Out of 10 principal components (corresponding to 10 genes in the network), the first three principal components explained 96% of the variation in the co-expression models across honey bee samples and genes. Figure 2 depicts the distribution of the samples along the first three principal components into mainly three clusters: non-traditional bees (YF and ON), traditional or old foragers (TF and OF) and traditional or young nurses (TN and YN). These results are consistent with the k-means clustering of TF and OF samples together and separate from TN and YN, that in turn clustered together but separate from YF and ON samples. A total of 22 (out of 24) TN and YN, 11 (out of 12) YF and ON and 20 (out of 24) OF and TF were assigned to clusters 1, 2 and 3 respectively. Verification of the classification of samples using leave-one-out cross-validation and information from all the genes in the starch and sucrose network supported the previous findings. Most samples within traditional nurse, traditional forager and non-traditional classes were assigned to the corresponding classes with the exception of two traditional or young nurses, four traditional or old foragers and one non-traditional honey bee sample.
Figure 2.
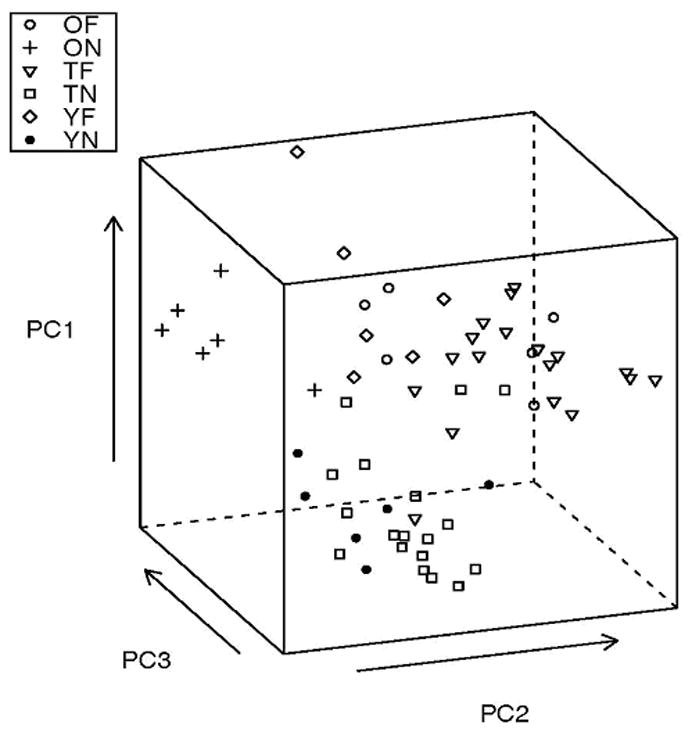
Distribution of the 60 honey bee samples and classes across the first three principal components that explained 96% of the variation of the co-expression patterns of the 10 genes in the starch and sucrose metabolism pathway studied.
Note : OF: Old Forager, TF: Traditional Forager, YF: Young Forager, ON: Old Nurse, TN: Traditional Nurse and YN: Young Nurse.
The distributions of co-expression models across samples and classes revealed by our approach were consistent with other experiments. For example, the representation of co-expression models within foragers and variability of forager sample classification are consistent with the report that forager honey bees are more variable than nurse honey bees (Whitfield et al., 2003). Furthermore, our algorithm uncovered changes in the co-expression patterns among the genes in the starch and sucrose pathway across behavior-maturation groups that were missed by the consideration of the expression profiles of genes on an individual basis.
4.2 Circadian rhythm pathway
Figure 3 summarizes the predicted and known topology of the circadian rhythm gene network. Solid arrows denote direct relationships confirmed in the circadian rhythm pathway for the fruit fly in the KEGG database. All relationships detected in the honey bees were reported in the KEGG database for the fruit fly circadian rhythm pathway, with the exception of the relationships between gene casein kinase I alpha (Dbt) and genes PAR-domain protein 1 (Pdp) and period (Per). The inability to detect these two relationships maybe due to the detection of a relationship between Dbt and vrille (Vri) and the subsequent relationships of Vri with Per and Pdp. The evidence in the data supporting the relationships between Dbt, Vri and Per was stronger than that supporting the relationships between Dbt, Pdp and Per. Two indirect relationships reported in the KEGG database (shaggy or Sgg with Pdp and with Vri) were uncovered by our approach. In addition, no predicted relationships were not present on the KEGG fruit fly pathway. The overall predicted topology was in agreement with known gene relationships in the circadian rhythm pathway (Saez et al., 2007; Blau 2001).
Figure 3.
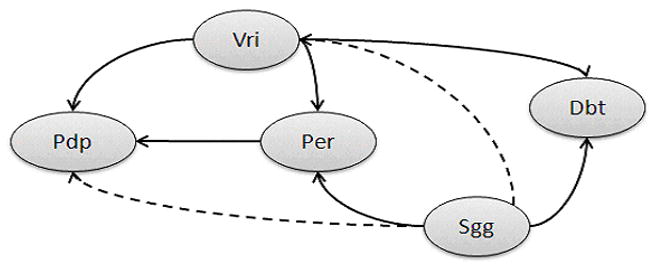
Comparison of the predicted and expected relationships between genes in the circadian rhythm pathway.
Note : Solid arrows denote direct relationships predicted by the Bayesian network approach encompassing multiple co-expression models and confirmed in the fruit fly KEGG circadian rhythm pathway. Dashed arrows represent indirect relationships predicted and confirmed in the KEGG pathway. Genes: Vri = vrille; Pdp = PAR-domain protein 1; Sgg = shaggy; Per = period; Dbt = Casein kinase I alpha
A mixture of two co-expression models best described all the subnetworks in the circadian rhythm network. Table 2 summarizes the assignment of samples from each age-behavior class to either co-expression model for all the circadian rhythm genes studied. The assignment of samples to co-expression models within each of the six age-behavior classes was most consistent for the Pdp sub-network. This suggests that the co-expression profiles of Pdp with the corresponding parent genes have the least plasticity to changes in the population structure in the hive of all genes studied in the circadian rhythm pathway.
Table 2.
Distribution of the honey bee samples pertaining to the six age-behavior classes based on a network with two co-expression models (Model 1 and Model 2) for all the genes in the circadian rhythm pathway studied.
| Model | Gene | Age-behavior class | |||||
|---|---|---|---|---|---|---|---|
| TN | YN | ON | YF | OF | TF | ||
| Model 1 | Pdp | 11*** | 5* | 6 | 0 | 4** | 5**** |
| Model 2 | Pdp | 4 | 0 | 0 | 6 | 0 | 2 |
|
| |||||||
| Model 1 | Vri | 11* | 5 | 1* | 1* | 6 | 14 |
| Model 2 | Vri | 6 | 1 | 5 | 5 | 0 | 4 |
|
| |||||||
| Model 1 | Dbt | 8** | 6 | 0 | 0 | 3 | 16 |
| Model 2 | Dbt | 8 | 0 | 6 | 6 | 3 | 2 |
|
| |||||||
| Model 1 | Sgg | 16* | 6 | 0 | 0 | 4 | 16 |
| Model 2 | Sgg | 1 | 0 | 5* | 6 | 2 | 2 |
|
| |||||||
| Model 1 | Per | 14 | 6 | 0 | 0 | 3 | 15 |
| Model 2 | Per | 4 | 0 | 6 | 6 | 3 | 3 |
Note: Each entry in the table indicates the number of samples assigned to each co-expression model. There are 18 samples for classes TN and TF and 6 samples for classes YN, ON, YF and OF, where OF: Old Forager, TF: Traditional Forager, YF: Young Forager, ON: Old Nurse, TN: Traditional Nurse and YN: Young Nurse. *, **,***, and **** indicate there are one, two, three and eleven samples that have approximately the same probability of pertaining to the two co-expression models, respectively.
Genes: Vri = vrille; Pdp = PAR-domain protein 1; Sgg = shaggy; Per = period; Dbt = Casein kinase Ialpha.
For the classes TF, YF, YN and ON, all or the vast majority of the samples were consistently assigned to the same co-expression model across all genes in the network. This suggests that the genes in the circadian rhythm pathway act in unison to class changes. However, the OF samples for the sub-network of gene Dbt, Sgg and Per, and the TN samples for the subnetwork of gene Vri and Dbt, were assigned to both models. The OF and TN samples were expected to resemble the TF and TN samples respectively that were assigned to a single model. These results are also supported by the corresponding Heat Map graph of the expression profiles.
The reliability of the circadian rhythm gene network predicted by our Bayesian network approach was investigated using a permutation-based resampling strategy. Of the networks predicted from the randomized data sets, 3% had at most one relationship in common with the network inferred from the original data and confirmed against the KEGG database. Only 10% of the networks predicted from the randomized data sets had four or more relationships in common with the network originally inferred and none had more than six empirically confirmed relationships. The majority of the networks predicted from the randomized data sets also included a much higher percentage of falsely detected relationships. These results provided further support for the capability of our integrated approach to uncover potentially multiple gene co-expression models necessary to describe gene relationships across samples and classes.
The analyses of co-expression models of all the genes in the circadian rhythm network studied using principal component and clustering approaches detected differences between non-traditional and traditional age-behavior classes. However, no difference between the traditional forager and nurse samples was detected. Meanwhile 11 out of 12 samples from untraditional YF and ON classes were grouped in cluster 1, the traditional nurse and forager samples were distributed fairly evenly between clusters 2 and 3. These results are consistent with lack of reports of circadian rhythm genes differentially expressed between traditional nurse and foragers exposed to the same light schedule.
5 Conclusions
The Bayesian network framework allowed to infer a general network that integrated all gene sub-networks. In addition to the general gene network, our results demonstrated that the potential variability of the relationships between genes could be effectively modeled using a mixture of gene expression and co-expression models. The use of multidimensional techniques including principal component analysis, clustering and cross-validation allowed to fully mine the network information and gain insights into the classification of samples. The results identified the vast majority of the gene relationships reported in the starch and sucrose metabolism and circadian rhythm KEGG pathways based on 60 honey bee samples pertaining to six age-behavior classes. All or the vast majority of the samples within a class were assigned to the same co-expression model for several gene sub-networks. This result indicated that these sub-networks were not impacted by the age-behavior classes considered. For other gene sub-networks, the assignment of samples to co-expression models uncovered the plasticity of these sub-networks to adapt to age-behavior changes in the hive. The assignment of samples to models suggested that for some gene sub-networks, class can have a major impact on the expression patterns meanwhile other gene sub-networks within the same pathway were unperturbed by changes in the class. The estimated parameters from gene expression and co-expression models provided insights into the gene patterns and relationships, and helped attain a more in-depth understanding of the impact of biological processes and gene pathways on complex disorder and behaviors. Results from the application of Bayesian networks and multiple co-expression models can be used to improve the design of follow-up functional studies. In particular, the distribution of samples and classes among co-expression models can help in the selection of number of samples per class and classes to consider in subsequent experiments.
Contributor Information
Younhee Ko, Email: younko@illinois.edu, Department of Computer Science, University of Illinois at Urbana-Champaign, 201 N. Goodwin Ave., Urbana, IL 61801, USA, Fax: 1 217 333 8286.
ChengXiang Zhai, Email: czhai@illinois.edu, Department of Computer Science, Institute for Genomic Biology, Graduate School of Library and Information Science, and Department of Statistics, University of Illinois at Urbana-Champaign 201 N. Goodwin Ave., Urbana, IL 61801, USA, Fax: 1 217 333 8286.
Sandra L. Rodriguez-Zas, Email: rodrgzzs@uiuc.edu, Department of Animal Sciences, Department of Statistics, Institute for Genomic Biology University of Illinois at Urbana-Champaign, 1207 W. Gregory Dr., Urbana, IL 61801, USA, Fax: 1 217 333 8286
References
- Adams HA, Southey BR, Robinson GE, Rodriguez-Zas SL. Meta-analysis of genome-wide expression patterns associated with behavioral maturation in honey bees. BMC Genomics. 2008;9:503. doi: 10.1186/1471-2164-9-503. [DOI] [PMC free article] [PubMed] [Google Scholar]
- Ciereszko I, Johansson H, Hurry V, Kleczkowski LA. Phosphate status affects the gene expression, protein content and enzymatic activity of UDP-glucose pyrophosphorylase in wild-type and pho mutants of Arabidopsis. Planta. 2001;212:598–605. doi: 10.1007/s004250000424. [DOI] [PubMed] [Google Scholar]
- Davies S, Moore A. In: Mix-nets: Factored mixtures of Gaussians in Bayesian networks with mixed continuous and discrete variables. Kaufmann Morgan., editor. Uncertainty in Artificial Intelligence (UAI); 2000. pp. 168–175. [Google Scholar]
- Friedman N, Linial M, Nachman I, Pe’er D. Using Bayesian networks to analyze expression data. J Comput Biol. 2000;7:601–620. doi: 10.1089/106652700750050961. [DOI] [PubMed] [Google Scholar]
- Hartemink AJ, Gifford DK, Jaakkola TS, Young RA. Combining location and expression data for principled discovery of genetic regulatory network models. Pac Symp Biocomput. 2002:437–449. [PubMed] [Google Scholar]
- Imoto S, Goto T, Miyano S. Estimation of genetic networks and functional structures between genes by using Bayesian networks and nonparametric regression. Pac Symp Biocomput. 2002:175–186. [PubMed] [Google Scholar]
- Blau J. The Drosophila circadian clock: what we know and what we don’t know. Cell & Developmental Biology. 2001;12:287–293. doi: 10.1006/scdb.2001.0256. [DOI] [PubMed] [Google Scholar]
- Ko Y, Zhai C-X, Rodriguez-Zas SL. Inference of gene pathways using mixture Bayesian networks. BMC Systems Biology. 2009;3:54. doi: 10.1186/1752-0509-3-54. [DOI] [PMC free article] [PubMed] [Google Scholar]
- Pe’er D, Regev A, Elidan G, Friedman N. Inferring subnetworks from perturbed expression profiles. Bioinformatics. 2001;17(Suppl 1):S215–224. doi: 10.1093/bioinformatics/17.suppl_1.s215. [DOI] [PubMed] [Google Scholar]
- Rodriguez-Zas SL, Southey BR, Whitfield CW, Robinson GE. Semiparametric approach to characterize unique gene expression trajectories across time. BMC Genomics. 2006;7:233. doi: 10.1186/1471-2164-7-233. [DOI] [PMC free article] [PubMed] [Google Scholar]
- Saez L, Meyer P, Young MW. A PER/TIM/DBT interval timer for Drosophila’s circadian clock. Cold Spring Harb Symp Quant Biol. 2007;72:69–74. doi: 10.1101/sqb.2007.72.034. [DOI] [PubMed] [Google Scholar]
- Schwarz G. Estimating the dimension of a model. Ann Stat. 1978;6:461–464. [Google Scholar]
- Cooper T, Morby A, Gunn A, Schneider D. Effect of random and hub gene disruptions on environmental and mutational robustness in Escherichia coli. BMC Genomics. 2006;7:237–248. doi: 10.1186/1471-2164-7-237. [DOI] [PMC free article] [PubMed] [Google Scholar]
- Tomshine J, Kaznessis YN. Optimization of a stochastically simulated gene network model via simulated annealing. Biophys J. 2006;91:3196–3205. doi: 10.1529/biophysj.106.083485. [DOI] [PMC free article] [PubMed] [Google Scholar]
- Whitfield CW, Cziko AM, Robinson GE. Gene expression profiles in the brain predict behavior in individual honey bees. Science. 2003;302(5643):296–299. doi: 10.1126/science.1086807. [DOI] [PubMed] [Google Scholar]