

Abstract
Nitrogen (N) and phosphorus (P) deficiency are primary constraints for plant productivity, and root system architecture (RSA) plays a vital role in the acquisition of these nutrients. The genetic determinants of RSA are poorly understood, primarily owing to the complexity of crop genomes and the lack of sufficient RSA phenotyping methods. The objective of this study was to characterize the RSA of two Brachypodium distachyon accessions under different nutrient availability. To do so, we used a high-throughput plant growth and imaging platform, and developed software that quantified 19 different RSA traits. We found significant differences in RSA between two Brachypodium accessions grown on nutrient-rich, low-N and low-P conditions. More specifically, one accession maintained axile root growth under low N, while the other accession maintained lateral root growth under low P. These traits resemble the RSA of crops adapted to low-N and -P conditions, respectively. Furthermore, we found that a number of these traits were highly heritable. This work lays the foundation for future identification of important genetic components of RSA traits under nutrient limitation using a mapping population derived from these two accessions.
Keywords: Brachypodium distachyon, root system architecture, phosphorus, nitrogen, high-throughput imaging, image analysis
1. Introduction
The Poaceae family includes premier cereal crops such as wheat, rice and maize that currently supply most dietary calories to people worldwide [1], and increased global food output in the past five decades has resulted primarily from improved productivity of these three crops [2,3]. However, our population is predicted to increase by 40 per cent by 2030, which will outpace both the current rate of yield increases for the major cereals, and the availability of arable land [4,5]. Therefore, improved cereal varieties that produce higher yields without increasing land use need to be developed. Global population growth and industrialization are also depleting non-renewable fossil fuel reserves, and several Poaceae family members including sugarcane, miscanthus and switchgrass are currently being used or developed as bioenergy feedstocks [6–8]. Thus, key members of the Poaceae family will probably play a central role in both food and fuel security in the coming decades.
One reason for current, historically high crop yields is the increased use of nitrogen (N) and phosphorus (P) fertilizers [9,10]. In fact, it has been estimated that 30–50% of the Earth's population depends on fertilizer inputs to produce food [11]. Indeed, N and P are the two most important, and the two most limiting, nutrients for plant growth in soil [12,13]. However, the escalated use of these inputs has had profoundly negative effects on the environment [14–16], as only 30–40% of applied nutrient fertilizers are absorbed by plants [12], leaving the remainder to volatilize or leach into the environment. In addition, phosphate rock reserves are decreasing in quality, are becoming more costly to extract, process, and ship, and are non-renewable [10]. These problems are exacerbated in developing nations, where fertilizers are often too expensive or difficult for farmers to obtain [17,18], and may have limited utility in nutrient-poor, tropical soils [17–19]. Therefore, in both developed and developing countries, future gains in agricultural production will probably require the creation of genetically improved crops capable of growing on soils with reduced nutrient inputs.
Genetic improvements in crops have been made over thousands of years by the selection, breeding and engineering of desirable traits to increase yield and quality [20–22]. In the past five decades, many of these improvements have occurred under nutrient-rich conditions, resulting in plants with high nutrient requirements [23,24]. For obvious reasons, these efforts have primarily focused on above-ground traits to the exclusion of roots. However, future crop yield increases with reduced nutrient inputs will likely benefit from improved root traits. The root system is entirely responsible for the acquisition of water and essential nutrients from the soil, and a larger proportion of biomass is shifted to root production under nutrient limitation [19,25,26]. Plants continuously add new roots over their lifetimes, and the number and location of roots is collectively termed as the root system architecture (RSA) [27,28]. Different RSAs are important for plant growth when resources are limited. For instance, deep rooting has been correlated with drought tolerance in bean [29], wheat [30] and maize [31]. In contrast, dense, shallow root growth has been associated with better performance under low P conditions in common bean, soya bean [32] and maize [33]. RSA is also plastic, enabling plants to alter root growth in response to the availability of nutrients [27,34,35]. For example, some bean and maize varieties alter rooting angle and lateral root proliferation in response to low P conditions [36,37], and some maize varieties grow deeper axile roots with reduced N [38]. The direct identification and improvement of both constitutive and plastic RSA traits are likely to improve plant nutrient acquisition, and thus crop efficiency and productivity [19,39,40].
Root phenotyping remains a major bottleneck to the discovery of genes that control important RSA traits, and constraints are experienced on at least two levels [39,41]. The first constraint concerns the observation of root systems in their native soil environment. In the field, even the most advanced procedures offer only a partial glimpse of RSA [41]. To overcome this limitation, several laboratory and greenhouse growth methods have been developed that provide relatively easy access to the roots of a variety of plant species [41,42]. While each of these methods offers clear advantages to the study of root development, most of them suffer from certain drawbacks such as failing to preserve three-dimensional RSA, lacking resolution and throughput, being cost-prohibitive or preventing repeated measurements of the same root system over time [41,42]. Of the currently available approaches, the authors believe that the growth of roots in gellan gum media holds the most promise for RSA phenotyping as it preserves three-dimensional RSA, and it allows for the repeated, non-destructive, quick and economical observation of plant root systems [43]. The second constraint involves quantifying RSA traits from field or laboratory grown plants. Information about RSA is typically collected by digital imaging or scanning, and then quantified by methods with various levels of automation [41,42]. High-throughput, semi-automated methods offer the greatest ability to quantify complex RSA on a large number of genotypes, replicates and conditions as required in large genetic experiments.
RSA is a complex trait regulated by multiple genes in a quantitative manner. Several quantitative trait loci (QTL) associated with RSA under nutrient limitation have been identified in crop species [44]. However, few of the underlying quantitative trait nucleotides have been identified. This is presumably owing to either the size and complexity of crop genomes or the relatively small effects of the QTL on root development. Thus, attention has been focused on the model dicot Arabidopsis thaliana, and a great deal has been learned about fundamental root development and RSA responses to nutrient availability [45,46]. However, there are substantial differences in RSA between dicots like Arabidopsis and monocot crop species [47,48]. Thus, the development of a model monocot for the direct study of RSA would be beneficial. Brachypodium distachyon has recently emerged as a temperate grass model because of its relatively small, sequenced genome, small stature and close evolutionary relation to important crop species such as wheat [49,50]. Furthermore, numerous Brachypodium accessions have been collected that show extensive phenotypic variation for a number of above-ground traits [51,52], suggesting that natural variation for RSA also exists. Finally, the Brachypodium root system shows considerable similarity to the root system of wheat, but with less complexity [53]. Therefore, B. distachyon can serve as a good model species for the genetic study of grass RSA.
The objective of this study was to explore natural variation of RSA in two different accessions of the model grass B. distachyon under nutrient-sufficient and -limiting conditions. To capture information about complex three-dimensional RSA, we used a semi-automated imaging and analysis platform that quantifies 19 different root traits on multiple two-dimensional images of plants growing in gellan-gum media. Using this system, we found robust and reproducible differences in RSA between accessions on nutrient-rich, reduced P and reduced N conditions. This work sets the stage for the identification of important genetic determinants of natural variation in RSA under nutrient limitation, with implications for future application in important crop species within the Poaceae.
2. Material and methods
(a). Plant materials
Brachypodium distachyon varieties Bd21 and Bd3-1 were obtained from Dr David Garvin at the USDA-ARS Plant Science Research Unit and Department of Agronomy and Plant Genetics, University of Minnesota, USA.
(b). Experimental design
The experiment was a randomized block design with a 3 × 2 factorial arrangement of treatments. The factors were media condition (control, low N, low P), and genotype (Bd21 and Bd3-1), with 22–37 biological replicates split between two (low P) or three (low N) experiments.
(c). Growth conditions
Seeds were selected for uniform size, dehulled, surface-sterilized in 70 per cent ethanol for 5 min, and imbibed for 24 h in sterile water at 25°C in the dark. Then seeds were germinated for 24 h in the dark at 25°C on gellan gum Petri plates containing 15 ml each of the identical media used for final plant growth (see below), with an exception of 0.3 per cent Gelzan. Seedlings of similar size were transplanted individually and grown for 19 days in 2 l ungraduated borosilicate cylinders (Thermo Fisher Scientific, Waltham, MA, USA) containing 800 ml each of gellan gum nutrient solution adapted from Johnson et al. [54]. Control nutrient solution consisted of (in µM) NO3 (14 000), NH4 (2000), P (2000), K (6050), Ca (4000), SO4 (1000), Mg (1000), Cl (50), B (25), Mn (2), Zn (2), Cu (0.5) Mo (0.5) and EDTA-Fe (50). Based on preliminary studies, the N level of control media was reduced to 100 µM NO3 and 10 µM NH4 for low-N treatment, and the P level of control media was reduced to 1 µM P for low-P treatment. All nutrient solutions were adjusted to pH 5.7, and were solidified with 0.2% (w/v) Gelzan gellan gum (Sigma–Aldrich, St Louis, MO, USA). The plants were grown in PGR15 growth chambers (Conviron, Winnipeg, Manitoba) with a 16 L : 8 D photoperiod at 23°C. Relative humidity was 50 per cent and light had a photosynthetic flux density of 340 µmol photons m−2 s−1 at the level of the top of cylinders.
(d). Root imaging
Plants were imaged at 19 days after transplanting on a semi-automated imaging station similar to the one previously described [43,55]. Essentially, cylinders containing plant roots growing within Gelzan media were submerged in a rectangular acrylic tank filled with water to correct for distortion of the root system caused by refraction from the curved surface of the glass cylinder. Plants were backlit with a fluorescent light box (VWR, Radnor, PA, USA), and cylinders were rotated on an acrylic turntable within the water tank that was magnetically interfaced with an electronic turntable (PhotoCapture360) located underneath the tank. Images of the root system were captured every 18° through a full 360° rotation (20 images per plant) on a Dell Latitude E5500 laptop computer (Dell Inc., Round Rock, TX, USA) using software from Ortery Technologies (Irvine, CA, USA) connected to a Canon EOS Rebel XSi digital camera (Canon Inc., Lake Success, NY, USA) with 50 mm macrolens.
(e). Image analysis for root traits
The analysis of root system traits was carried out in a manner similar to that reported previously [43]. Briefly, the original images were first registered to align the axis of the cylinder across all images. The images were then cropped automatically to remove any non-root artefacts that may be present in the cylinder. The resulting cropped images were converted to binary images using an adaptive thresholding procedure. Next, each two-dimensional image was analysed with an automatic phenotyping programme developed in-house (adapted from Iyer-Pascuzzi et al. [43]) to calculate the following 19 RSA traits: average root width, bushiness, depth, ellipse axes aspect ratio, length distribution, major ellipse axes, maximum number of roots, maximum width, median number of roots, minor ellipse axes, network area, network convex area, perimeter, solidity, specific root length, surface area, total length, volume and width depth ratio. All traits were as defined earlier [43] with the exception of major ellipse axes, minor ellipse axes and ellipse axes aspect ratio. Major ellipse axes and minor ellipse axes represent the lengths of the major and minor axes of an ellipse best fit to the overall shape and size of the root system. Ellipse axes aspect ratio represents the ratio of the length of the minor ellipse axis to the length of the major ellipse axis. The mean value for each trait was calculated from each group of 20 images per plant, and the mean trait values from 22 to 37 replicates were averaged to determine the mean trait values for each genotype on each condition. Percentage nutrient response was calculated by finding the difference in trait value between low-N or -P and control media, divided by the trait value on control medium.
(f). Representative plant selection
The representative plant was chosen automatically from the replicates of a given genotype (Bd3-1 or Bd21) and media condition (control, low-P or low-N) using the following computational procedure. The mean trait (mt) over all angles was calculated for each plant. The mean values (mt) for each of the 19 traits were then concatenated into a vector Mg,s,r, where ‘g’ is the genotype, ‘s’ is the media (soil) condition and ‘r’ is the index of that replicate. The median (Dg,s) of the distribution of the means of replicates was calculated as:
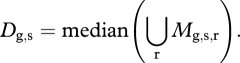 |
The representative plant is defined as the replicate index (r*) of the plant that minimizes the normalized Euclidean distance between the median vector Dg,s and the replicate mean vector Mg,s,r.
where C is a diagonal matrix containing the variances of each of the traits.
(g). Statistical analyses
Significant genotype, media and G × M effects were confirmed by two-way multivariate analysis of variance (MANOVA) using all 19 root traits as dependent variables, with media condition and genotype as factors, experiments nested within media conditions and all effects as fixed. The statistical model used was:
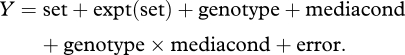 |
‘Set’ refers to the two groups of experiments, one for low-P, and one for low-N. Expt is a random effect and other factors are fixed.
For individual root traits, significant differences between trait means for the different factors that were calculated by multiple comparison using ANOVA. The results of the test are reported using asterisks: one asterisk if the genotypes are significantly different at 5 per cent, two asterisks if they are significant at 1 per cent. Significant G × M interactions were determined for individual root traits by two-way ANOVA, using the statistical model presented above.
Broad sense heritability was calculated using a linear model in R (function ‘lme’ in package ‘nlme’), with experiment as a fixed effect and genotype as a random effect. For each feature and condition, heritability is the variance component attributed to genotype in the model, divided by the total variance.
3. Results
(a). Brachypodium accessions Bd21 and Bd3-1 show distinctly different root system architectures on nutrient-rich media
Using our high-throughput imaging platform, we observed distinct differences in RSA between two diploid and inbred Brachypodium accessions, Bd21 and Bd3-1 [56], grown for 19 days on control media. These accessions were chosen because they have been used as parents to generate recombinant inbred lines (RILs) [57] useful for mapping QTL. To select the single, most representative root system of each genotype to display, we used computational methods (see §2) to guard against personal, subjective bias and examples are shown in figure 1. Qualitatively, Bd21 plants appeared to have wider and more branched root systems (figure 1a), while the root systems of Bd3-1 plants were narrower and less branched (figure 1b). The branched appearance of Bd21 root systems is because of a greater number of lateral roots in contrast to Bd3-1 (figure 1a, arrows).
Figure 1.

Brachypodium accessions Bd21 and Bd3-1 show differences in root system architecture on various nitrogen and phosphorus conditions. Representative examples of 19-day-old Brachypodium accessions Bd21 (a,c,e) and Bd3-1 (b,d,f) on control (a,b), low-N (c,d) and low-P (e,f) media. Arrows point to lateral roots, arrowheads point to axile roots.
To quantify RSA, we developed a semi-automated root analysis programme (modelled after Iyer-Pascuzzi et al. [43]) that measures 19 different root traits of varying complexity (see §2). Importantly, these traits provide a detailed descriptive analysis of the overall shape, size and distribution of roots within the root system, but they do not identify particular types of roots. Thus, we have to infer information about specific root types based on qualitative information from root images in combination with the quantitative data. Using this software, we found that 16/19 RSA traits were significantly different between Bd21 and Bd3-1 on control medium (figure 2). Out of nineteen of these traits, 13 were greater in Bd21 plants; the most dramatic examples include the maximum width of the root system (max width), maximum (max no roots) and median (median number of roots) root number, total root length (total length), network area and network convex area (figure 2). Specific root length, which is a measure of total root length per root volume, was also increased in Bd21 when compared with Bd3-1. Only three of 19 root traits, including average root width, length distribution (in the upper third of the root system) and major ellipse axis were lower for Bd21 than for Bd3-1 (figure 2). These results demonstrate that our quantification of RSA is consistent with qualitative observations.
Figure 2.

Comparison of 19 root traits for Bd21 and Bd3-1 on control medium. Brachypodium accessions Bd21 and Bd3-1 grown for 19 days on control medium were imaged and analysed for 19 different root system architecture traits. Box and whisker plots represent minimum, lower quartile, median, upper quartile and maximum trait values. Statistical significance is indicated by **p < 0.01; n ≥ 22.
(b). The root systems of Bd21 and Bd3-1 respond differently to nitrogen limitation
To observe the behaviour of Brachypodium RSA to N scarcity, and to see if this response varied among accessions, we grew Bd21 and Bd3-1 plants for 19 days on both control (16 mM N) and low-N (0.11 mM N) media. Plants were then imaged and analysed as described above. Qualitatively, both Bd21 and Bd3-1 plants showed distinct responses to N limitation. Bd3-1 maintained relatively deep growth of approximately three axile roots (figure 1d, arrowheads), and produced lateral roots on at least one of the axile roots (figure 1d, arrow). This overall RSA behaviour strongly resembled growth of the Bd3-1 root system on the control medium (figure 1b), suggesting relative insensitivity of RSA to low N. Strikingly, Bd21 root growth was significantly reduced on low N, with at most one axile root growing deeper into the medium (figure 1c, arrowhead), and containing few lateral roots (figure 1c, arrow). This contrasted with the relatively large and branched root system of Bd21 plants on control medium (figure 1a), indicating a strong sensitivity to reduced N.
We quantified RSA of Bd21 and Bd3-1 plants on low N, and compared the root trait values with those from plants grown on control medium. Importantly, significant multivariate effects of genotype (G), media condition (M) and G × M effects were observed with two-way multivariate analysis of variance (MANOVA). Having established these influences on many aspects of RSA, we use α = 0.05 for subsequent univariate tests on individual root traits (electronic supplementary material, table S1) [58]. Our results show that 14 of 19 root traits significantly differed between Bd21 low-N and control plants, while only eight of 19 traits changed for Bd3-1 (table 1). This is consistent with the qualitative observation that the Bd21 RSA is highly sensitive to reduced N. Eleven of 14 Bd21 traits were decreased at low N, including maximum and median root number, network area, perimeter, surface area, total root length and root volume. The total area explored by the root system was also decreased, as indicated by lower network convex area. Because both network area and network convex area decreased, solidity (network area/convex area) was also reduced. Bd3-1 plants also had a smaller root system on low N when compared with control medium (table 1); however, only six of 19 traits were decreased including average root width, median root number, network area, solidity, surface area and root volume. Interestingly, Bd3-1 maintained total root length while decreasing volume, resulting in higher specific root length.
Table 1.
Mean values and responses of Bd21 and Bd3-1 root traits on different nitrogen and phosphorus conditions. Units are centimetres, square-centimetre, cubic-centimetre or unitless ratios, as appropriate.
| trait | Bd3-1 |
Bd21 |
||||||||
|---|---|---|---|---|---|---|---|---|---|---|
| control | low N | low P | % N response | % P response | control | low N | low P | % N response | % P response | |
| average root width | 0.020 | 0.018* | 0.020 | −9.3 | −1.0 | 0.017 | 0.019* | 0.016* | 14.5 | −6.4 |
| bushiness | 1.8 | 1.8 | 1.3 | 0.7 | −28.6 | 1.5 | 2.2* | 2.3* | 42.8 | 51.3 |
| depth | 10.9 | 11.5 | 9.7* | 5.2 | −11.2 | 10.2 | 9.1 | 8.6* | −11.6 | −15.8 |
| ellipse axes aspect ratio | 0.26 | 0.25 | 0.23 | −0.4 | −9.2 | 0.31 | 0.31 | 0.37 | −2.6 | 17.1 |
| length distribution | 1.0 | 0.7 | 0.9 | −26.0 | −14.2 | 0.71 | 1.1* | 1.4* | 58.2 | 95.5 |
| major ellipseaxes | 11.0 | 11.8 | 10.1 | 7.6 | −8.4 | 9.5 | 9.3 | 7.3* | −2.2 | −23.1 |
| max. no. roots | 6.7 | 5.2 | 5.7 | −22.1 | −15.4 | 12.8 | 4.1* | 17.9* | −68.2 | 39.4 |
| max. width | 2.6 | 3.0* | 2.2* | 17.6 | −16.1 | 3.3 | 2.7* | 3.0 | −17.5 | −7.7 |
| median number of roots | 4.2 | 3.0* | 4.4 | −30.2 | 4.9 | 8.7 | 2.1* | 8.4 | −75.4 | −2.8 |
| minor ellipse axes | 2.7 | 3.0 | 2.3* | 12.3 | −12.7 | 2.9 | 2.6 | 2.7 | −8.4 | −7.9 |
| network area | 1.9 | 1.5* | 1.6 | −21.7 | −15.6 | 3.0 | 1.0* | 2.8 | −65.7 | −4.9 |
| network convex area | 21.2 | 25.3 | 16.8* | 19.3 | −20.8 | 24.7 | 16.4* | 19.1* | −33.3 | −22.4 |
| perimeter | 117 | 101 | 96.1 | −13.3 | −17.7 | 213.3 | 65.1* | 215.8 | −69.5 | 1.2 |
| solidity | 0.10 | 0.07* | 0.10 | −31.7 | 8.2 | 0.12 | 0.07* | 0.15* | −44.9 | 22.0 |
| specific root length | 771 | 913* | 781 | 18.4 | 1.3 | 1039 | 814* | 1152* | −21.6 | 11.0 |
| surface area | 6.1 | 4.7* | 5.2 | −23.2 | −14.7 | 9.2 | 3.0* | 8.7 | −67.1 | −4.8 |
| total length | 49.8 | 41.6 | 41.9 | −16.6 | −15.9 | 88.6 | 25.8* | 88.7 | −70.9 | 0.2 |
| volume | 12.2 | 8.7* | 10.3* | −28.7 | −15.4 | 16.1 | 6.0* | 14.9 | −63.0 | −7.9 |
| width depth ratio | 0.25 | 0.27 | 0.22 | 7.8 | −9.8 | 0.34 | 0.32 | 0.36 | −6.1 | 6.0 |
*p < 0.05 compared with control.
We determined the percentage response of Bd21 and Bd3-1 to low-N, and found that both had reduced median root number, surface area and volume (table 1); however, the percentage reduction of these traits was much greater in Bd21 plants (e.g. 75.4% reduction of median root number for Bd21 when compared with 30.2% reduction for Bd3-1). Furthermore, a number of traits were not affected in Bd3-1 but significantly reduced in Bd21, including maximum root number, total root length and perimeter (decreased 68.2%, 70.9% and 69.5%, respectively). Interestingly, Bd21 increased length distribution and bushiness by 58.2 and 42.8 per cent, respectively, shifting root growth to the upper one-third of the root system, and these traits were not significantly changed for Bd3-1. We confirmed the differences in response to low N between Bd21 and Bd3-1 by two-way ANOVA, and observed significant G × M interactions for all of the traits mentioned above (electronic supplementary material, table S2).
(c). The root systems of Bd21 and Bd3-1 respond differently to phosphorus limitation
To observe Brachypodium RSA on reduced P, and determine whether these responses were different between accessions, we grew Bd21 and Bd3-1 for 19 days on both control medium (2 mM P), and low-P medium (1 μM P). We observed that the root systems of both Bd21 and Bd3-1 plants were responsive to P limitation. For both accessions, the overall depth of the root system appeared to be reduced when compared with controls (figure 1a,b,e,f). Furthermore, Bd21 root systems maintained lateral root formation (figure 1e, arrows), while Bd3-1 plants did not display any visible lateral root growth (figure 1f, lack of arrows).
Upon quantification of RSA traits, we found that Bd21 plants again displayed significant changes in a greater number of traits (9/19) than Bd3-1 plants (5/19) in response to low P (table 1). In general, these root modifications reinforce qualitative observations, with maximum root depth and average root width reduced in Bd21 plants, while maximum root number, length distribution and bushiness increased. In contrast, Bd3-1 RSA was relatively unchanged at low P when compared with control medium. The overall size of the area that the Bd3-1 root system occupied was smaller in response to reduced P, as indicated by lower maximum root depth, width, minor ellipse axes and network convex area.
By comparing the magnitudes of the responses of Bd21 and Bd3-1 RSA traits with low P, we found that Bd21 dramatically and significantly increased length distribution, bushiness and maximum root number by 95.5, 51.3 and 39.4 per cent, respectively; while these traits were not significantly changed in Bd3-1 (table 1; Bd21 and Bd3-1, %P response). Differences in root trait response were confirmed by significant G × M values (electronic supplementary material, table S2). Of the root traits that significantly responded to low P in both accessions, root depth, network convex area and volume all decreased. The magnitudes of these responses were not significantly different between Bd21 and Bd3-1 as evidenced by lack of significant G × M interactions.
(d). Bd21 and Bd3-1 root system architecture traits on differential nutrient availability are highly heritable
To estimate the proportion of total phenotypic variation for each root trait that is under genetic control, we calculated broad-sense heritability ratios for all 19 RSA traits and present them in table 2. Heritability ratios that exceed 0.5 indicate a strong genetic component, which is amenable to further genetic analysis. We found that network area, surface area, total root length and volume had heritability estimates greater than 0.5 across all three conditions. Average root width, maximum root number, median root number, perimeter, solidity and specific root length showed relatively high heritability values in control and low-P conditions. Interestingly, values for major ellipse axes and depth were only high under low-N and low-P, while bushiness, length distribution and width-to-depth ratio only showed high heritability on low P.
Table 2.
Broad-sense heritability for 19 root traits on different nitrogen and phosphorus conditions.
| trait | control | low N | low P |
|---|---|---|---|
| average root width | 0.65 | 0.22 | 0.93 |
| bushiness | 0.02 | 0.07 | 0.74 |
| depth | 0.14 | 0.50 | 0.55 |
| ellipse axes aspect ratio | 0.25 | 0.09 | 0.68 |
| length distribution | 0.15 | 0.35 | 0.62 |
| major ellipse axes | 0.39 | 0.52 | 0.90 |
| maximum number of roots | 0.73 | 0.23 | 0.90 |
| max. width | 0.48 | 0.03 | 0.65 |
| median number of roots | 0.71 | 0.26 | 0.67 |
| minor ellipse axes | 0.05 | 0.07 | 0.13 |
| network area | 0.61 | 0.54 | 0.78 |
| network convex area | 0.09 | 0.32 | 0.12 |
| perimeter | 0.66 | 0.46 | 0.85 |
| solidity | 0.50 | 0.00 | 0.75 |
| specific root length | 0.66 | 0.22 | 0.91 |
| surface area | 0.59 | 0.56 | 0.76 |
| total length | 0.64 | 0.51 | 0.84 |
| volume | 0.51 | 0.59 | 0.64 |
| width depth ratio | 0.35 | 0.06 | 0.72 |
4. Discussion
In this paper, we described the first look at natural variation of RSA in the model grass B. distachyon. Our results not only demonstrate differences in RSA between two Brachypodium accessions on nutrient-rich media, but also provide the first report of Brachypodium RSA response variation to limiting N and P availability. More specifically, Brachypodium accessions Bd21 and Bd3-1 showed significant and distinct root growth responses to reduced N and P concentrations, and these responses resembled changes in RSA in other crop species (see §4b–d). Moreover, many of the RSA traits that showed significant differences on differential nutrient supply between Bd21 and Bd3-1 also showed high broad-sense heritability values. This study was made possible by our high-throughput root phenotyping and analysis platform for capturing an abundance of information about the complex architecture of the Brachypodium root system. Thus, these results lay the groundwork for high-throughput RSA phenotyping and mapping of QTL for physiologically relevant RSA traits in an RIL population derived from these two Brachypodium accessions.
(a). Natural variation of Brachypodium distachyon root system architecture
Natural phenotypic variation in B. distachyon has been reported for a number of above-ground traits. For instance, a survey of 146 inbred lines collected from diverse geographical regions of Turkey showed that plant height varied from 53–132 cm, plant stature ranged from erect to highly branched, time to seed set differed by 15 weeks and seed yield varied from 4 to over 700 seeds [52]. Similarly, wide variation in shoot biomass, flowering time and vernalization response was reported among 24 Brachypodium accessions from various geographic locations [59]. Most recently, an investigation of drought tolerance in 57 natural Brachypodium varieties demonstrated large differences in leaf water content and chlorophyll fluorescence when plants were drought-stressed [60]. Bd21 and Bd3-1 were among the varieties surveyed in the above-mentioned studies, and variation above ground was observed between these two accessions for flowering time, total biomass, plant stature and drought tolerance [52,59,60]. As plants are known to coordinate aerial and below-ground organ development to maintain a balance between the collection of light energy for photosynthate production, and the acquisition of important water and nutrients from the soil [61,62], we predicted that there would be differences in RSA between Bd21 and Bd3-1.
Consistent with these predictions, we observed differences in Bd21 and Bd3-1 RSA on both nutrient-rich (control) conditions and in response to nutrient limitation (low-N and low-P). On control medium, both visual and quantitative inspection of RSA showed that Bd21 plants had a wider and more highly branched root system, while Bd3-1 roots were relatively less-branched and deeper (figures 1a,b and 2). Interestingly, these general qualitative descriptions are two of the most highly cited ideotypes for RSA that benefit plant growth on low-P and -N conditions, respectively (see §4b–d). Thus, we were interested to determine if these potentially physiologically interesting RSA characteristics were maintained under P- and N-deficient conditions.
(b). Root system architecture on limited nitrogen
In crop species, plants typically increase axile root length while decreasing axile root number under N limitation. For example, a study of maize RILs grown on four contrasting N concentrations in solution culture showed an increase in axile root length at the two lowest N concentrations, and these changes were correlated with increased N accumulation in plants [63]. Similar results were observed for seven maize inbred lines and 21 hybrids derived from these inbreds, where average axile root length increased and total root length increased or was maintained under diminished N in sand culture, while fewer axile roots were formed [38]. There are mixed reports on the effects of reduced N on lateral rooting, with some studies claiming reduced lateral root formation [63], and others showing increased lateral root proliferation and/or density [38,64]. In general, it is believed that increased lateral and axile root growth may be an adaptive response for plants to efficiently take up more N from the soil, particularly as the roots explore deeper soil layers [38,63]. In our study, both visual and quantitative measures of RSA showed that Brachypodium accessions Bd21 and Bd3-1 had strikingly different responses to N limitation. Bd21 plants were highly responsive to low N, and drastically reduced most RSA parameters including total root length, surface area, volume and lateral root formation, while shifting growth towards the upper portion of the media (figure 1c and table 1). These Bd21 RSA responses appear to be largely opposite to those observed in crop species adapted to reduced N. In contrast, Bd3-1 RSA was relatively insensitive to reduced N; maximum root depth was maintained by multiple axile roots per plant (table 1 and figure 1d), and total root length was comparable with plants on control conditions (table 1). Bd3-1 also maintained lateral root growth, detected visually (figure 1d) and quantitatively by a decrease in average root width and an increase in specific root length (table 1). The maintenance of root growth on low N may provide Bd3-1 plants with an adaptive advantage on this condition. Mapping the genetic components of root growth maintenance on low N in Brachypodium could be extremely valuable for both understanding the underlying genetic pathways that control this process, and improving RSA under N deficiency in other crop species.
(c). Root system architecture on limited phosphorus
Plants typically respond to P limitation by reducing total plant biomass, and diverting resources disproportionately towards root growth [33,37]. In many soil types, P is localized to the upper soil layers and immobilized with other molecules [65]. Predictably, under limiting phosphorous, plants that proliferate roots into these upper layers outperform varieties with deeper root systems [33,36,37,66]. For instance, common bean plants with shallower basal root angles and increased basal root growth under P limitation were capable of increasing shoot P concentration and biomass compared with deep-rooted varieties [66], and these RSA responses were correlated with increased seed yield in the field [36]. Similar results have been reported for maize, where hybrids with increased total and relative root growth in the topsoil had greater shoot P concentrations and shoot biomass [33]. Increased lateral rooting has also been positively correlated with P acquisition in maize plants under P limitation. For example, genotypes with enhanced or sustained lateral root number and length were able to promote plant growth compared to genotypes with reduced lateral root production [37,67]. Cost–benefit analyses determined that lateral root formation was beneficial under P limitation, having relatively lower production costs than other root types [37]. In the current study, we found both common and differential responses of Bd21 and Bd3-1 RSA to P scarcity. Both genotypes showed a relative reduction in root system depth and network convex area, which we presume to be a common response to P limitation (figure 1e,f and table 1). All other RSA responses were strikingly different between accessions. Bd3-1 was relatively insensitive to reduced P, save for a clear absence in lateral root formation (figure 1f and table 1). The lack of lateral roots in Bd3-1 is opposite to increased lateral root proliferation typically observed in crops adapted to low P. In contrast, Bd21 strongly increased lateral root proliferation in the upper third of the root system, consistent with plants adapted to P limitation (figure 1e and table 1). Mapping QTL for lateral root proliferation under P limitation in Brachypodium, which we observed as increased length distribution and bushiness using our quantification methods, could further our understanding of plant low-P adaptation with possible future applications to improve crop growth under P deficiency.
(d). Constitutive versus plastic root system architecture
Interestingly, the RSA traits of Bd3-1 and Bd21 plants under nutrient limitation that most resemble adaptive RSA traits in crop species are also apparent when these genotypes are grown under nutrient-sufficient conditions. For instance, Bd3-1 maintained deeper axile root growth and lateral root proliferation on low N medium when compared with Bd21, which is typical of a low N adaptation. However, this is not a plastic response in Bd3-1 but rather maintenance of its RSA under nutrient-sufficient conditions (figure 1b,d). Likewise, Bd21 had a relatively large and branched root system on control medium, and maintained the proliferation of fine roots under P limitation (figure 1a,e). Thus, the constitutive RSA of Bd3-1 and Bd21 may reflect adaptation to low N and low P, respectively. As an additional layer of complexity, Bd21 RSA appears to be more plastic than Bd3-1 RSA. The relative importance of constitutive root traits versus plastic responses to plant growth on nutrient limitation is an interesting topic that has not been thoroughly explored, and there are examples where both behaviours are equally effective in promoting plant growth. For example, common bean varieties that either produced shallow root systems only under P limitation, or that exhibited constitutively shallow RSA, were both capable of outperforming genotypes with deeper root systems grown on limited P [36]. In a different study of five maize genotypes grown on contrasting P conditions, two of the three genotypes that maintained total plant biomass under P limitation produced an invariantly high number and length of lateral roots on both high and low P conditions, whereas the third only increased lateral root length and number under P limitation [37]. While both constitutive and plastic root traits can contribute to fitness under stress conditions, it seems likely that constitutive root traits may be most advantageous in environments where single stresses predominate while plastic responses may provide an advantage under conditions with multiple or changing stresses [29]. For instance, genotypes with invariant, shallow root proliferation might outperform genotypes with plastic responses under P limitation, but plastic genotypes may perform better when additional stresses like drought or reduced N are encountered [66].
(e). Mapping quantitative trait loci underlying root system architecture traits
Extensive phenotypic variation exists for RSA traits in many plant species [39,44], and several studies have mapped QTLs for important RSA traits under N and P limitation in maize [64,67], rice [68] and wheat [69]. QTLs for root traits in maize grown under N deficiency have shown positive correlations with QTLs for yield [64]. Furthermore, correlations have been observed between wheat and maize root trait QTLs and those for N use efficiency [9]. Under P limitation, QTL have been mapped for enhanced seminal and lateral root growth [67,70]. However, relatively little is known about the genes controlling RSA in crop species, particularly those involved in nutrient responses. This can be attributed to the large and complex genomes of crop species, the resources needed to grow plants of large stature and the shortcomings of available root phenotyping methods that prohibit high-resolution analyses of large numbers of plants.
These limitations have been largely overcome in the model dicot A. thaliana, and most of our knowledge of the genetic pathways controlling root growth and RSA responses to nutrients have been discovered in this species [45,46,71]. However, there are fundamental differences in root system development between Arabidopsis and monocot species. Brachypodium presents many of the same desirable attributes as Arabidopsis, while also maintaining typical grass root development [49,50]. Indeed, a recent article demonstrated that most root types found in wheat were preserved in Brachypodium, with considerably lower complexity [53]. Our analysis of RSA in this report has demonstrated that Brachypodium accessions Bd21 and Bd3-1 exhibit contrasting root traits under nutrient-limiting conditions that resemble adaptive traits in crop species, and that are likely to be heritable. We have also outlined a high-throughput root phenotyping platform, which has allowed us to quantitatively capture important information about complex RSA. Together, this should allow us to efficiently map important QTL for RSA traits under nutrient limitation in an RIL population derived from a cross between Bd21 and Bd3-1 [57].
Acknowledgements
We thank Dr David Garvin for providing the Bd21 and Bd3-1 seed and Dr Thomas Mitchell-Olds for kindly assisting with statistical analyses and providing helpful comments on the manuscript. We apologize to any authors whose research was not cited owing to space limitations. Research at GrassRoots Biotechnology on improving root architecture in energy crops is supported by the Small Business Innovation Research (SBIR) programme of the USDA National Institute for Food and Agriculture (NIFA), grant no 2010-33610-21633.
References
- 1.von Braun J. 2007. The world food situation: new driving forces and required actions. Washington, DC: International Food Policy Research Institute; 10.2499/0896295303 (doi:10.2499/0896295303) [DOI] [Google Scholar]
- 2.Khush G. S. 1999. Green revolution: preparing for the 21st century. Genome/Natl Res. Council Canada 42, 646–655 Epub 28 August 1999 10.1139/g99-044 (doi:10.1139/g99-044) [DOI] [PubMed] [Google Scholar]
- 3.Cassman K. G. 1999. Ecological intensification of cereal production systems: yield potential, soil quality, and precision agriculture. Proc. Natl Acad. Sci. USA 96, 5952–5959 10.1073/pnas.96.11.5952 (doi:10.1073/pnas.96.11.5952) [DOI] [PMC free article] [PubMed] [Google Scholar]
- 4.Tilman D., Cassman K. G., Matson P. A., Naylor R., Polasky S. 2002. Agricultural sustainability and intensive production practices. Nature 418, 671–677 10.1038/nature01014 (doi:10.1038/nature01014) [DOI] [PubMed] [Google Scholar]
- 5.Mann C. C. 1999. Crop scientists seek a new revolution. Science 283, 310–314 10.1126/science.283.5400.310 (doi:10.1126/science.283.5400.310) [DOI] [Google Scholar]
- 6.Schmer M., Vogel K. P., Mitchell R. B., Perrin R. K. 2008. Net energy of cellulosic ethanol from switchgrass. Proc. Natl Acad. Sci. 105, 464–469 10.1073/pnas.0704767105 (doi:10.1073/pnas.0704767105) [DOI] [PMC free article] [PubMed] [Google Scholar]
- 7.Heaton E. A., Dohleman F. G., Long S. P. 2008. Meeting US biofuel goals with less land: the potential of Miscanthus. Glob. Change Biol. 14, 2000–2014 10.1111/j.1365-2486.2008.01662.x (doi:10.1111/j.1365-2486.2008.01662.x) [DOI] [Google Scholar]
- 8.Goldemberg J. 2006. The ethanol program in Brazil. Environ. Res. Lett. 1, 014008. 10.1088/1748-9326/1/1/014008 (doi:10.1088/1748-9326/1/1/014008) [DOI] [Google Scholar]
- 9.Hirel B., Le Gouis J., Ney B., Gallais A. 2007. The challenge of improving nitrogen use efficiency in crop plants: towards a more central role for genetic variability and quantitative genetics within integrated approaches. J. Exp. Bot. 58, 2369–2387 10.1093/jxb/erm097 (doi:10.1093/jxb/erm097) [DOI] [PubMed] [Google Scholar]
- 10.Cordell D., Drangert J. O., White S. 2009. The story of phosphorus: global food security and food for thought. Glob. Environ. Change 19, 292–305 10.1016/j.gloenvcha.2008.10.009 (doi:10.1016/j.gloenvcha.2008.10.009) [DOI] [Google Scholar]
- 11.Erisman J. W., Sutton M. A., Galloway J., Klimont Z., Winiwarter W. 2008. How a century of ammonia synthesis changed the world. Nat. Geosci. 1, 636–639 10.1038/ngeo325 (doi:10.1038/ngeo325) [DOI] [Google Scholar]
- 12.Glass A. D. M. 2003. Nitrogen use efficiency of crop plants: physiological constraints upon nitrogen absorption. Crit. Rev. Plant Sci. 22, 453–470 10.1080/07352680390243512 (doi:10.1080/07352680390243512) [DOI] [Google Scholar]
- 13.Lynch J. P., Deikman J. 1998. Phosphorus in plant biology: regulatory roles in molecular, cellular, organismic, and ecosystem processes. In Current Topics in Plant Physiology, American Society of Plant Physiologists Series no. 19. Rockville, MD: American Society of Plant Physiologists [Google Scholar]
- 14.Vitousek P. M., et al. 1997. Human alteration of the global nitrogen cycle: sources and consequences. Ecol. Appl. 7, 737–750 10.1890/1051-0761(1997)007[0737:HAOTGN]2.0.CO;2 (doi:10.1890/1051-0761(1997)007[0737:HAOTGN]2.0.CO;2) [DOI] [Google Scholar]
- 15.Parry R. 1998. Agricultural phosphorus and water quality: a US Environmental Protection Agency perspective. J. Environ. Qual. 27, 258–261 10.2134/jeq1998.00472425002700020003x (doi:10.2134/jeq1998.00472425002700020003x) [DOI] [Google Scholar]
- 16.Beman J. M., Arrigo K. R., Matson P. A. 2005. Agricultural runoff fuels large phytoplankton blooms in vulnerable areas of the ocean. Nature 434, 211–214 10.1038/nature03370 (doi:10.1038/nature03370) [DOI] [PubMed] [Google Scholar]
- 17.Hossner L. R., Juo A. S. R. 1999. Soil nutrient management for sustained food crop production in upland farming systems in the tropics. Extension Bulletin for the Food & Fertilizer Technology Center for the Asian and Pacific Region. Taipei, Taiwan: Food Fertilizer Technology Center. See http://www.agnet.org/library.php?func=view&id=20110804180328&type_id=4. [Google Scholar]
- 18.Delmer D. P. 2005. Agriculture in the developing world: connecting innovations in plant research to downstream applications. Proc. Natl Acad. Sci. USA 102, 15 739–15 746 10.1073/pnas.0505895102 (doi:10.1073/pnas.0505895102) [DOI] [PMC free article] [PubMed] [Google Scholar]
- 19.Lynch J. P. 2007. Turner review no. 14. Roots of the second green revolution. Aust. J. Bot. 55, 493–512 10.1071/BT06118 (doi:10.1071/BT06118) [DOI] [Google Scholar]
- 20.De Wet J. 1992. The three phases of cereal domestication. In Grass evolution and domestication (ed. Chapman G. P.). pp. 176–198 Cambridge, UK: Cambridge University Press [Google Scholar]
- 21.Gepts P. 2002. A comparison between crop domestication, classical plant breeding, and genetic engineering. Crop Sci. 42, 1780–1790 10.2135/cropsci2002.1780 (doi:10.2135/cropsci2002.1780) [DOI] [Google Scholar]
- 22.Buckler E. S., Thornsberry J. M., Kresovich S. 2001. Molecular diversity, structure and domestication of grasses. Genetic. Res. 77, 213–218 10.1017/S0016672301005158 (doi:10.1017/S0016672301005158) [DOI] [PubMed] [Google Scholar]
- 23.Kamprath E., Rodriguez R. 1982. Effects of nitrogen fertilization and recurrent selection on performance of hybrid populations of corn. Agron. J. 74, 955–958 10.2134/agronj1982.00021962007400060007x (doi:10.2134/agronj1982.00021962007400060007x) [DOI] [Google Scholar]
- 24.Earl C. D., Ausubel F. M. 1983. The genetic engineering of nitrogen fixation. Nutr. Rev. 41, 1–6 10.1111/j.1753-4887.1983.tb07114.x (doi:10.1111/j.1753-4887.1983.tb07114.x) [DOI] [PubMed] [Google Scholar]
- 25.Eghball B., Maranville J. 1993. Root development and nitrogen influx of corn genotypes grown under combined drought and nitrogen stresses. Agron. J. 85, 147–152 10.2134/agronj1993.00021962008500010027x (doi:10.2134/agronj1993.00021962008500010027x) [DOI] [Google Scholar]
- 26.Vamerali T., Saccomani M., Bona S., Mosca G., Guarise M., Ganis A. 2003. A comparison of root characteristics in relation to nutrient and water stress in two maize hybrids. Plant Soil 255, 157–167 10.1023/A:1026123129575 (doi:10.1023/A:1026123129575) [DOI] [Google Scholar]
- 27.Fitter A. H., Strickland T. R. 1991. Architectural analysis of plant root systems. 2. Influence of nutrient supply on architecture in contrasting plant species. New Phytol. 118, 383–389 10.1111/j.1469-8137.1991.tb00019.x (doi:10.1111/j.1469-8137.1991.tb00019.x) [DOI] [Google Scholar]
- 28.Lynch J. 1995. Root architecture and plant productivity. Plant Physiol. 109, 7–13 [DOI] [PMC free article] [PubMed] [Google Scholar]
- 29.Ho M. D., Rosas J. C., Brown K. M., Lynch J. P. 2005. Root architectural tradeoffs for water and phosphorus acquisition. Funct. Plant Biol. 32, 737–748 10.1071/FP05043 (doi:10.1071/FP05043) [DOI] [PubMed] [Google Scholar]
- 30.Reynolds M., Dreccer F., Trethowan R. 2007. Drought-adaptive traits derived from wheat wild relatives and landraces. J. Exp. Bot. 58, 177–186 10.1093/jxb/erl250 (doi:10.1093/jxb/erl250) [DOI] [PubMed] [Google Scholar]
- 31.Ribaut J. M., Betran J., Monneveux P., Setter T. 2009. Drought tolerance in maize. In Handbook of Maize: Its Biology (eds Bennetzen J. L., Hake S. C.), pp. 311–344 New York, NY: Springer 10.1007/978-0-387-79418-1_16 (doi:10.1007/978-0-387-79418-1_16) [DOI] [Google Scholar]
- 32.Lynch J. P., Brown K. M. 2001. Topsoil foraging–an architectural adaptation of plants to low phosphorus availability. Plant Soil 237, 225–237 10.1023/A:1013324727040 (doi:10.1023/A:1013324727040) [DOI] [Google Scholar]
- 33.Zhu J., Kaeppler S. M., Lynch J. P. 2005. Topsoil foraging and phosphorus acquisition efficiency in maize (Zea mays). Funct. Plant Biol. 32, 749–762 10.1071/FP05005 (doi:10.1071/FP05005) [DOI] [PubMed] [Google Scholar]
- 34.Malamy J. E. 2005. Intrinsic and environmental response pathways that regulate root system architecture. Plant Cell Environ. 28, 67–77 10.1111/j.1365-3040.2005.01306.x (doi:10.1111/j.1365-3040.2005.01306.x) [DOI] [PubMed] [Google Scholar]
- 35.Lopez-Bucio J., Cruz-Ramirez A., Herrera-Estrella L. 2003. The role of nutrient availability in regulating root architecture. Curr. Opin. Plant Biol. 6, 280–287 10.1016/S1369-5266(03)00035-9 (doi:10.1016/S1369-5266(03)00035-9) [DOI] [PubMed] [Google Scholar]
- 36.Bonser A. M., Lynch J., Snapp S. 1996. Effect of phosphorus deficiency on growth angle of basal roots in Phaseolus vulgaris. New Phytol. 132 281–288 10.1111/j.1469-8137.1996.tb01847.x (doi:10.1111/j.1469-8137.1996.tb01847.x) [DOI] [PubMed] [Google Scholar]
- 37.Zhu J., Lynch J. P. 2004. The contribution of lateral rooting to phosphorus acquisition efficiency in maize (Zea mays) seedlings. Funct. Plant Biol. 31, 949–958 10.1071/FP04046 (doi:10.1071/FP04046) [DOI] [PubMed] [Google Scholar]
- 38.Chun L., Mi G., Li J., Chen F., Zhang F. 2005. Genetic analysis of maize root characteristics in response to low nitrogen stress. Plant Soil 276, 369–382 10.1007/s11104-005-5876-2 (doi:10.1007/s11104-005-5876-2) [DOI] [Google Scholar]
- 39.de Dorlodot S., Forster B., Pagès L., Price A., Tuberosa R., Draye X. 2007. Root system architecture: opportunities and constraints for genetic improvement of crops. Trends Plant Sci. 12, 474–481 10.1016/j.tplants.2007.08.012 (doi:10.1016/j.tplants.2007.08.012) [DOI] [PubMed] [Google Scholar]
- 40.Herder G. D., Van Isterdael G., Beeckman T., De Smet I. 2010. The roots of a new green revolution. Trends Plant Sci. 15, 600–607 10.1016/j.tplants.2010.08.009 (doi:10.1016/j.tplants.2010.08.009) [DOI] [PubMed] [Google Scholar]
- 41.Zhu J., Ingram P. A., Benfey P. N., Elich T. 2011. From lab to field, new approaches to phenotyping root system architecture. Curr. Opin. Plant Biol. 14, 310–317 10.1016/j.pbi.2011.03.020 (doi:10.1016/j.pbi.2011.03.020) [DOI] [PubMed] [Google Scholar]
- 42.Gregory P. J., Bengough A. G., Grinev D., Schmidt S., Thomas W. T. B., Wojciechowski T., Young I. M. 2009. Root phenomics of crops: opportunities and challenges. Funct. Plant Biol. 36, 922–929 10.1071/FP09150 (doi:10.1071/FP09150) [DOI] [PubMed] [Google Scholar]
- 43.Iyer-Pascuzzi A. S., Symonova O., Mileyko Y., Hao Y., Belcher H., Harer J., Weitz J. S., Benfey P. N. 2010. Imaging and analysis platform for automatic phenotyping and trait ranking of plant root systems. Plant Physiol. 152, 1148–1157 10.1104/pp.109.150748 (doi:10.1104/pp.109.150748) [DOI] [PMC free article] [PubMed] [Google Scholar]
- 44.Collins N. C., Tardieu F., Tuberosa R. 2008. Quantitative trait loci and crop performance under abiotic stress: where do we stand? Plant Physiol. 147, 469–486 10.1104/pp.108.118117 (doi:10.1104/pp.108.118117) [DOI] [PMC free article] [PubMed] [Google Scholar]
- 45.Mitchell-Olds T., Schmitt J. 2006. Genetic mechanisms and evolutionary significance of natural variation in Arabidopsis. Nature 441, 947–952 10.1038/nature04878 (doi:10.1038/nature04878) [DOI] [PubMed] [Google Scholar]
- 46.Benfey P. N., Bennett M., Schiefelbein J. 2010. Getting to the root of plant biology: impact of the Arabidopsis genome sequence on root research. Plant J. 61, 992–1000 10.1111/j.1365-313X.2010.04129.x (doi:10.1111/j.1365-313X.2010.04129.x) [DOI] [PMC free article] [PubMed] [Google Scholar]
- 47.Hochholdinger F., Park W. J., Sauer M., Woll K. 2004. From weeds to crops: genetic analysis of root development in cereals. Trends Plant Sci. 9, 42–48 10.1016/j.tplants.2003.11.003 (doi:10.1016/j.tplants.2003.11.003) [DOI] [PubMed] [Google Scholar]
- 48.Osmont K. S., Sibout R., Hardtke C. S. 2007. Hidden branches: developments in root system architecture. Annu. Rev. Plant Biol. 58, 93–113 10.1146/annurev.arplant.58.032806.104006 (doi:10.1146/annurev.arplant.58.032806.104006) [DOI] [PubMed] [Google Scholar]
- 49.Bevan M. W., Garvin D. F., Vogel J. P. 2010. Brachypodium distachyon genomics for sustainable food and fuel production. Curr. Opin. Biotechnol. 21, 211–217 10.1016/j.copbio.2010.03.006 (doi:10.1016/j.copbio.2010.03.006) [DOI] [PubMed] [Google Scholar]
- 50.Brkljacic J., et al. 2011. Brachypodium as a model for the grasses: today and the future. Plant Physiol. 157, 3–13 10.1104/pp.111.179531 (doi:10.1104/pp.111.179531) [DOI] [PMC free article] [PubMed] [Google Scholar]
- 51.Draper J., Mur L. A. J., Jenkins G., Ghosh-Biswas G. C., Bablak P., Hasterok R., Routledge A. P. 2001. Brachypodium distachyon. A new model system for functional genomics in grasses. Plant Physiol. 127, 1539–1555 10.1104/pp.010196 (doi:10.1104/pp.010196) [DOI] [PMC free article] [PubMed] [Google Scholar]
- 52.Filiz E., Ozdemir B. S., Budak F. B., Vogel J. P., Tuna M., Budak H. 2009. Molecular, morphological, and cytological analysis of diverse Brachypodium distachyon inbred lines. Genome 52, 876–990 10.1139/G09-062 (doi:10.1139/G09-062) [DOI] [PubMed] [Google Scholar]
- 53.Watt M., Schneebeli K., Dong P., Wilson I. W. 2009. The shoot and root growth of Brachypodium and its potential as a model for wheat and other cereal crops. Funct. Plant Biol. 36, 960–969 10.1071/FP09214 (doi:10.1071/FP09214) [DOI] [PubMed] [Google Scholar]
- 54.Johnson C. M., Stout P. R., Broyer T. C., Carlton A. B. 1957. Comparative chlorine requirements of different plant species. Plant Soil 8, 337–353 10.1007/BF01666323 (doi:10.1007/BF01666323) [DOI] [Google Scholar]
- 55.Clark R. T., MacCurdy R. B., Jung J. K., Shaff J. E., McCouch S. R., Aneshansley D. J., Kochian L. V. 2011. Three-dimensional root phenotyping with a novel imaging and software platform. Plant Physiol. 156, 455–465 10.1104/pp.110.169102 (doi:10.1104/pp.110.169102) [DOI] [PMC free article] [PubMed] [Google Scholar]
- 56.Vogel J. P., Garvin D. F., Leong O. M., Hayden D. M. 2006. Agrobacterium-mediated transformation and inbred line development in the model grass Brachypodium distachyon. Plant Cell, Tissue Organ Culture 84, 100 179–100 191 10.1007/s11240-005-9023-9 (doi:10.1007/s11240-005-9023-9) [DOI] [Google Scholar]
- 57.Garvin D. F., et al. 2008. Development of genetic and genomic research resources for Brachypodium distachyon, a new model system for grass crop research. Crop Sci. 48, S69–S84 10.2135/cropsci2007.04.0208 (doi:10.2135/cropsci2007.04.0208) [DOI] [Google Scholar]
- 58.Scheiner S. M. 2001. MANOVA: multiple response variables and multispecies interactions. In Design and analysis of ecological experiments (eds Scheiner S., Gurevitch J.), pp. 99–115 New York, NY: Chapman and Hall [Google Scholar]
- 59.Schwartz C. J., Doyle M. R., Manzaneda A. J., Rey P. J., Mitchell-Olds T., Amasino R. M. 2010. Natural variation of flowering time and vernalization responsiveness in Brachypodium distachyon. BioEnergy Res. 3, 38–46 10.1007/s12155-009-9069-3 (doi:10.1007/s12155-009-9069-3) [DOI] [Google Scholar]
- 60.Luo N., Liu J., Yu X., Jiang Y. 2010. Natural variation of drought response in Brachypodium distachyon. Physiol. Plantarum 141, 19–29 10.1111/j.1399-3054.2010.01413.x (doi:10.1111/j.1399-3054.2010.01413.x) [DOI] [PubMed] [Google Scholar]
- 61.Hunt R., Lloyd P. S. 1987. Growth and partitioning. New Phytol. 106, 235–249 10.1111/j.1469-8137.1987.tb04692.x (doi:10.1111/j.1469-8137.1987.tb04692.x) [DOI] [Google Scholar]
- 62.Kachi N., Rorison I. 1989. Optimal partitioning between root and shoot in plants with contrasted growth rates in response to nitrogen availability and temperature. Funct. Ecol. 3, 549–558 10.2307/2389569 (doi:10.2307/2389569) [DOI] [Google Scholar]
- 63.Wang Y., Mi G., Chen F., Zhang J., Zhang F. 2004. Response of root morphology to nitrate supply and its contribution to nitrogen accumulation in maize. J. Plant Nutr. 27, 2189–2202 10.1081/PLN-200034683 (doi:10.1081/PLN-200034683) [DOI] [Google Scholar]
- 64.Liu J., Li J., Chen F., Zhang F., Ren T., Zhuang Z., Mi G. 2008. Mapping QTLs for root traits under different nitrate levels at the seedling stage in maize (Zea mays L.). Plant Soil 305, 253–265 10.1007/s11104-008-9562-z (doi:10.1007/s11104-008-9562-z) [DOI] [Google Scholar]
- 65.Chu W., Chang S. 1966. Surface activity of inorganic soil phosphorus. Soil Sci. 101, 459–464 10.1097/00010694-196606000-00007 (doi:10.1097/00010694-196606000-00007) [DOI] [Google Scholar]
- 66.Liao H., Rubio G., Yan X., Cao A., Brown K. M., Lynch J. P. 2001. Effect of phosphorus availability on basal root shallowness in common bean. Plant Soil 232, 69–79 10.1023/A:1010381919003 (doi:10.1023/A:1010381919003) [DOI] [PubMed] [Google Scholar]
- 67.Zhu J., Kaeppler S. M., Lynch J. P. 2005. Mapping of QTLs for lateral root branching and length in maize (Zea mays, L.) under differential phosphorus supply. Theoret. Appl. Genet. 111, 688–695 10.1007/s00122-005-2051-3 (doi:10.1007/s00122-005-2051-3) [DOI] [PubMed] [Google Scholar]
- 68.Huang G., Yi K. K., Wu Y. R., Zhu L., Mao C. Z., Wu P. 2004. QTLs for nitrate induced elongation and initiation of lateral roots in rice (Oryza sativa L.). Plant Soil 263, 229–237 10.1023/B:PLSO.0000047736.66712.c6 (doi:10.1023/B:PLSO.0000047736.66712.c6) [DOI] [Google Scholar]
- 69.An D., Su J., Liu Q., Zhu Y., Tong Y., Li J., Jing R., Li B., Li Z. 2006. Mapping QTLs for nitrogen uptake in relation to the early growth of wheat (Triticum aestivum L.). Plant Soil 284, 73–84 10.1007/s11104-006-0030-3 (doi:10.1007/s11104-006-0030-3) [DOI] [Google Scholar]
- 70.Zhu J., Mickelson S. M., Kaeppler S. M., Lynch J. P. 2006. Detection of quantitative trait loci for seminal root traits in maize (Zea mays L.) seedlings grown under differential phosphorus levels. Theoret. Appl. Genet. 113, 1–10 10.1007/s00122-006-0260-z (doi:10.1007/s00122-006-0260-z) [DOI] [PubMed] [Google Scholar]
- 71.Ingram P. A., Malamy J. E. 2010. Root system architecture. Adv. Bot. Res. 55, 75–117 10.1016/B978-0-12-380868-4.00002-8 (doi:10.1016/B978-0-12-380868-4.00002-8) [DOI] [Google Scholar]