

Abstract
Temporal summation of “second pain” (TSSP) or “windup” results from the summation of C-fiber-evoked responses of dorsal-horn neurons. This phenomenon is dependent on stimulus frequency (>0.33 Hz) and relevant to central sensitization and chronic pain. Our previous neuroimaging studies characterized brain regions associated with TSSP in normal control (NC) and fibromyalgia (FM) groups. During an fMRI scan, subjects received sensitivity adjusted repetitive heat pulses at 0.33 on the right foot. FM subjects required significantly lower stimulus intensities than NC to achieve similar TSSP and no significant group differences in the pain-related brain activity were detected. In our current study, we asked whether the effective connectivity among a set of TSSP-related brain regions identified in our previous work differs amongst FM and NC groups. Structural equation modeling was used to characterize the effective connectivity amongst a-priori selected brain areas, including the thalamus, S1, S2, posterior insula, and the anterior mid-cingulate cortex (aMCC) within the left and right hemispheres. This analysis confirmed our a-priori models of effective connectivity among these regions mainly confirmed those hypothesized, yet some unpredicted connections were additionally identified (thalamus to aMCC and aMCC to S1). While the models of effective connectivity were not identical in the FM and NC groups, they were very similar. Additionally, the TSSP related effective connectivity of right and left hemisphere regions was very similar. These results provide evidence for significant overlap of the fundamental brain mechanisms that process sensory and affective information related to TSSP in NC and FM groups.
Keywords: Temporal summation, Second pain, Windup, fMRI, effective connectivity, fibromyalgia
1.0 Introduction
Temporal summation of “second pain” (TSSP) and C-fiber-evoked responses in dorsal-horn neurons (‘windup’) are dependent on stimulus frequency (i.e., ≥ 0.33Hz) and relevant to central sensitization and chronic pain [31,48]. Our previous functional magnetic resonance imaging (fMRI) studies characterized brain regions associated with TSSP in normal control (NC) volunteers and patients with fibromyalgia (FM) [43,44]. In those studies, participants experienced repetitive heat pulses to the right foot at 0.33Hz during fMRI scanning. For each subject, the stimuli were tailored to produce comparable, yet robust, TSSP-ratings of moderate pain across subjects. Interestingly, The results showed that when TSSP was equivalent across subjects, no significant group differences in the pain-related activity was found; thus, allowing us to pool the data for further analyses [43]. The subsequent analyses identified several brain regions with TSSP related activation including: bilateral thalamus, medial thalamus, S1, bilateral S2, mid- and posterior insula, rostral and mid-anterior cingulate cortex [see 43 for details]. Together, our previous results suggest that the brain mechanisms associated with TSSP are predictable from knowledge about spinal cord mechanisms of windup and involve brain regions associated with various information processes (e.g., sensory, cognitive, and affective) known to influence the subjective pain experience [40,43,44].
In terms of functional connectivity, the patterns of neural activity associated with TSSP seem to suggest the involvement of similar mechanisms in NC and FM groups. However, because FM has also been associated with alterations in pain processes [17,26,35,44,45,47,49], a critical question raised by these studies is whether TSSP-related brain regions are effectively connected in a similar manner across NC and FM populations. To address this question, we used structural equation modeling (SEM) to examine the effective connectivity among a set of TSSP-related brain regions in the aforementioned NC and FM groups (see Figure 1). The first model we tested was based on neuroanatomy, brain imaging, neurological findings, and neurophysiological research [29,30,35], and is consistent with our previous effective connectivity research, based on visceral pain in patients with irritable bowel syndrome (IBS) [6]. When necessary, additional parameters were freed to establish a well fitting, yet parsimonious, model that met the goodness-of-fit criteria. Because hemispheric specificity of pain related processes are not well delineated, all models were initially estimated with left hemisphere (LH) data, contralateral to the stimulation site, and then with right hemisphere (RH) data.
Figure 1.
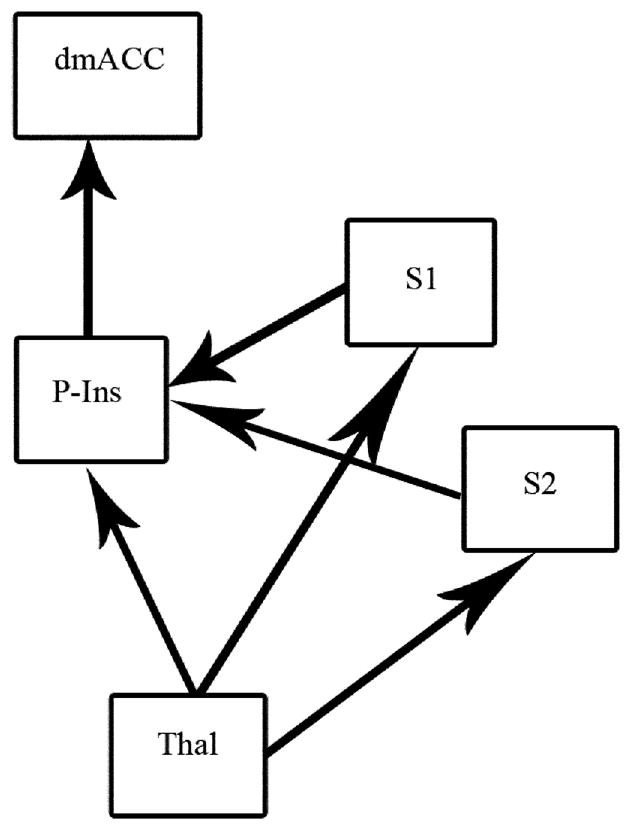
Effective connectivity model of TSSP-related brain regions. The hypothetical model was based on neuroanatomy, brain imaging, neurological findings, and neurophysiological research.
This study extends our previous work that identified a network of brain regions involved in the sensory, cognitive, and affective dimensions of TSSP that are functionally connected [43,44]. Our analytical approach was designed to address several interrelated questions about TSSP and windup. Do the brain mechanisms associated with TSSP differentially involve one or multiple dimensions of pain (e.g., sensory, cognitive, affective)? Are the models of effective connectivity associated with TSSP similar in chronic pain and healthy control populations? Finally, based on a common set of brain regions, to what extent do the models of effective connectivity in the right and left hemispheres correspond? For the clarity and model interpretability, our analyses were restricted to a network of five brain regions involved in early processing of the cognitive, affective and sensory dimensions of TSSP-related pain [14,26,29]. Given the immense interconnectedness of the brain, the inclusion of additional regions would require a substantial increase in power and the schematic of the final model may not be interpretable. See network models in Methods for additional details.
2.0 Materials and methods
The work presented here extends that of a previously published study. That study was designed to compare brain responses associated with TSSP in healthy, 11 normal control (NC) participants and 13 patients with fibromyalgia (FM). Using volume-of-interest analysis, the results of that study revealed that when stimulus strength was adjusted to induce equivalent levels of TSSP, no differences in activation of pain-related brain regions was identified between the NC and FM groups [see 43 for more details]. Briefly repeated here is the information related to subjects, experimental design, and procedures necessary to give the reader sufficient background to evaluate the analysis in the present report. The University of Florida Institutional Review Board approved the procedures and protocols for this study and informed consent was obtained from each subject.
2.1 Model of sensory-cognitive-affective network
The hypothesized model of effective connectivity shown in Figure 1 was based upon a previous one that was derived from neuroanatomical, neurophysiological, and psychological research [29,30]. The aforementioned model was designed to provide a general description of the pathways by which pain-related information is processed. In the present study it was used to represent a model of effective connectivity among brain regions involved in TSSP.
2.2 TSSP fMRI Scanning Design
During a scanning session, subjects were comfortably placed on the scanning table in the head first, supine position with their knees supported by a wedge cushion. Their head positions were then fixed with foam pillows to minimize image artifacts associated with (excessive) head motion. Subjects wore both earplugs and earphones for noise protection; the latter also facilitated communication with the subjects. During the functional scans, subjects experienced thermal stimuli presented in two- or six-pulse trains at 0.33 Hz and two- or six-pulse trains at 0.17 Hz. At the end of each stimulus train scanning was continued for 30 sec to capture delayed pain-related brain activity (i.e., after-sensation associated with chronic pain) and allow the hemodynamic response to return to baseline levels [see 44 for details]. After each run, the subjects were immediately asked to report the number rating of the last stimulus. Before and after each run the subjects also rated clinical pain and anxiety using the NPS. As shown below, in the results section, TSSP was significantly associated with the 0.33 Hz eight-pulse trains. Consequently, these data were used to develop our models of effective connectivity.
2.3 Image Acquisition
The MRI data were acquired on a research-dedicated head scanner (Siemens Allegra, 3.0 T) using a standard head RF coil. Prior to functional scanning, high-resolution 3D anatomical images were acquired using a T1-weighted MP-RAGE protocol (128 1.3-mm axial slices; TR = 2000 ms, TE = 4.13 ms, FA = 8°, matrix = 256*256 mm, FOV = 24 cm). Functional images were acquired in 32 axial slices oriented parallel to the anterior commissure–posterior commissure (AC–PC) line using a T2*-weighted gradient echo planar imaging (EPI) sequence [Repetition time/echo time (TR/TE = 2000 ms/30 ms), flip angle (FA) = 90°, field of view (FOV) = 24 cm, matrix = 64×64; voxel size = 3.75 mm × 3.75 mm × 3.8 mm; slice gap 0.4 mm].
2.4 Functional MRI Data Reduction and Analyses
The fMRI data were processed using BrainVoyager (BVQX 1.6 - Brain Innovation, Maastricht, the Netherlands; http://www.brainvoyager.com). To reduce T1-saturation effects the first two volumes of each run were discarded at the scanner and two additional volumes were discarded during preprocessing, resulting in 320 volumes per condition. Image pre-processing consisted of re-sampling the functional data to 3mm3, rigid-body 3D motion correction using trilinear interpolation, slice-scan time correction with sinc interpolation, spatial smoothing with a 4-mm full-width at half maximum (FWHM) Gaussian kernel, voxel-wise linear detrending, and high-pass temporal filtering to remove nonlinear drifts below 3 Hz. Functional images were co-registered to a high resolution 3D anatomic volume and transformed into standard Talairach space [51].
In our previous work on neuroimaging of TSSP [43,44] a Random Effects General Linear Model (RFX-GLM) of the whole-brain was used as a first step to identify areas of the brain where the pain-stimulus onset of four TSSP paradigms was significantly convolved with the hemodynamic response function (HRF) [41]. As a precaution against Type I error, resultant statistical parameter maps (SPMs) were thresholded at p <.05, and all clusters had a spatial-extent of 50 contiguous voxels; the combination of which established an image-wise p-value of .00002 and an effective pixel-wise alpha of p < .0002 [15]. After setting the statistical threshold, a hypothesis driven approach was used to identify relevant clusters of voxels within each brain region believed to be critical for the cognitive - affective processing of nociceptive input. Taking a conservative approach, we used a linear contrast in which, the HRF for the 6-pulse .33Hz train was significantly greater that the other three conditions combined [see 43 for details], to identify clusters of voxels in brain regions significantly associated with TSSP in the NC and FM groups. Thus, chosen clusters i) were thresholded at p <.05, ii) maintained a spatial-extent of at least 50-contiguous voxels, and iii) the Talairach coordinates for cluster’s center-of-gravity (mass) were in a conceptually relevant brain region.
To develop a more robust understanding of the similarities and differences of TSSP in the NC and FM groups, for the current analyses, we modeled the effective connectivity among the five primary brain regions thought to be critically involved in the early stages multiple pain related processes. Specifically, we used the time-course data from the functional scans of the 6-pulse (.33Hz) trains, to model the effective connectivity among the thalamus (Thal), primary and secondary somatosensory cortices (S1 and S2 respectively), posterior insula (P-Ins), and the anterior mid-cingulate cortex (aMCC). These five areas are the most commonly activated areas in brain imaging studies of pain [4] For each of the five ROIs, the data from all the voxels comprising the ROIs was aggregated and extracted, resulting in a single data point for each volume of functional data. Per subject, this process was repeated in both hemispheres. Mirror coordinates were used establish the geographical extents of an ROI in the contralateral hemisphere. Once established, data from the right hemisphere ROIs were extracted in the same manner described above. Focusing on a small set of brain regions involved in the early stages of pain allowed us to examine the degree to which a single or multiple processes were primarily involved with TSSP and whether these processes worked similarly in both hemispheres and between FM and NC groups. See Table 1 for center-of-gravity coordinates.
Table 1.
Regions of Interest (ROI) Center-of-Gravity coordinates
| Regions | Coordinates* | μL | ||
|---|---|---|---|---|
| X (±)† | Y | Z | ||
| Thalamus | 15 | −21 | 13 | 2325 |
| Mid-dorsal S1 | 4 | −33 | 70 | 171 |
| Anterior Mid-Cingulate Cortex | 3 | −12 | 42 | 1589 |
| Medial Post Insula | 33 | −18 | 8 | 770 |
| S2 | 51 | −29 | 24 | 846 |
Coordinates are in the standard Talairach space
Left (−) and Right (+) hemisphere ROIs are mirror images.
2.5 SEM Analysis of fMRI Data
Path analysis is often used to test the plausibility of hypothetical relationships between/among variables (e.g., brain regions). Statistically, the procedure estimates the coefficients corresponding to the structural equations that reflect the relationships being studied. An advantage of this technique to study neural networks is the ability to describe the relationships among brain regions in terms of i) direct, ii) indirect, and iii) the total effects a brain region exerts on others in the network. A direct effect is the unmediated influence of one region on another. An indirect effect is the influence of a brain region on another that is mediated by at least one intervening region. The consideration of the indirect effect leads to a more robust understanding of the relationship between variables. For example, the typical regression analysis provides an estimate of the direct effect of a variable. To ignore the indirect effects may obscure the true nature of the relationship between variables [1]. The sum of the direct and indirect effects yields the total effect of one region on another within the estimated network. Importantly, the decomposition of model effects (i.e., path loadings) is always done with respect to a specific model. If the system of equations is altered by including or excluding variables and/or changing path specifications, the estimates of total, direct, and indirect effects may change [1].
3.0 Results
3.1 Pain rating results (summarized from Staud et al., 2008)
A standardized numerical rating scale (NRS) was used for rating the magnitude of painful sensations produced by heat pulse stimulation as previously described [46,53]. The scale ranged from 0–100 with verbal descriptors at the following intervals: 10 = warm (no pain); 20 = threshold pain; 30 = very weak pain; 40 = weak pain; 50 = neither strong nor weak pain; 60 = slightly strong pain; 70 = strong pain; 80 = very strong pain; 90 = nearly intolerable pain; 100 = intolerable pain. The scale includes both non-painful (< 20) and painful ranges (20–100) and subjects were allowed to rate in increments of 5 (e.g. 65). This NRS has been particularly advantageous for distinguishing non-painful from painful sensations and estimating pain intensity during series of repetitive stimulation [50,53].
The heat pulse intensity for sensitivity adjusted TSSP was a priori selected for each individual subject to achieve maximal TSSP ratings of 45 ± 10 NPS units at 0.33 Hz. This design took into account the observed increase of peripheral/central sensitivity of study subjects due to multiple repetitions of stimulus trains required for fMRI analysis.
No significant group differences were found for pain ratings in response to the 6-pulse heat trains at 0.33 Hz (p > 0.05). The FM subjects showed a tendency for greater TSSP in the 0.33 Hz condition compared to NC (F(1, 21) = 6.5, p = .04). However, this finding was not unexpected, and the difference in pain ratings was relatively small (6 NPS units) and well below that previously demonstrated to be sufficient to show brain activation differences [43,44]. Moreover, the small differences in TSSP ratings between NC and FM subjects, however, did not result in any group differences of TSSP-related brain activity.
3.2 Analysis of Network Models
The fMRI data from fibromyalgia and healthy control subjects was used in to estimate the models of effective connectivity among five brain regions of interest (ROI) involved in processing early stages of the sensory-cognitive-affective components of pain (Figure 1). This core network included the following brain regions: thalamus (Thal), primary and secondary somatosensory cortices (S1 and S2 respectively), posterior insula (P-Ins), and the anterior cingulate cortex (aMCC). The entire time-series of BOLD measurements, for each ROI (including periods of rest and stimulation) was used to estimate the models. In all the models estimated, the thalamus was classified as an exogenous variable, and all the other brain regions were classified as endogenous variables.
3.2.1 Model interpretation/Goodness of Fit
Network model parameters were estimated using the Maximum Likelihood estimator in LISREL 8.7 [18]. Any subsequent change to the model initially hypothesized was done to identify an acceptable alternative model. Each alternative model was evaluated in terms of conceptual integrity, parsimony, and the Goodness-of-Fit indices described below [2]. Overall, the Goodness of Fit describes how well an estimated model reproduced the actual data. The Goodness of Fit indices used in the present study include the Non-Normed Fit Index (NNFI), the Root Mean Square Error of Approximation (RMSEA), and the Standardized Root Mean Square Residual (SRMR).
Traditionally, the Normed Fit Index (NFI) is used to describe a null model (i.e., one in which the variable covariances are equal to zero). Values of .90 – .95 are considered acceptable, and good fitting models are those with index values of .95 and above. A limitation of the NFI is that there is no penalty assessed for adding parameters to an established model. The Non-Normed Fit Index (NNFI) was developed to specifically address this issue. The NNFI adjusts the NFI index by correcting for the χ2/df ratio in the model. Any results that return a value greater than one is set to one, and the results are interpreted as with the NFI mentioned above.
The fit index, RMSEA, is based on the not centrality parameter. Good fitting models have an RMSEA values of ≤ .05, and poor fitting models are those with an RMSEA index of .10 or greater. For each model, a RMSEA confidence interval (CI) is also computed. Ideally the range for the 90% CI is 0 – 0.1 or less. Finally, the SRMR index represents the standardized difference between the observed covariance and covariance being predicted. Models with a perfect fit have a value of zero and well fitting models have values ≤.08.
3.2.2 Multi-Sample Analyses
Multi-sample (normal control and fibromyalgia groups) model parameters were estimated for both hemispheres with group (NC and FM) specific data. The multi-sample model fitting process in the present study consisted of six steps for testing the hypothetical model in each of the hemispheres. First, the proposed model was estimated in the NC group. Second, an alternative model was identified through an iterative process, allowing parameters to be fixed or unconstrained, until a significantly better fitting model for the NC data was found. Steps 3 and 4 used FM data to replicate the first two steps. In the fifth step, the same model was tested in both groups simultaneously, with the FM model constrained to be invariant from the NC-alternative model. In the sixth and final step, the alternative models of each group were simultaneously estimated, to determine whether the NC and FM alternative models were significantly different. After steps 2, 4, and 6, a chi-square difference test was to determine whether each subsequent model yielded a statistically significant improvement in model fit, based upon whether the change in DF resulted in a significant decrease in the χ2 value from the proposed model. The results for each step are found in Table 2 along with the Goodness-of-Fit indices and χ2 difference tests. The estimated direct, indirect, and total effects for each hemisphere of the normal control and fibromyalgia groups are found in Table 3 and Table 4 respectively.
Table 2.
Steps of mode estimation and associated goodness-of-tit Indices
| Hemisphere | Step | Model (Group) | Model Fit | |||||||||
|---|---|---|---|---|---|---|---|---|---|---|---|---|
| χ2 | df | Δ χ2 | Δ df | p+ | εa | εaCI* | p★ | SRMR | NNFI | |||
| Right | 1 | Proposed (NC) | 1658.91 | 5 | 0.307 | 0.29–0.31 | 0.00 | 0.14 | 0.61 | |||
| 2 | Alternative (NC) | 6.48 | 2 | 1652.43 | 3 | < 0.001 | 0.025 | 0.00–0.05 | 0.96 | 0.01 | 1.00 | |
| 3 | Proposed (FM) | 793.11 | 5 | 0.222 | 0.21–0.24 | 0.00 | 0.10 | 0.79 | ||||
| 4 | Alternative (FM) | 4.31 | 1 | 788.80 | 4 | < 0.001 | 0.032 | 0.01–0.07 | 0.77 | 0.01 | 1.00 | |
| 5 | FM invariant to NC alternative | 225.74 | 17 | 0.060 | 0.05–0.07 | 0.01 | 0.99 | |||||
| 6 | NC alternative and FM alternative | 10.79 | 3 | 214.95 | 14 | < 0.001 | 0.028 | 0.01–0.05 | 0.98 | 1.00 | ||
|
|
||||||||||||
| Left | 1 | Proposed (NC) | 1016.63 | 5 | 0.24 | 0.23–0.25 | 0.00 | 0.11 | 0.78 | |||
| 2 | Alternative (NC) | 4.62 | 1 | 1012.01 | 4 | < 0.001 | 0.03 | 0.01–0.06 | 0.79 | 0.01 | 1.00 | |
| 3 | Proposed (FM) | 955.42 | 5 | 0.24 | 0.23–0.26 | 0.00 | 0.11 | 0.73 | ||||
| 4 | Alternative (FM) | 5.12 | 4 | 950.30 | 1 | < 0.001 | 0.01 | 0.00–0.03 | 1.00 | 0.01 | 1.00 | |
| 5 | FM invariant to NC alternative | 166.61 | 16 | 0.05 | 0.05–0.06 | 0.24 | 0.99 | |||||
| 6 | NC alternative and FM alternative | 9.74 | 5 | 156.87 | 11 | < 0.001 | 0.02 | 0.00–0.03 | 1.00 | 1.00 | ||
χ2 = Chi-square, Δ χ2 = change in Chi-square value, p+ = p-value of Chi-square difference test
εa = Root Mean Square Error of Approximation (RMSEA, good models ≤ .05), εaCI = 90% confidence interval of the RMSEA (good models range from 0.0 to ≤ 0.1), p* = p-value of Close Fit for the alternative hypothesis (that RMSEA is greater than 0.05).
SRMR = Standardized Root Mean Square Residual ([S-RMSR], the standardized difference between the observed covariance and covariance being predicted; good models ≤ .08)
NNFI = Non-normed Fit Index (good models have values ≈ 1)
Table 3.
Regression Matrix of Estimated Effects for the Normal Control Alternative Models
| Normal Control – ROI Relationships
| |||||||||||
|---|---|---|---|---|---|---|---|---|---|---|---|
| Left hemisphere | Right hemisphere | ||||||||||
| Direct Effects
| |||||||||||
| Thal | S1 | P-Ins | S2 | aMCC | Thal | S1 | P-Ins | S2 | aMCC | ||
| Thal★ | Thal★ | ||||||||||
S1

|
0.13 | 0.38 |
S1
|
0.36 | |||||||
| P-Ins | 0.41 | 0.17 | 0.37 | P-Ins | 0.36 | 0.03 | 0.47 | ||||
| S2 | 0.43 | S2 | 0.47 | 0.12 | |||||||
| aMCC | 0.28 | 0.32 | 0.27 | aMCC | 0.30 | 0.17 | 0.42 | ||||
| Indirect Effects
| |||||||||||
| Thal | S1 | P-Ins | S2 | aMCC | Thal | S1 | P-Ins | S2 | aMCC | ||
| Thal★ | Thal★ | ||||||||||
|
S1
|
0.28 | 0.02 | 0.12 | 0.15 | 0.01 |
S1
|
0.22 | 0.02 | 0.06 | 0.18 | 0.01 |
| P-Ins | 0.21 | 0.02 | 0.05 | 0.07 | P-Ins | 0.24 | 0.06 | 0.01 | 0.02 | 0.03 | |
| S2 | S2 | 0.03 | 0.01 | 0.02 | 0.04 | ||||||
| aMCC | 0.31 | 0.06 | 0.01 | 0.14 | 0.02 | aMCC | 0.31 | 0.07 | 0.09 | 0.02 | |
| Total Effects
| |||||||||||
| Thal | S1 | P-Ins | S2 | aMCC | Thal | S1 | P-Ins | S2 | aMCC | ||
| Thal★ | Thal★ | ||||||||||
|
S1
|
0.28 | 0.02 | 0.12 | 0.28 | 0.38 |
S1
|
0.22 | 0.02 | 0.06 | 0.18 | 0.37 |
| P-Ins | 0.61 | 0.18 | 0.02 | 0.42 | 0.07 | P-Ins | 0.60 | 0.09 | 0.01 | 0.49 | 0.03 |
| S2 | 0.43 | S2 | 0.50 | 0.12 | 0.01 | 0.02 | 0.04 | ||||
| aMCC | 0.59 | 0.06 | 0.33 | 0.40 | 0.02 | aMCC | 0.61 | 0.07 | 0.17 | 0.51 | 0.02 |
Note: For Tables 3–4:
= Thalamus,
md=mid-dorsal, and the numbers are standardized unidirectional loadings. Direction of influence is column → row. Figures 2 – 5 show the inter-regional direct effects. The mediated influence of one structure on another is an indirect effect (e.g., in the RH, there is a relationship between the md-S1→-aMCC, mediated by P-Ins, and is: .05*.25 = .01). Total effects are the sum of direct and indirect effects, which may include reciprocal paths.
Table 4.
Regression Matrix of Estimated Effects for the Fibromyalgia Alternative Models
| Fibromyalgia – ROI Relationships
| |||||||||||
|---|---|---|---|---|---|---|---|---|---|---|---|
| Left hemisphere | Right hemisphere | ||||||||||
| Direct Effects
| |||||||||||
| Thal | S1 | P-Ins | S2 | aMCC | Thal | S1 | P-Ins | S2 | aMCC | ||
| Thal★ | Thal★ | ||||||||||
|
S1
|
0.41 |
S1
|
0.19 | 0.21 | |||||||
| P-Ins | 0.42 | 0.38 | P-Ins | 0.42 | 0.06 | 0.35 | |||||
| S2 | 0.52 | S2 | 0.55 | ||||||||
| aMCC | 0.30 | 0.29 | 0.27 | aMCC | 0.25 | 0.32 | 0.27 | ||||
| Indirect Effects
| |||||||||||
| Thal | S1 | P-Ins | S2 | aMCC | Thal | S1 | P-Ins | S2 | aMCC | ||
| Thal★ | Thal★ | ||||||||||
|
S1
|
0.25 |
S1
|
0.23 | 0.07 | 0.08 | ||||||
| P-Ins | 0.20 | P-Ins | 0.21 | 0.02 | 0.01 | ||||||
| S2 | S2 | ||||||||||
| aMCC | 0.31 | aMCC | 0.35 | 0.02 | 0.12 | ||||||
| Total Effects
| |||||||||||
| Thal | S1 | P-Ins | S2 | aMCC | Thal | S1 | P-Ins | S2 | aMCC | ||
| Thal★ | Thal★ | ||||||||||
|
S1
|
0.25 | 0.12 | 0.16 | 0.41 |
S1
|
0.23 | 0.07 | 0.27 | 0.21 | ||
| P-Ins | 0.61 | 0.38 | P-Ins | 0.62 | 0.07 | 0.36 | 0.01 | ||||
| S2 | 0.52 | S2 | 0.55 | ||||||||
| aMCC | 0.61 | 0.29 | 0.38 | aMCC | 0.60 | 0.02 | 0.33 | 0.38 | |||
3.2.3 Left Hemisphere
The present modeling approach supported the identification of alternative left hemisphere model for the NC group. In the NC-alternative model the direct effects (i.e., amount of influence from one region to another) varied from fairly modest (e.g., 0.13) to relatively strong (e.g., 0.43). See Figure 2 (bottom). In addition to fitting the data better a Chi-square difference test between the proposed and alternative models revealed that the alternative model resulted in a significant Chi-square change (Δχ42 = 1012.01; p < 0.001). Similarly, the proposed model poorly fit the left hemisphere data of the FM group, and the alternative model provided a better fit to the data. Compared to all other models, the direct effects of the FM-alternative model were all relatively strong or better, ranging from β = 0.27 to β = 0.52 (see Figure 2 - top). Moreover, compared to the proposed model, the FM-alternative resulted in a significant Chi-square change (Δ χ12 = 950.30; p < 0.001). Unlike the findings of the right hemisphere, in Step-5, the estimate of measurement invariance across the two groups could be obtained. Forcing the NC-alternative model onto the FM group yielded a model the fit the data reasonably well (See Table 2). However, because Step-4 produced a well fitting, alternative, model in the FM group, and was more parsimonious than the NC-alternative model, we proceeded with Step-6. As before, Step-6, which modeled both alternative models simultaneously, yielded a well fitting model overall, that significantly explained both the within and between group variance. Moreover, Step-6 yielded a dramatic drop in the Chi-square value, resulting in a highly significant Chi-square difference test between Step-5 and Step-6 (Δ χ112 = 156.87; p < 0.001). As before, these results indicate that the alternative models of the left hemisphere for the NC and FM groups explained the inter-regional interactions within each group and accounted for the differences between groups.
Figure 2.

Fibromyalgia (top) and Normal Control (bottom) left hemisphere models a TSSP-related network. Arrows and text indicate the estimated direction and magnitude of influence respectively. Note: aMCC = Anterior Mid-Cingulate, P-Ins = Posterior Insula, and Thal = Thalamus
While the overall structure of the alternative models for the left hemisphere of the NC and FM groups are similar there are some notable differences. Most notably are the undefined relationships of S1
 S2, and S1
P-Ins in the FM group. Unlike the right hemisphere models, where the reversal of a single path in the FM group resulted in changes throughout the network; within the left hemisphere, the absence of two paths in the FM-alternative model, apparently had little effect on the rest of the network as evidenced by the high degree of correspondence of path coefficients in the NC and FM alternative models. The largest difference between the alternative models was a 20% increase in the influence of the thalamus → S2 relationship (NC β = 0.43, FM β = 0.52, Δβ = 0.09).
S2, and S1
P-Ins in the FM group. Unlike the right hemisphere models, where the reversal of a single path in the FM group resulted in changes throughout the network; within the left hemisphere, the absence of two paths in the FM-alternative model, apparently had little effect on the rest of the network as evidenced by the high degree of correspondence of path coefficients in the NC and FM alternative models. The largest difference between the alternative models was a 20% increase in the influence of the thalamus → S2 relationship (NC β = 0.43, FM β = 0.52, Δβ = 0.09).
3.2.4 Right Hemisphere
The present modeling approach supported the identification of alternative right hemisphere model for the NC group. The proposed model yielded a poor fit to the data and a Chi-square difference test revealed that the alternative model resulted in a significant Chi-square change (Δ χ32 = 1652.43; p < 0.001; see Figure 3). Similarly, the proposed model yielded a poor fit to the right hemisphere data of the FM group, and an alternative model provided a significant improvement (Δ χ42 = 788.8; p < 0.001; see Figure 4). Measurement invariance across the two groups was not obtained. Forcing the NC-alternative model onto the FM group did not yield a well fitting model overall. Step-6, which modeled both alternative models simultaneously, yielded a well fitting model that significantly explained the within and between group variance. The Chi-square difference test of Step-5 and Step-6 was significant (Δ χ142 = 214.95; p < 0.001) indicating that the NC and FM alternative models, of the right hemisphere, explained the inter-regional interactions within each group and accounted for the differences between groups.
Figure 3.
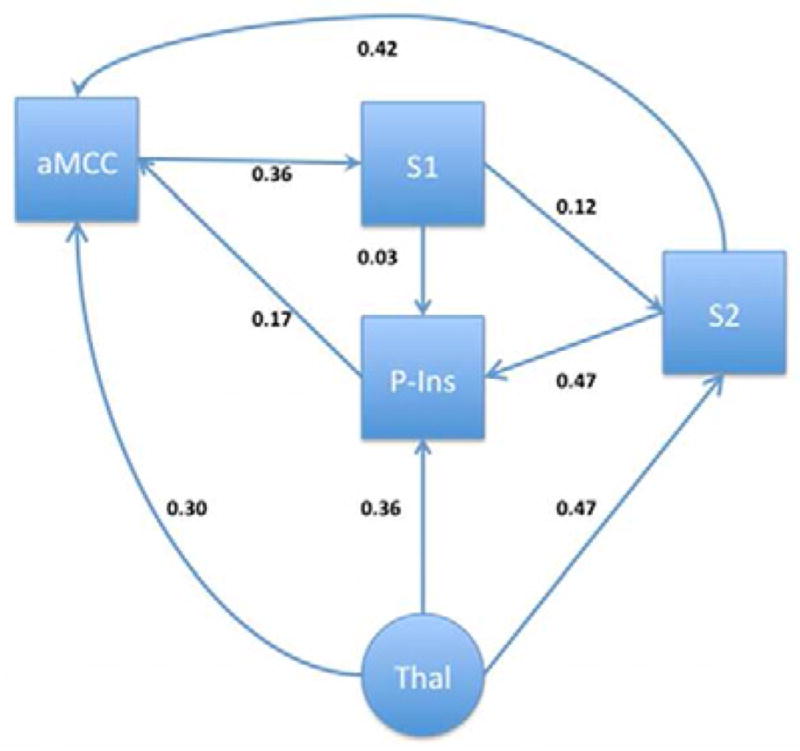
Normal Control model of a TSSP-related network in the right hemisphere. Arrows and text indicate the estimated direction and magnitude of influence respectively.
Figure 4.
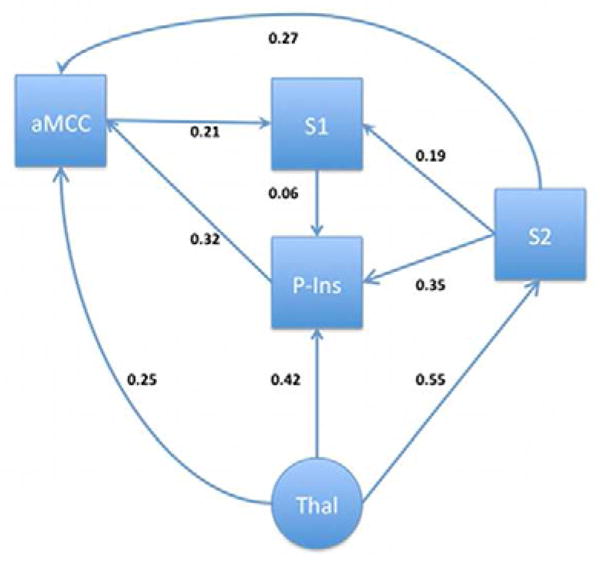
Fibromyalgia model of a TSSP-related network in the right hemisphere. Arrows and text indicate the estimated direction and magnitude of influence respectively.
While the alternative models for the right hemisphere of the NC and FM groups are similar there are some notable differences. Most notably is the reversal and increased influence of the path between S1 and S2. In the NC group, S1 influences S2 (S1→S2, β = 0.12), while in the FM group, S2 influences S1 (S1←S2, β = 0.19, Δβ = 58% increase). Additionally, there is a 100% increase of influence of S1 to the posterior insula in the FM group (from β = 0.03 to 0.06). The combination of these changes are likely responsible for the 88% increase in influence of the posterior insula to the anterior cingulate ROI in the FM group (NC β = 0.17, FM β = 0.32, Δβ = 0.15). The change in the S1–S2 relationship may also explain the 36% decrease in the S2→aMCC relationship (NC β = 0.42, FM β = 0.27, Δ β = 0.15) and the 42% decrease in the aMCC→S1 relationship (NC β = 0.36, FM β = 0.21, Δ β = 0.15) in the FM group.
4.0 Discussion
Our previous work demonstrated a network of brain areas that showed progressively increased activation during a series of heat pulses that evoked temporal summation of second pain (TSSP) [43,44]. Both temporal summation of brain activity and TSSP show strong similarities to windup in the spinal cord dorsal horn [21,31–33]. The results of the present study extend our previous network analyses on the core brain regions involved in the sensory, cognitive, and affective dimensions of acute and chronic pain [31,48] [31,48]. For the most part, our models correspond to those proposed for pain in general [29 and compare Figures 1–3] and are consistent with the models related to visceral pain in IBS patients [6]. Moreover, there was a high degree of consistency among models between the NC and FM groups, with only minor differences noted. Finally, there was also a high degree of correspondence in the left and right hemisphere models of effective connectivity.
4.1 Similarities and differences between proposed and final models
We have modeled the inter-regional effective connectivity among five brain regions involved in fundamental aspects of sensory, cognitive, and affective dimensions of pain. The proposed model of effective connectivity was based on a synthesis of neuroanatomical, neurological, and neurophysiological evidence [29,30]. Accordingly, the thalamic region in our proposed model has both a direct functional influence on the posterior insula and exerts an indirect influence on the latter via the somatosensory cortices S1 and S2. The predicted functional connection from the posterior/mid-insula to anterior mid-cingulate cortex (aMCC area 24b) is also supported in all of our estimated models. The interactions of these three brain regions (thalamic, P-Ins, and aMCC) have been proposed to form a core triad, fundamental for the integration of sensory and the rudimentary affective (immediate unpleasantness) dimensions of pain [29,38]. More recent work supports the dynamic relationship among these regions, during the integration of attention, negative contextual information, and the sensory features of pain [6,28]. For example, the amount of influence the anterior insula exerts on the aMCC has been shown to be a function of perception of both overall threat within a given context and nociceptive stimulation [28].
The alternative models identified additional paths of effective connectivity found from the posterior thalamus to aMCC and from the latter to S1. These connections were identified in both NC and FM groups and for both cerebral hemispheres. Within each hemisphere, these connections may reflect an attention-modulation function that could be facilitated by the Thal → aMCC → S1 informational processes. Alternatively, the pathway from aMCC to S1 may reflect one component of a mechanism that integrates pain unpleasantness, via recursive or feedback processes (e.g., S1→ Insula → aMCC), with the sensory features of pain, which is consistent with recent thoughts about the relationship between these two dimensions of pain [23,24,37,40]. Overall, we interpret the alternative models as being significantly involved in the integration of multiple processes, serial and parallel, that support causal effects and integration of the sensory dimensions of pain on early stages of pain-related affect. To our knowledge, this study is the first to provide evidence that such inter-regional involvement applies to TSSP. Moreover, these results suggest that the cortical processing of TSSP operates similarly in chronic and non-pain groups by principles applicable to pain processing in general.
4.2 TSSP processing in the left hemisphere
Examination of the final alternative- models for the left (contralateral) hemisphere of the NC and FM groups revealed a high degree of similarity (e.g., many of the same paths among the network nodes existed in both groups). Despite this correspondence, some subtle and obvious differences emerged. While many of the same paths were present in the FM model, subtle increases in the magnitude of influence were evident among many of the paths, ranging from 3–8%. Compared to the NC group, there was a large increase in the Thal→S2 path (21%) in the FM group. The most striking difference between NC and FM group models was the lack of significant paths of influence from S1 to S2 and from S1 to PIns within the left hemisphere of the FM group.
Given that within the dominant hemisphere (typically left) BA 40 is functionally involved with language and communication related processes, the lack of a significant path from S2 to the region S1, and from S1 to the posterior insula among FM patients may be related to an ongoing internal dialogue associated with their experience of chronic pain. Research has indicated that brain region S2 can be subdivided into two distinct areas (anterior and posterior) [3,5,10–13,52]. Neuroimaging research has shown that, of the two, the posterior area is responsive to pain, and within the contralateral hemisphere, those responses manifest as atypical patterns of activity in clinical populations [11–13]. Hence, overall, the group differences we identified in the left hemisphere models appear to support the atypical findings regarding pain and the activation patterns of contralateral S2 observed previously [3,10–13].
4.3 TSSP processing in the right hemisphere
Inspection of the final alternative-models of the right hemisphere, ipsalateral to the site of stimulation, also revealed a high degree of similarity, although, again, some differences were evident. For example, the two paths absent in the FM model of the left hemisphere were present in the right hemisphere model. Additionally, compared to the NC model, the magnitude of influence among several was substantially increased in the FM model. For example, there was a 58% increase in the S1↔S2 relationship (although in opposite directions). Moreover, there was an 88% increase in the PIns→aMCC path (NC β = 0.17 and FM β = 0.32), and a 100% increase in the S1 →P-Ins path. Quite possibly, the increased magnitude of influence among these paths is the manifestation of central sensitization in processing pain related information in a chronic pain population
The return of the missing S2→S1 and S1 →P-Ins paths in the FM model was not entirely surprising given the role of S2 in the non-dominant hemisphere. Within the right, typically non-dominant, hemisphere, S2 (i.e., BA40) has been associated with various perceptual processes (visual, spatial, and temporal), the integration of these processes would allow us to contextualize multiple sources of information and integrate ourselves with the environment.
Overall, BA40 is involved with incorporation of bilateral temporal and sensory information processes that contribute to self-awareness in space and time. As such, the models identified in this study suggest that S2 may play a pivotal role in the establishment of central sensitization. Moreover, alterations in the functional capacity of S2 could be responsible for the maintenance of central sensitization through the propagation of additional abnormal processes throughout a neural network that includes key brain regions associated with the sensory, cognitive, and affective dimensions of pain.
4.4 Are group differences in left hemisphere connectivity related to neuroanatomical changes?
Although there is similarity in central processing of TSSP across NC and FM populations, some aspects of chronic pain may be processed differently in FM as compared to NC subjects and neuroplastic changes in pain-related brain regions are likely to exist in FM [16,23]. Our previous results provide limited support for neuroanatomical changes in FM [39]. In comparison to NC subjects, we found decreased grey matter volumes among several brain structures, identified via fMRI data, that evidenced increased TSSP related activity in FM patients [39]. The effective connectivity of those data were analyzed in the present study. Thus, despite neuroanatomical differences, our present results, in combination with those of our previous fMRI study [43], provide evidence that the fundamental network of brain regions associated with TSSP do not differ across NC and FM groups.
Several features of heat induced TSSP are relevant to mechanisms of pain intensity in FM. First, in comparison to NC subjects, FM patients require lower stimulus temperatures and therefore less afferent input to generate equivalent levels of TSSP [43]. Second, FM patients display considerably longer TSSP-related aftersensations [42,46,48,50]. Finally, the latter are strongly correlated with clinical pain intensity ratings of FM patients [49]. These aspects of TSSP are mechanistically related to central sensitization and many forms of chronic pain [20,34–36,42,53]. Because TSSP and aftersensations strongly depend on spinal cord mechanisms, it is possible that major differences in pain processing between FM and NC groups largely occur at the levels of primary afferent neurons and spinal cord dorsal horn [33,46] and would then be reflected in responses within brain regions targeted by ascending pathways from the spinal cord to the brain.
4.5 Similar models of effective connectivity were found in both cerebral hemispheres
Bilateral cerebral activations are common in several forms of pain within humans and other animals [for a review see, 7,40]. The correspondence between the structural and functional data suggest that models of effectively should be similar as well, with group differences likely representing altered information processes among FM patients. Thus, finding that our models of effective connectivity were similar across both hemispheres was not surprising. For example, because of major anatomical links across the hemispheres (e.g. corpus collosum) the left hemisphere can accurately represent pain information related to body sites on the left side. Otherwise, most people couldn’t talk about or rate left-sided pain using spoken words. The hemispheres have to share the same information structure. However, the direction of influence from S1 to S2 reversed direction in RH. Given that S2 is involved in memory, learning, and object recognition [7–9,19,22,25,27,29,44], this change in influence may signal its role in recognizing and contextualizing the nature of the painful stimuli.
5.0 Limitations
The ability to interpret the direct, indirect, and reciprocal interactions in a model having a large number of brain regions is a known limitation of effective connectivity analyses given the immense inter-connectedness of the brain. Moreover, the addition of each new brain region into a model necessitates a substantial increase in statistical power vis-à-vis significantly larger sample sizes. Because differences may exist in other brain regions associated with higher order pain related processes, future research could explore different models involved in disparate and overlapping models of pain related networks.
6.0 Conclusions
The present study extends results of brain imaging studies of TSSP in showing that the interactions in brain regions associated with TSSP are similar to those which occur during other forms of pain and are applicable to sensory, cognitive, and affective dimensions. The interactions within this network are similar between NC subjects and FM patients with some differences. Finally, the same network of interactions applies to both cerebral hemispheres, with very similar strengths of interaction.
Perspective.
Models of effective connectivity involving pain related processes were estimated with Æ’MRI data from chronic pain and healthy populations. Models were estimated in both hemispheres, and although similar, fibromyalgia was associated with unique models of pain related processes. Group differences involved the left hemisphere and S1, S2, and posterior insula.
Acknowledgments
Supported by NIH Grants NS-38767, AR053541 and supported in part by Clinical Research Center grant RR00082.
Footnotes
Disclosures
There is no relationship (financial or otherwise) that poses a conflict of interest, and thus precludes the publication of this study.
Publisher's Disclaimer: This is a PDF file of an unedited manuscript that has been accepted for publication. As a service to our customers we are providing this early version of the manuscript. The manuscript will undergo copyediting, typesetting, and review of the resulting proof before it is published in its final citable form. Please note that during the production process errors may be discovered which could affect the content, and all legal disclaimers that apply to the journal pertain.
References
- 1.Bollen KA. Structural equations with latent variables. New York: Wiley; 1989. [Google Scholar]
- 2.Browne MW, Cudeck R. Alternative ways of assessing model fit. In: Bollen KA, Long JS, editors. Testing structural equation models. Sage; Newbury Park, CA: 1993. pp. 136–162. [Google Scholar]
- 3.Burton H, Fabri M, Alloway K. Cortical areas within the lateral sulcus connected to cutaneous representations in areas 3b and 1: a revised interpretation of the second somatosensory area in macaque monkeys. J Comp Neurol. 1995;355:539–562. doi: 10.1002/cne.903550405. [DOI] [PubMed] [Google Scholar]
- 4.Casey KL, Bushnell MC, editors. Pain Imaging: Progress in Pain Research and Management. Vol. 18. IASP Press; Seattle: 2000. [Google Scholar]
- 5.Coghill RC, Talbot JD, Evans AC, Meyer E, Gjedde A, Bushnell MC, Duncan GH. Distributed processing of pain and vibration by the human brain. J Neurosci. 1994;14:4095–4108. doi: 10.1523/JNEUROSCI.14-07-04095.1994. [DOI] [PMC free article] [PubMed] [Google Scholar]
- 6.Craggs JG, Price DD, Verne GN, Perlstein WM, Robinson ME. Functional brain interactions that serve cognitive-affective processing during pain and placebo analgesia. Neuroimage. 2007;38:720–729. doi: 10.1016/j.neuroimage.2007.07.057. [DOI] [PMC free article] [PubMed] [Google Scholar]
- 7.Davis KD. The neural circuitry of pain as explored with functional MRI. Neurol Res. 2000;22:313–317. doi: 10.1080/01616412.2000.11740676. [DOI] [PubMed] [Google Scholar]
- 8.Davis KD, Kwan CL, Crawley AP, Mikulis DJ. Functional MRI study of thalamic and cortical activations evoked by cutaneous heat, cold, and tactile stimuli. J Neurophysiol. 1998;80:1533–1546. doi: 10.1152/jn.1998.80.3.1533. [DOI] [PubMed] [Google Scholar]
- 9.Davis KD, Taylor SJ, Crawley AP, Wood ML, Mikulis DJ. Functional MRI of pain- and attention-related activations in the human cingulate cortex. J Neurophysiol. 1997;77:3370–3380. doi: 10.1152/jn.1997.77.6.3370. [DOI] [PubMed] [Google Scholar]
- 10.Disbrow E, Roberts T, Poeppel D, Krubitzer L. Evidence for interhemispheric processing of inputs from the hands in human S2 and PV. J Neurophysiol. 2001;85:2236–2244. doi: 10.1152/jn.2001.85.5.2236. [DOI] [PubMed] [Google Scholar]
- 11.Eickhoff SB, Amunts K, Mohlberg H, Zilles K. The human parietal operculum. II. Stereotaxic maps and correlation with functional imaging results. Cereb Cortex. 2006;16:268–279. doi: 10.1093/cercor/bhi106. [DOI] [PubMed] [Google Scholar]
- 12.Eickhoff SB, Jbabdi S, Caspers S, Laird AR, Fox PT, Zilles K, Behrens TE. Anatomical and functional connectivity of cytoarchitectonic areas within the human parietal operculum. J Neurosci. 2010;30:6409–6421. doi: 10.1523/JNEUROSCI.5664-09.2010. [DOI] [PMC free article] [PubMed] [Google Scholar]
- 13.Eickhoff SB, Schleicher A, Zilles K, Amunts K. The human parietal operculum. I. Cytoarchitectonic mapping of subdivisions. Cereb Cortex. 2006;16:254–267. doi: 10.1093/cercor/bhi105. [DOI] [PubMed] [Google Scholar]
- 14.Fields H. State-dependent opioid control of pain. Nat Rev Neurosci. 2004;5:565–575. doi: 10.1038/nrn1431. [DOI] [PubMed] [Google Scholar]
- 15.Forman SD, Cohen JD, Fitzgerald M, Eddy WF, Mintun MA, Noll DC. Improved assessment of significant activation in functional magnetic resonance imaging (fMRI): use of a cluster-size threshold. Magn Reson Med. 1995;33:636–647. doi: 10.1002/mrm.1910330508. [DOI] [PubMed] [Google Scholar]
- 16.Hargrove JB, Bennett RM, Simons DG, Smith SJ, Nagpal S, Deering DE. Quantitative electroencephalographic abnormalities in fibromyalgia patients. Clin EEG Neurosci. 2010;41:132–139. doi: 10.1177/155005941004100305. [DOI] [PubMed] [Google Scholar]
- 17.Jensen KB, Kosek E, Petzke F, Carville S, Fransson P, Marcus H, Williams SC, Choy E, Giesecke T, Mainguy Y, Gracely R, Ingvar M. Evidence of dysfunctional pain inhibition in Fibromyalgia reflected in rACC during provoked pain. Pain. 2009;144:95–100. doi: 10.1016/j.pain.2009.03.018. [DOI] [PubMed] [Google Scholar]
- 18.Jöreskog KG, Sörbom D. LISREL8: User’s Reference Guide. Chicago: Scientific Software International, Inc; 1996. [Google Scholar]
- 19.Kong J, White NS, Kwong KK, Vangel MG, Rosman IS, Gracely RH, Gollub RL. Using fMRI to dissociate sensory encoding from cognitive evaluation of heat pain intensity. Hum Brain Mapp. 2006;27:715–721. doi: 10.1002/hbm.20213. [DOI] [PMC free article] [PubMed] [Google Scholar]
- 20.Koyama Y, Koyama T, Kroncke AP, Coghill RC. Effects of stimulus duration on heat induced pain: the relationship between real-time and post-stimulus pain ratings. Pain. 2004;107:256–266. doi: 10.1016/j.pain.2003.11.007. [DOI] [PubMed] [Google Scholar]
- 21.Mendell L, Wall P. Responses of single dorsal cord cells to peripheral cutaneous unmyelinated fibres. Nature. 1965;206:97–99. doi: 10.1038/206097a0. [DOI] [PubMed] [Google Scholar]
- 22.Moulton EA, Keaser ML, Gullapalli RP, Greenspan JD. Regional intensive and temporal patterns of functional MRI activation distinguishing noxious and innocuous contact heat. J Neurophysiol. 2005;93:2183–2193. doi: 10.1152/jn.01025.2004. [DOI] [PubMed] [Google Scholar]
- 23.Napadow V, LaCount L, Park K, As-Sanie S, Clauw DJ, Harris RE. Intrinsic brain connectivity in fibromyalgia is associated with chronic pain intensity. Arthritis Rheum. 2010;62:2545–2555. doi: 10.1002/art.27497. [DOI] [PMC free article] [PubMed] [Google Scholar]
- 24.Ogino Y, Nemoto H, Inui K, Saito S, Kakigi R, Goto F. Inner experience of pain: imagination of pain while viewing images showing painful events forms subjective pain representation in human brain. Cereb Cortex. 2007;17:1139–1146. doi: 10.1093/cercor/bhl023. [DOI] [PubMed] [Google Scholar]
- 25.Perlstein WM, Elbert T, Stenger VA. Dissociation in human prefrontal cortex of affective influences on working memory-related activity. Proc Natl Acad Sci U S A. 2002;99:1736–1741. doi: 10.1073/pnas.241650598. [DOI] [PMC free article] [PubMed] [Google Scholar]
- 26.Petersel DL, Dror V, Cheung R. Central Amplification and Fibromyalgia: Disorder of Pain Processing. Journal of Neuroscience Research. 2011;89:29–34. doi: 10.1002/jnr.22512. [DOI] [PubMed] [Google Scholar]
- 27.Peyron R, Laurent B, Garcia-Larrea L. Functional imaging of brain responses to pain. A review and meta-analysis (2000) Neurophysiol Clin. 2000;30:263–288. doi: 10.1016/s0987-7053(00)00227-6. [DOI] [PubMed] [Google Scholar]
- 28.Ploner M, Lee MC, Wiech K, Bingel U, Tracey I. Flexible Cerebral Connectivity Patterns Subserve Contextual Modulations of Pain. Cereb Cortex. 2011;21:719–726. doi: 10.1093/cercor/bhq146. [DOI] [PubMed] [Google Scholar]
- 29.Price DD. Psychological and neural mechanisms of the affective dimension of pain. Science. 2000;288:1769–1772. doi: 10.1126/science.288.5472.1769. [DOI] [PubMed] [Google Scholar]
- 30.Price DD. Central neural mechanisms that interrelate sensory and affective dimensions of pain. Mol Interv. 2002;2:392–403. 339. doi: 10.1124/mi.2.6.392. [DOI] [PubMed] [Google Scholar]
- 31.Price DD, Dubner R. Mechanisms of first and second pain in the peripheral and central nervous systems. J Invest Dermatol. 1977;69:167–171. doi: 10.1111/1523-1747.ep12497942. [DOI] [PubMed] [Google Scholar]
- 32.Price DD, Hayes RL, Ruda M, Dubner R. Neural representation of cutaneous aftersensations by spinothalamic tract neurons. Fed Proc. 1978;37:2237–2239. [PubMed] [Google Scholar]
- 33.Price DD, Hu JW, Dubner R, Gracely RH. Peripheral suppression of first pain and central summation of second pain evoked by noxious heat pulses. Pain. 1977;3:57–68. doi: 10.1016/0304-3959(77)90035-5. [DOI] [PubMed] [Google Scholar]
- 34.Price DD, Long S, Huitt C. Sensory testing of pathophysiological mechanisms of pain in patients with reflex sympathetic dystrophy. Pain. 1992;49:163–173. doi: 10.1016/0304-3959(92)90139-3. [DOI] [PubMed] [Google Scholar]
- 35.Price DD, Staud R, Robinson ME, Mauderli AP, Cannon R, Vierck CJ. Enhanced temporal summation of second pain and its central modulation in fibromyalgia patients. Pain. 2002;99:49–59. doi: 10.1016/s0304-3959(02)00053-2. [DOI] [PubMed] [Google Scholar]
- 36.Price DD, Zhou Q, Moshiree B, Robinson ME, Verne GN. Peripheral and Central Contributions to Hyperalgesia in Irritable Bowel Syndrome. The Journal of Pain. 2006;7:529–535. doi: 10.1016/j.jpain.2005.12.011. [DOI] [PubMed] [Google Scholar]
- 37.Rainville P, Doucet JC, Fortin MC, Duncan GH. Rapid deterioration of pain sensory-discriminative information in short-term memory. Pain. 2004;110:605–615. doi: 10.1016/j.pain.2004.04.024. [DOI] [PubMed] [Google Scholar]
- 38.Rainville P, Duncan GH, Price DD, Carrier B, Bushnell MC. Pain affect encoded in human anterior cingulate but not somatosensory cortex. Science. 1997;277:968–971. doi: 10.1126/science.277.5328.968. [DOI] [PubMed] [Google Scholar]
- 39.Robinson ME, Craggs JG, Price DD, Perlstein WM, Staud R. Gray Matter Volumes of Pain-Related Brain Areas Are Decreased in Fibromyalgia Syndrome. Journal of Pain. 2011;12:436–443. doi: 10.1016/j.jpain.2010.10.003. [DOI] [PMC free article] [PubMed] [Google Scholar]
- 40.Shackman AJ, Salomons TV, Slagter HA, Fox AS, Winter JJ, Davidson RJ. The integration of negative affect, pain and cognitive control in the cingulate cortex. Nature Reviews Neuroscience. 2011;12:154–167. doi: 10.1038/nrn2994. [DOI] [PMC free article] [PubMed] [Google Scholar]
- 41.Smith SM. Overview of fMRI analysis. Br J Radiol. 2004;77(Spec No 2):S167–175. doi: 10.1259/bjr/33553595. [DOI] [PubMed] [Google Scholar]
- 42.Staud R, Cannon RC, Mauderli AP, Robinson ME, Price DD, Vierck CJ., Jr Temporal summation of pain from mechanical stimulation of muscle tissue in normal controls and subjects with fibromyalgia syndrome. Pain. 2003;102:87–95. doi: 10.1016/s0304-3959(02)00344-5. [DOI] [PubMed] [Google Scholar]
- 43.Staud R, Craggs JG, Perlstein WM, Robinson ME, Price DD. Brain activity associated with slow temporal summation of C-fiber evoked pain in fibromyalgia patients and healthy controls. Eur J Pain. 2008;12:1078–1089. doi: 10.1016/j.ejpain.2008.02.002. [DOI] [PMC free article] [PubMed] [Google Scholar]
- 44.Staud R, Craggs JG, Robinson ME, Perlstein WM, Price DD. Brain activity related to temporal summation of C-fiber evoked pain. Pain. 2007;129:130–142. doi: 10.1016/j.pain.2006.10.010. [DOI] [PMC free article] [PubMed] [Google Scholar]
- 45.Staud R, Domingo M. Evidence for abnormal pain processing in fibromyalgia syndrome. Pain Med. 2001;2:208–215. doi: 10.1046/j.1526-4637.2001.01030.x. [DOI] [PubMed] [Google Scholar]
- 46.Staud R, Price DD, Fillingim RB. Advanced continuous-contact heat pulse design for efficient temporal summation of second pain (windup) J Pain. 2006;7:575–582. doi: 10.1016/j.jpain.2006.02.005. [DOI] [PubMed] [Google Scholar]
- 47.Staud R, Price DD, Robinson ME, Vierck CJ., Jr Body pain area and pain-related negative affect predict clinical pain intensity in patients with fibromyalgia. J Pain. 2004;5:338–343. doi: 10.1016/j.jpain.2004.05.007. [DOI] [PubMed] [Google Scholar]
- 48.Staud R, Robinson ME, Price DD. Temporal summation of second pain and its maintenance are useful for characterizing widespread central sensitization of fibromyalgia patients. J Pain. 2007;8:893–901. doi: 10.1016/j.jpain.2007.06.006. [DOI] [PMC free article] [PubMed] [Google Scholar]
- 49.Staud R, Robinson ME, Vierck CJ, Jr, Cannon RC, Mauderli AP, Price DD. Ratings of experimental pain and pain-related negative affect predict clinical pain in patients with fibromyalgia syndrome. Pain. 2003;105:215–222. doi: 10.1016/s0304-3959(03)00208-2. [DOI] [PubMed] [Google Scholar]
- 50.Staud R, Vierck CJ, Cannon RL, Mauderli AP, Price DD. Abnormal sensitization and temporal summation of second pain (wind-up) in patients with fibromyalgia syndrome. Pain. 2001;91:165–175. doi: 10.1016/s0304-3959(00)00432-2. [DOI] [PubMed] [Google Scholar]
- 51.Talairach J, Tournoux P. Co-Planar stereotaxic atlas of the human brain. New York: Thieme Publishers Inc; 1988. [Google Scholar]
- 52.Tantorski E. [Accessed August 1, 2011];Functional Neuroanatomy: Web textbook. Available at http://faculty.quinnipiac.edu/health/tantorski/index.html.
- 53.Vierck CJ, Jr, Cannon RL, Fry G, Maixner W, Whitsel BL. Characteristics of temporal summation of second pain sensations elicited by brief contact of glabrous skin by a preheated thermode. J Neurophysiol. 1997;78:992–1002. doi: 10.1152/jn.1997.78.2.992. [DOI] [PubMed] [Google Scholar]