

Abstract
The dorsoventral and developmental gradients of entorhinal layer II cell grid properties correlate with their resonance properties and with their hyperpolarization-activated cyclic nucleotide-gated (HCN) ion channel current characteristics. We investigated whether such correlation existed in rat hippocampal CA1 pyramidal cells, where place fields also show spatial and temporal gradients. Resonance was absent during the first postnatal week, and emerged during the second week. Resonance was stronger in dorsal than ventral cells, in accord with HCN current properties. Resonance responded to cAMP in ventral but not in dorsal cells. The dorsoventral distribution of HCN1 and HCN2 subunits and of the auxiliary protein tetratricopeptide repeat-containing Rab8b-interacting protein (TRIP8b) could account for these differences between dorsal and ventral cells. The analogous distribution of the intrinsic properties of entorhinal stellate and hippocampal cells suggests the existence of general rules of organization among structures that process complementary features of the environment.
Introduction
The rodent hippocampus is not a homogenous structure (Moser and Moser, 1998). It can be divided into three compartments (dorsal, intermediate, and ventral), each with specific anatomical features (Swanson et al., 1978; Fanselow and Dong, 2010). Gene expression analysis reveals that the dorsal and ventral regions of the hippocampus have distinct molecular organizations (Thompson et al., 2008; Dong et al., 2009). This heterogeneity likely underlies their distinct functions; the dorsal (septal) part deals with cognitive processes (memory) and the ventral (temporal) part deals with emotional aspects (Fanselow and Dong, 2010). At the cellular level, place fields coded by CA1 pyramidal cells (O'Keefe and Nadel, 1978) expand along the dorsoventral axis and their properties change during development (O'Keefe and Nadel, 1978; Kjelstrup et al., 2008; Langston et al., 2010; Wills et al., 2010). Given the different information processing performed in the dorsal and ventral parts, we hypothesized that hippocampal neurons would have different integrative properties along the dorsoventral axis.
Pioneering work performed in the entorhinal cortex provides ground for such a hypothesis. Layer II stellate cells represent the external space as a grid, with size that expands along the dorsoventral axis and with properties that change during development (Sargolini et al., 2006; Langston et al., 2010; Wills et al., 2010). In parallel, the integrative properties of layer II stellate cells change in time (during development) and space (along the dorsoventral axis), and these correlate with differential distributions of hyperpolarization-activated cyclic nucleotide-gated (HCN) channels and leak K conductances in these neurons (Giocomo et al., 2007; Nolan et al., 2007; Burton et al., 2008; Garden et al., 2008; Giocomo and Hasselmo, 2008; Boehlen et al., 2010; Yoshida et al., 2011).
Hippocampal CA1 pyramidal cells are optimized to preferentially respond, or resonate, to inputs in the theta frequency range, similar to stellate cells. Resonance is achieved by specific ion channels, including the hyperpolarization-activated current Ih (Hutcheon and Yarom, 2000; Pike et al., 2000; Hu et al., 2002; Narayanan and Johnston, 2007; Marcelin et al., 2009). HCN channels also play a key role in temporal coding. They provide negative time delays in the theta frequency range (Narayanan and Johnston, 2008; Marcelin et al., 2009). They also shape synaptic inputs in the gamma (40–80 Hz) band (Magee, 1998; Garden et al., 2008). The developmental profile of the expression of HCN channel isoforms and of Ih properties in the CA1 region (Bender et al., 2001; Vasilyev and Barish, 2002; Surges et al., 2006; Brewster et al., 2007) suggests that integrative properties of pyramidal cells will be age dependent.
Although not in direct synaptic contact, layer II grid cells and hippocampal place cells are part of a network representing space. Therefore, we sought to study whether the spatial and developmental profiles of intrinsic properties in CA1 cells follow the same general rules as layer II stellate cells (Giocomo et al., 2007; Nolan et al., 2007; Burton et al., 2008; Garden et al., 2008; Giocomo and Hasselmo, 2008; Boehlen et al., 2010) focusing on theta resonance, temporal summation, and HCN current properties.
Materials and Methods
Hippocampal slices from the dorsal (coronal sectioning) and the ventral [with a 30° angle from the sagittal plane as in (Bernard et al., 2004)] hippocampus were prepared from postnatal (PN) day 11–12, 14–15, and 5 male Wistar rats. ACSF contained the following (in mm): 126 NaCl, 3.5 KCl, 2 CaCl2, 1.3 MgCl2, 1.2 NaH2PO4, 26 NaHCO3, d-glucose 10, and NBQX (1 μm), D-APV (50 μm), and bicuculline (10 μm) to block AMPA, NMDA, and GABAA receptors, respectively. Cells were recorded at 34 ± 1°C with a solution containing (in mm): 120 KMeSO4, 20 KCl, 0.2 EGTA, 2 MgCl2, 10 HEPES, 4 Na2ATP, 0.3 Tris GTP, 14 phosphocreatine, biocytin 0.4%, and KOH to adjust to pH 7.3 (whole-cell recordings) or 120 KCl, 20 tetraethylammonium-Cl, 10 HEPES, 5 4-aminopyridine, 2 CaCl2, 1 MgCl2, 1 BaCl2, biocytin 0.4%, and KOH to adjust to pH 7.3 (cell-attached recordings). In some experiments, 10 μm cAMP was added to the pipette solution. Membrane potential was not corrected for liquid junction potential (2 mV, cell attached; 9 mV, whole cell). For consistency, all recordings were performed in mid-distal CA1 along the transverse axis, close to the stratum oriens border for somata, and close to stratum lacunosum moleculare for dendrites.
CA1 pyramidal cells somata and dendrites were recorded under visual control (Nikon FN1 microscope; Scientifica PatchStar manipulators) with an Axopatch700B amplifier and Digidata 1322 interface (Molecular Devices). The distance between the recording site and the soma was determined both under visual control before performing dendritic recordings, and post hoc following morphological processing as previously described (Esclapez et al., 1999).
Analysis of Ih (whole-cell recordings).
Currents mediated by Ih were recorded in voltage-clamp mode by applying hyperpolarizing voltage steps (starting from a holding potential of −50 mV up to −140 mV). Data were acquired with the help of pCLAMP 10 and analyzed off-line using Clampfit 10.0 (Molecular Devices). The amplitude of Ih was determined by subtracting the instantaneous current at the beginning of the voltage step from the steady-state current at the end. The activation time constant was obtained using a double exponential. Boltzmann fits of the tail current were made to obtain V1/2, the midpoint activation voltage. Single or double exponential fits were used to measure the time constants of Ih activation.
Analysis of Ih (cell-attached recordings).
Data collection started after obtaining >2 GΩ seal. We used 6 MΩ pipette resistance for somatic recordings and 12 MΩ for dendritic recordings. A family of currents was obtained from +10 to −90 mV from rest (effective change in trans-membrane potential of the patch), in 10 mV increments. A series of 4 leak currents (+30 mV from rest) was obtained and averaged. The averaged leak current was subtracted from the family of currents (the leak current was multiplied by the ratio of test voltage command/leak voltage command). This operation gave the activation curve of Ih. The whole procedure was repeated 10 times, and the activation curves were then averaged. At the end of the experiment, a gentle suction was applied to break-in to measure the resting membrane potential. Ih parameters were measured as described above for whole-cell recordings.
Resonance protocol.
Discrete current wavelets at varying frequencies were injected in the recorded cell in current-clamp mode (from 1 to 50 Hz, with 1 Hz steps; and 25 wavelets between 50 and 200 Hz with logarithmic scale spacing); each wavelet consisted of 12 cycles with waxing and waning amplitude. The amplitude of the injected current was adjusted so that the 1 Hz wavelet produced a ±5 mV excursion of membrane potential. A 50 ms hyperpolarizing step was applied between two successive wavelets. We used discrete wavelet injections rather than the common ZAP/Chirp stimulus, as described previously (Marcelin et al., 2009). Impedance (Z) was calculated as the ratio of the voltage/current Fourier transforms: Z = FFT(voltage response)/FFT(injected current), for each frequency. The magnitude of the complex-valued impedance |Z| was plotted against frequency to give an impedance–magnitude profile. Two resonance parameters were measured: Fres, the resonance frequency when |Z| is maximum; and Q, the amplification ratio defined as the |Z|Fres/|Z|1 Hz ratio. The impedance phase was calculated as φ = tan−1(Im(Z)/Re(Z)), where Im(Z) and Re(Z) are the imaginary and real parts of Z, respectively (Narayanan and Johnston, 2008). Fφ is defined as the frequency f where φ(f) = 0. For f < Fφ, φ(f) > 0 and the response of the membrane appears to occur before the injected current (phase lead). Conversely, for f > Fφ, φ(f) < 0 and the response of the membrane appears to occur after the injected current (phase lag). To characterize the amount of phase lead, we measured ΦL, the total inductive phase, defined as the area of φ(f) where φ(f) > 0 (Narayanan and Johnston, 2008).
Temporal summation.
Artificial EPSPs were evoked by current injections of the form of an α function: I = Imax t exp (-αt), with α = 0.1. Temporal summation ratio in a train of five artificial EPSPs was computed as EPSP5/EPSP1, where EPSP5 and EPSP1 are the amplitudes of first and fifth artificial EPSPs in the train, respectively.
Morphology.
After electrophysiological recordings, slices were fixed overnight at 4°C in a solution containing 4% paraformaldehyde (PFA) in 0.1 m PB, pH 7.4. After fixation, slices were rinsed in PB, cryoprotected in sucrose, and quickly frozen on dry ice. Detection of labeled neurons was performed on unsectioned slices as described previously (Esclapez et al., 1999). Briefly, to neutralize endogenous peroxidase, slices were pretreated for 30 min in 1% H2O2. After several rinses in 0.1 m PBS, pH 7.4, slices were incubated overnight at 4°C in avidin-biotinylated peroxidase complex (1:200; Vector Laboratories) diluted in PBS. After 1.5 h rinses in PBS, slices were processed with 3,3′-diaminobenzidine tetrahydrochloride (DAB; Sigma) and H2O2 diluted in distilled H2O (Sigma fast tablets). A morphometric analysis of pyramidal cells was performed after 3D reconstruction using a Neurolucida workstation (Microbrightfield). The morphometric data did not involve compensation for tissue shrinkage, which was 86% in z–axis and 10% in x/y-axes.
Simulations.
The Neurolucida morphometric data of 10 CA1 cells (5 from dorsal and 5 from ventral region) were imported into the NEURON simulation environment (v7.1) (Hines and Carnevale, 1997), and a multicompartmental model for each of them was implemented using the same passive properties (τm = 28 ms, Rm = 28 kΩ · cm2, Ra = 150 Ω · cm) in all cases. The NEURON ImpedanceTools was then used to calculate the voltage attenuation measured at the soma when the same current is injected in every point on the cell.
Western blotting.
Tissue preparation and Western blotting were performed as previously described (Lewis et al., 2009) with some modifications. Briefly, animals were killed and hippocampi were rapidly removed and divided into three parts along the septo-temporal axis: dorsal, intermediate, and ventral parts. The samples were immediately frozen in liquid nitrogen and stored at −80°C. For the preparation of tissue homogenate, the hippocampal samples were homogenized in lysis buffer containing 50 mm Tris-HCl, pH 7.4, 150 mm NaCl, 1% Nonidet-40, 0.1% SDS, 0.5% sodium desoxycholate, 5 mm EDTA, and a mixture of protease inhibitors (Roche). The homogenates were centrifuged at 20,000 × g at 4°C for 10 min, and the supernatant was collected and frozen until further use. Protein concentrations were determined with the Bradford protein assay (Bio-Rad). For Western blotting, extracts were mixed with sample buffer, boiled at 95°C for 5 min, cooled on ice for 2 min, and separated on 10% SDS-PAGE at 150 V under denaturing conditions. Proteins were blotted on PVDF membranes and the blots were blocked in 5% milk in TBST solution for 30 min, and incubated with primary antibodies at 4°C overnight. Then the blots were rinsed in TBST for 3 × 10 min and incubated in HRP-conjugated secondary antibody for 1 h. Antibody binding was detected using SuperSignal West Pico Chemiluminescent Substrate (Thermo Scientific), and quantified by densitometry from blots with linear signal using NIH ImageJ software. α-Tubulin expression was used for loading control. The relative proportions were calculated by dividing the value of α-tubulin and normalized ventral density by dorsal. The following antibodies and dilutions were used for Western blotting in the present study: guinea pig anti-HCN1 (Shin and Chetkovich, 2007) 1:1000; guinea pig anti-HCN2 (Shin et al., 2006) 1:1000; rabbit anti- tetratricopeptide repeat-containing Rab8b-interacting protein (TRIP8b; Lewis et al., 2009) 1:5000; mouse anti-α-tubulin (DM1A, Santa Cruz Biotechnology) 1:5000. Normalized data were analyzed using unpaired, two-tailed Student's t test, with significance considered as p < 0.05.
mRNA isolation of hippocampi and real-time RT-PCR.
Samples were prepared and stored at −80°C as above. mRNA from the dorsal and ventral parts of the hippocampus was isolated by Dynabeads mRNA Direct Micro Kit (Dynal) according to the manufacturer's protocol. HCN1 and HCN2 transcript quantification was performed by real-time RT-PCR (PRISM 7700; PE Biosystems). Primers and double-fluorescent oligonucleotides (FAM = reporter dye, TAMRA = quencher dye) for HCN1 and HCN2 channel subunits and synaptophysin were designed with Primer Express software (PE Biosystems). No significant homology of the amplicon sequences with other previously characterized genes has been found searching GenBank databases by BLASTN program. Relative quantification of the starting mRNA copy numbers using multiple replicates for each reaction was performed according to the ΔΔCt-method (Fink et al., 1998). The signal threshold was set within the exponential phase of the reaction for determination of the threshold cycle (Ct). Synaptophysin was used as an endogenous, neuron-specific reference gene for normalization of HCN channel subunit mRNAs. Relative quantification started from 5.0 to 10.0 ng of mRNA. RT-PCRs were carried out in a total reaction volume of 12.5 μl using the EZ RTPCR Kit (PE Biosystems). Reactions started with 300 μm each dNTP, 1xTaqMan EZ Buffer, 0.1 U/μl rTth DNA polymerase, 0.01 U/μl AmpErase UNG, Mn(OAc)2, and primers as well as double-fluorescent oligonucleotides. Cycling conditions included 50°C for 2 min, 60°C for 20 min (RT reaction), followed by 95°C for 5 min, and a two-step PCR with 60 cycles at 94°C for 15 s and 59°C for 60 s (PRISM 7700 SDS; PE Biosystems). Fluorescent signals were normalized to a passive internal reference (ΔRn) and the Ct was set within cycle 28, i.e., the exponential phase of the PCR. Based on the Ct ratios, the starting copy number of HCN1 and HCN2 mRNAs were calculated relative to the reference gene (ΔΔCt method; n = 5 animals for each group and each time point). The primer sequences for PCRs can be found in Jung et al. (2011). Group comparisons were carried out by a Mann–Whitney-U test.
Tissue preparation and immunocytochemistry of brain slices.
Sprague Dawley rats aged 12 d (n = 4) were perfused via the ascending aorta with 0.9% saline solution followed by perfusion with 4% PFA solution made in 0.1 m PB (pH 7.4, 4°C). Brains were postfixed for 2–4 h (4°C) and immersed in 15%, followed by 25% sucrose for cryoprotection. Serial sections (20 μm thickness) were first collected from the septal pole of the hippocampus (cut in the coronal plane). Brain blocks were then turned to permit collection of horizontal sections from the temporal pole (Bender et al., 2005). In each plane, 1 in 6 serial sections were subjected to HCN1 immunocytochemistry (ICC) and an adjacent series of sections was used for microtubule-associated protein 2 (MAP 2)-ICC. ICC was performed on free-floating sections using standard avidin-biotin complex methods, as described previously (Chen et al., 2001; Bender et al., 2007; Brewster et al., 2007). Briefly, after several washes with PBS containing 0.3% Triton X-100 (PBS-T, pH 7.4), sections were treated with 0.3% H2O2/PBS for 30 min, then blocked with 5% normal goat serum for 30 min to prevent nonspecific binding. After rinsing, sections were incubated for 36 h at 4°C with guinea pig anti-HCN1 (1:5000; a gift from Dr. Shigemoto, National Institute for Physiological Sciences, Okazaki, Japan) or mouse anti-MAP2 (1:50,000, Sigma) antisera in PBS containing 1% BSA, and washed in PBS-T (3 × 5 min). Sections were incubated with biotinylated goat-anti-guinea pig or mouse IgG (1:400; Vector laboratories) in PBS for 1 h at room temperature. After washing (3 × 5 min), sections were incubated with the avidin-biotin-peroxidase complex solution (1:200; Vector Laboratories) for 2 h, rinsed (3 × 5 min), and reacted with 0.04% DAB containing 0.01% H2O2.
Chemicals.
All chemicals and drugs were obtained from Sigma or Ascent Technology unless specified otherwise.
We used nonparametric Mann–Whitney test for n < 6, and Student's t test or ANOVA for electrophysiological data and nonparametric two independent sample Wilcoxon rank sum test for the morphometric analysis. Unless noted otherwise, results are expressed as mean ± SEM, with p < 0.05 considered significant.
Results
Morphological properties
The hippocampus develops in a dorsoventral gradient (Bayer, 1980). Since most recordings were performed at PN11–12, we first investigated the morphological features of CA1 pyramidal cells from the dorsal and ventral parts of the hippocampus (Fig. 1). Morphometric analysis revealed no significant differences in mean cell body area and mean total length of apical and basal dendrites, as well as in the mean diameter of the first-order apical dendrite between CA1 pyramidal cells from the dorsal (n = 5) and ventral (n = 5) hippocampus at PN11–12 (Table 1). To test whether neurons from the dorsal and ventral regions have similar signal propagation features, we implemented a multicompartmental model from 3D reconstructions of the cells shown in Figure 1. Using the same passive properties for all model neurons, the average input resistances measured from the soma were 239.7 ± 49.3 MΩ (dorsal) and 178.7 ± 26 MΩ (ventral), not significantly different (Mann–Whitney rank sum test, p = 0.421). As shown in Figure 2, the voltage attenuation measured at the soma was also comparable at all distances, suggesting that the expected overall signal propagation in these neurons would be relatively similar. We conclude that the neurons recorded in this study had similar morphological and passive cable properties.
Figure 1.

Tridimensional reconstruction of CA1 pyramidal cells recorded in the dorsal (A, n = 5) and ventral (B, n = 5) parts of the hippocampus. There are no overt morphological differences (see Table 1 for quantification). Scale bars, 100 μm.
Table 1.
Morphometric properties of CA1 pyramidal cells from the dorsal and ventral hippocampus
| Cell morphology | Mean cell body area (μm2) | Mean total length of apical dendrite (μm) | Mean diameter of the first-order apical dendrite (μm) | Mean total length of basal dendrites (μm) |
|---|---|---|---|---|
| Dorsal (n = 5) | 267 ± 52 | 3918 ± 891 | 3.48 ± 0.61 | 1602 ± 373 |
| Ventral (n = 5) | 256 ± 22 | 3815 ± 494 | 3.34 ± 0.08 | 1849 ± 271 |
Figure 2.
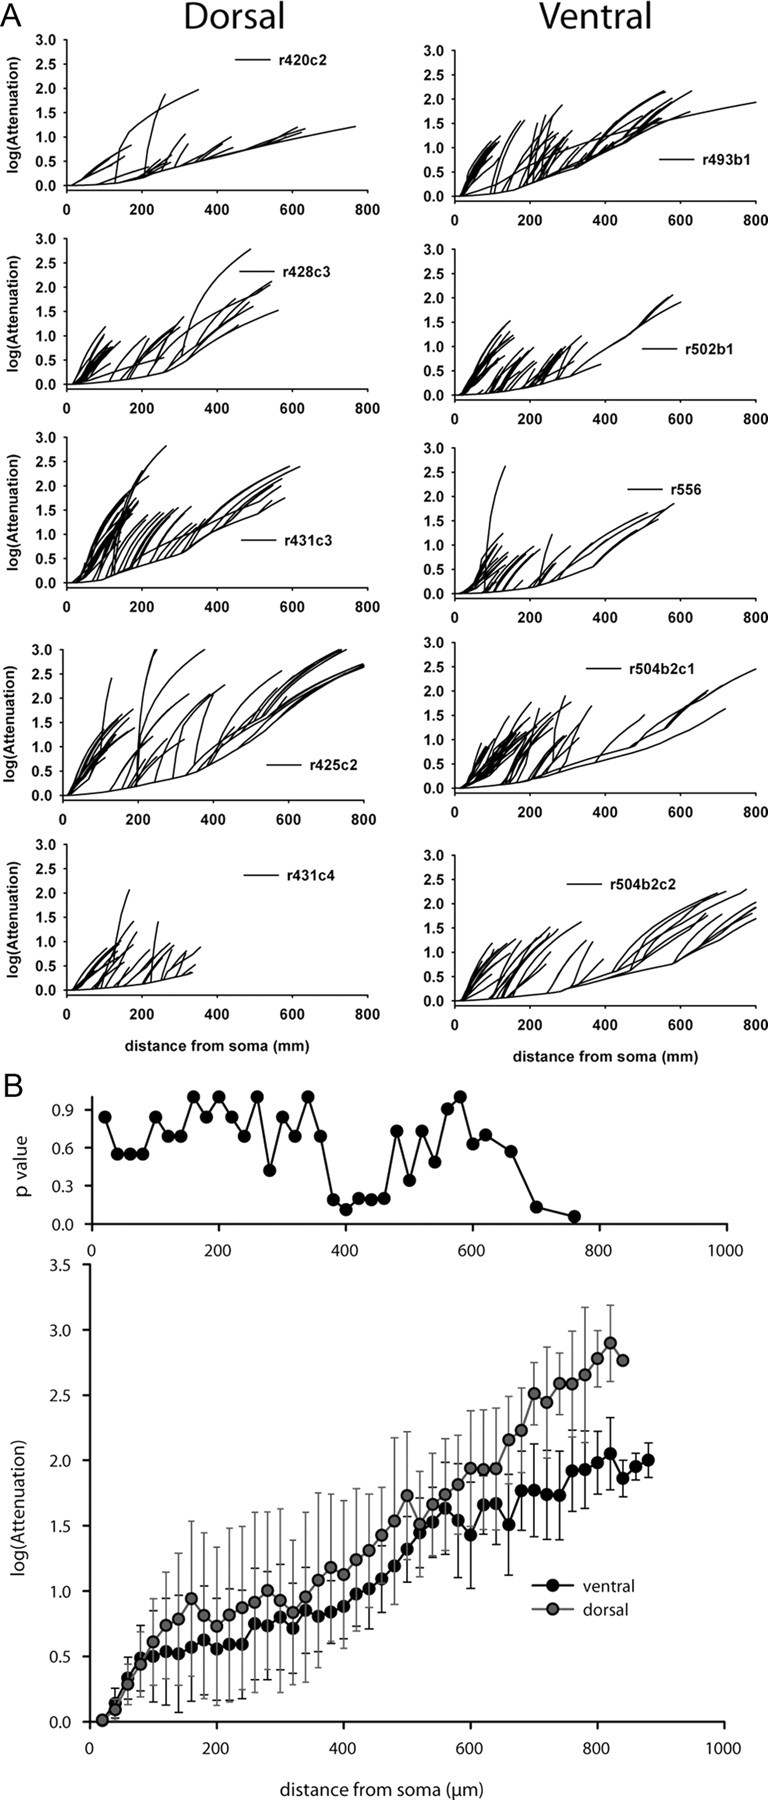
A, Curves for each neuron shown in Figure 1. Voltage attenuation appears homogeneous between the different CA1 pyramidal cells. B, Average voltage attenuation (log scale, ±SD) for the reconstructed ventral and dorsal CA1 pyramidal cells. There was no statistical difference between the average values of attenuation, calculated at different distances from the soma, from cells recorded in the ventral and dorsal parts of the hippocampus (Mann–Whitney rank sum test for n > 3, p value as a function of distance is plotted in the top panel).
Theta resonance and phase responses are larger in dorsal than in ventral cells
Using whole-cell recordings, we first assessed the resonance properties of hippocampal CA1 pyramidal cell somata. We measured the resonance frequency (Fres), the optimal frequency giving rise to the largest response, and the amplification factor Q at Fres (compared with1 Hz). Injection of oscillating currents resulted in larger resonance in dorsal (n = 46) than in ventral somata (n = 40) at PN11–12 (Table 2; Fig. 3A,B). Resonance depended upon Ih because it was blocked by the Ih antagonist ZD7288 (10 μm) in dorsal (n = 9) and ventral (n = 8) cells (Fig. 3A). Impedance curves were identical in dorsal and ventral cells in the presence of ZD7288 (Fig. 3C), suggesting that the dorsoventral differences in resonance were due to Ih.
Table 2.
Recording distance from the soma (for dendritic recordings), basic properties, resonance, and Ih parameters of dendrites and somata in dorsal and ventral cells for whole-cell recordings
| Dorsal dendrite (n = 19) | Ventral dendrite (n = 15) | Dorsal soma (n = 46) | Ventral soma (n = 40) | |
|---|---|---|---|---|
| Basic properties | ||||
| Distance (μm) | 133 ± 6 | 127 ± 4 | ||
| RMP (mV) | −60.1 ± 0.5 | −58.9 ± 0.6 | −58.4 ± 0.3 | −60.3 ± 0.5* |
| Rin (MΩ) | 189 ± 19 | 218 ± 23 | 100 ± 8 | 146 ± 12* |
| C (pF) | 95 ± 8 | 93 ± 10 | 97 ± 5 | 104 ± 6 |
| RS (MΩ) | 31 ± 2 [20–40] | 29 ± 2 [18–40] | 22 ± 1 [9–39] | 19 ± 1 [8–38] |
| Resonance | ||||
| Fres (Hz) | 3.3 ± 0.2 | 3.9 ± 0.4 | 4.6 ± 0.1 | 3.8 ± 0.2** |
| Q | 1.15 ± 0.01 | 1.18 ± 0.02 | 1.27 ± 0.01 | 1.16 ± 0.01*** |
| Fφ (Hz) | 2.1 ± 0.2 | 2.3 ± 0.2 | 2.6 ± 0.1 | 1.9 ± 0.1** |
| ΦL (rad.Hz) | 0.06 ± 0.01 | 0.07 ± 0.02 | 0.11 ± 0.01 | 0.04 ± 0.01** |
| Ih properties (whole cell) | ||||
| At −140 mV (pA) | 328 ± 19 | 318 ± 31 | 308 ± 14 | 272 ± 10* |
| At −90 mV (pA) | 147 ± 9 | 149 ± 13 | 138 ± 6 | 122 ± 5* |
| V1/2 (mV) | −89.8 ± 0.9 | −89.9 ± 0.9 | −88.9 ± 0.5 | −91.3 ± 0.5* |
| τfast (ms) | 30 ± 1 | 28 ± 1 | 20 ± 1 | 28 ± 1* |
| τslow (ms) | 205 ± 14 | 199 ± 14 | 190 ± 13 | 197 ± 15 |
*p < 0.05;
**p < 0.01;
***p < 0.001 (ventral vs dorsal).
Figure 3.

Resonance is stronger in dorsal than in ventral CA1 pyramidal cell somata. A, Left, Shows the impedance magnitude of a dorsal (black curve) and ventral (gray curve) soma before and after application of ZD7288 (red curves). Note that resonance is smaller in the ventral as compared with the dorsal cell. Resonance was abolished by ZD7288. Right, Average impedance curves are identical in dorsal and ventral somata after ZD7288 (ANOVA for group and frequency as factors). B, Histograms of resonance parameters. The resonance frequency (Fres) and the amplification ratio (Q) were similar in ventral (V) and dorsal (D) dendrites. In somata, Fres and Q were larger in dorsal than in ventral cells. C, Left, Phase responses in the same cells as in (A). Right, Average phase responses are similar in dorsal and ventral cells after ZD7288 (ANOVA for group and frequency as factors). D, Histograms of phase responses. Fφand ΦL are larger in dorsal than in ventral somata, but not in dendrites. *p < 0.05; **p < 0.01.
HCN channels not only provide bandpass filtering properties, directly controlling the amplitude of the membrane response, but also impact the temporal response (Narayanan and Johnston, 2007, 2008 Marcelin et al., 2009). They create an apparent negative time delay up to a critical frequency Fφ, i.e., the voltage response of the membrane appears to precede the inputs generating this response (phase lead). Beyond Fφ, the voltage response follows the input (phase lag). We thus evaluated the phase response φ(f) as a function of the frequency of the input current in CA1 pyramidal cell somata. We determined that Fφ, the frequency where φ(f) = 0 (i.e., where the transition from phase lead to phase lag occurs), and ΦL, the total inductive phase, are a measure of the extent of phase lead (Fig. 3C,D). Phase lag and inductive phase were stronger in dorsal (n = 46) than in ventral somata (n = 40) at PN11–12 (Table 2; Fig. 3C,D). Phase lead depended upon Ih because it was abolished by ZD7288 (10 μm) in dorsal (n = 9) and ventral (n = 8) cells (Fig. 3C,D). Phase curves were identical in dorsal and ventral cells in the presence of ZD7288 (Fig. 3C), suggesting that the dorsoventral differences in phase responses were due to Ih.
Since resonance and phase lead were already present at PN11–12, we assessed whether they were also present 1 week earlier. Resonance and phase lead were absent at PN5 in dorsal somata (Fres = 1.5 ± 0.2 Hz; Q = 1.02 ± 0.01; RMP = −57.8 ± 2.4 mV; Rin = 642 ± 103 MΩ; C = 71 ± 5 pF; n = 7, data not shown).
Increased temporal summation in ventral cells
Temporal summation of synaptic inputs plays a key role in information processing. Temporal summation results from a complex interplay between synaptic currents and ionic channels. Using injections of artificial synaptic currents through the recording pipette, we found that temporal summation was larger in ventral than dorsal cells (Fig. 4) (at 25 Hz, dorsal −9.4 ± 2.5%, n = 10; ventral 5.6 ± 4.5%, n = 10, p < 0.05; at 50 Hz, dorsal 52 ± 8%, n = 10; ventral 76 ± 8%, n = 10, p < 0.05). This integrative property depended upon Ih (Magee, 1998), as temporal summation was significantly increased and the differences between dorsal and ventral cells abolished in the presence of ZD7288 (Fig. 4) (at 25 Hz, dorsal 38 ± 7%, n = 10; ventral 47 ± 8%, n = 10; at 50 Hz, dorsal 137 ± 9%, n = 10; ventral 125 ± 7%, n = 10, p > 0.7 for both).
Figure 4.

Temporal summation is larger in ventral than in dorsal cells. Left, Examples of temporal summation at 25 and 50 Hz in a dorsal (black) and ventral (gray) soma. Summation was increased in the presence of ZD7288. Right, Histograms of summation ratios for 25 and 50 Hz trains in dorsal and ventral cells. Blockade of Ih normalized summation in dorsal and ventral cells. ANOVA *p < 0.05; **p < 0.001.
Larger Ih amplitude and faster kinetics in dorsal than ventral CA1 pyramidal cell somata
The dorsoventral gradient of HCN current properties constitutes another correlate of the gradient of grid size in stellate cells. In adult neurons, in the range of potential tested here, theta resonance depends partly upon Ih availability (Narayanan and Johnston, 2007; Marcelin et al., 2009). We thus measured Ih parameters in the same cells in which we characterized resonance and temporal summation. The amplitude of Ih was larger in dorsal than ventral somata (Table 2; Fig. 5A,B). The membrane potential for half activation (V1/2) was more depolarized by 2.4 mV in dorsal as compared with ventral somata (Table 2; Fig. 5B). Ih activated faster in dorsal than ventral somata, while the slow time constant was not different (Table 2; Fig. 5B; p = 0.39). Since Ih and resonance were measured in each recorded cell, we could correlate both parameters. As previously reported in adult ventral cells (Marcelin et al., 2009), there was a linear relationship between Ih amplitude and the amplification ratio Q (Fig. 5C).
Figure 5.

Ih availability is increased in dorsal as compared with ventral somata. A, Left (dorsal soma) and right (ventral soma), Ih activation (whole-cell recordings). Note the increased amplitude in the dorsal cell. B, Summary histograms of Ih amplitude at −140 and −90 mV (whole-cell recordings), V1/2, and activation time constant. The amplitude of Ih current is larger, and kinetics faster in dorsal than ventral somata. In contrast, Ih properties measured in proximal dendrites are similar. C, Relationship between Ih amplitude and the amplification ratio Q in dorsal (filled squares) and ventral (filled circles) somata. The whole dataset showed a linear relationship between Ih and Q. *p < 0.05.
In keeping with the increased availability of Ih, resting membrane potential was more depolarized and input resistance smaller in dorsal than ventral cells (Table 2). Input resistance was equalized in the presence of ZD7288 (dorsal: 264 ± 15 MΩ, n = 15; ventral: 261 ± 18 MΩ, n = 14; p = 0.92). Similarly, the resting membrane potential was equalized in the presence of ZD7288 (dorsal: −68.0 ± 0.8 mV, n = 15; ventral: −67.2 ± 0.8 mV, n = 14; p = 0.51).
Consistent with the minimal/absent resonance, at PN5, the amplitude of Ih was small and with slow kinetics in somata (n = 7, at −140 mV, 120 ± 20 pA; at −90 mV, 31 ± 2 pA; V1/2 = −103.3 ± 2.7 mV; τfast 74 ± 6 ms; τslow 402 ± 48 ms).
Identical resonance/phase responses and Ih properties in proximal dendrites of dorsal and ventral cells
Resonance shows a somatodendritic gradient in adult CA1 pyramidal cells (Narayanan and Johnston, 2007; Marcelin et al., 2009). Dendritic recordings were attempted at PN11–12, the earliest time point when it was technically feasible far away enough (around 130 μm, i.e., in stratum radiatum) from the soma (Table 2). Resonance and phase responses were similar in dorsal (n = 19) and ventral (n = 15) dendrites (Table 2; Fig. 3B, ANOVA p = 0.59 for Fres, p = 0.79 for Q, p > 0.6 for both Fφ and ΦL). Resonance was statistically larger in somata than in dendrites of dorsal cells (Fig. 1B), but similar in ventral cells (ANOVA for Fres, p = 0.43; for Q, p = 0.91). In dendrites, Ih properties were similar in the ventral and dorsal cells (Table 2; Fig. 5B; ANOVA p > 0.22 for all parameters).
Properties of HCN channels in somata and dendrites
In the previous sections, we characterized Ih properties using whole-cell recordings because we wanted to measure both Ih and resonance in the same cell enabling their correlation (Fig. 5C). However, whole-cell recordings provide only a rough estimate of channel distribution and properties. We thus performed cell-attached recordings of CA1 pyramidal cell somata and dendrites at PN11–12. Ih current density was larger and V1/2 more depolarized in dorsal (n = 8) than ventral (n = 8) somata (Table 3; Fig. 6) (3.8 ± 0.5 pA/μm2 vs 1.9 ± 0.5 pA/μm2, p < 0.015; V1/2 = −99.2 ± 1.8 mV vs V1/2 = −109.9 ± 2.7 mV, p < 0.003). In proximal dendrites (dorsal, 126 ± 8 μm, n = 5; ventral, 145 ± 10 μm, n = 6), there was no difference in Ih current density and V1/2 (Table 3; Fig. 6) (dorsal: 4.7 ± 0.3 pA/μm2, V1/2 = −97.9 ± 5.6 mV; ventral: 4.8 ± 1.3 pA/μm2, V1/2 = −101.6 ± 5.3 mV; p > 0.4 for both). These results are consistent with the differences found with whole-cell recordings.
Table 3.
Recording distance from the soma (for dendritic recordings) and Ih parameters (current density, V1/2, τ) of dendrites and somata in dorsal and ventral cells for cell attached recordings at PN11–12, as well as for dendrites recorded at PN14–15
| Dorsal dendrite PN11–12 (n = 5) | Ventral dendrite PN11–12 (n = 6) | Dorsal soma PN11–12 (n = 8) | Ventral soma PN11–12 (n = 8) | Dorsal dendrite PN14–15 (n = 9) | Ventral dendrite PN14–15 (n = 7) | |
|---|---|---|---|---|---|---|
| Distance (μm) | 126 ± 8 | 145 ± 10 | 228 ± 10 | 234 ± 7 | ||
| Current density (pA/μm2) | 4.7 ± 0.3 | 4.8 ± 1.3 | 3.8 ± 0.5 | 1.9 ± 0.5** | 9.1 ± 0.8 | 7.2 ± 0.7* |
| V1/2 (mV) | −97.9 ± 5.6 | −101.6 ± 5.3 | −99.2 ± 1.8 | −109.9 ± 2.7*** | −101.6 ± 2.6 | −109.9 ± 2.9* |
| τ (ms) | 23.6 ± 1.8 | 33.4 ± 1.4** | 23.6 ± 1.6 | 35.5 ± 2.2** | 21.9 ± 1.9 | 28.4 ± 2.5* |
*p < 0.05;
**p < 0.01;
***p < 0.001 (ventral vs dorsal).
Figure 6.
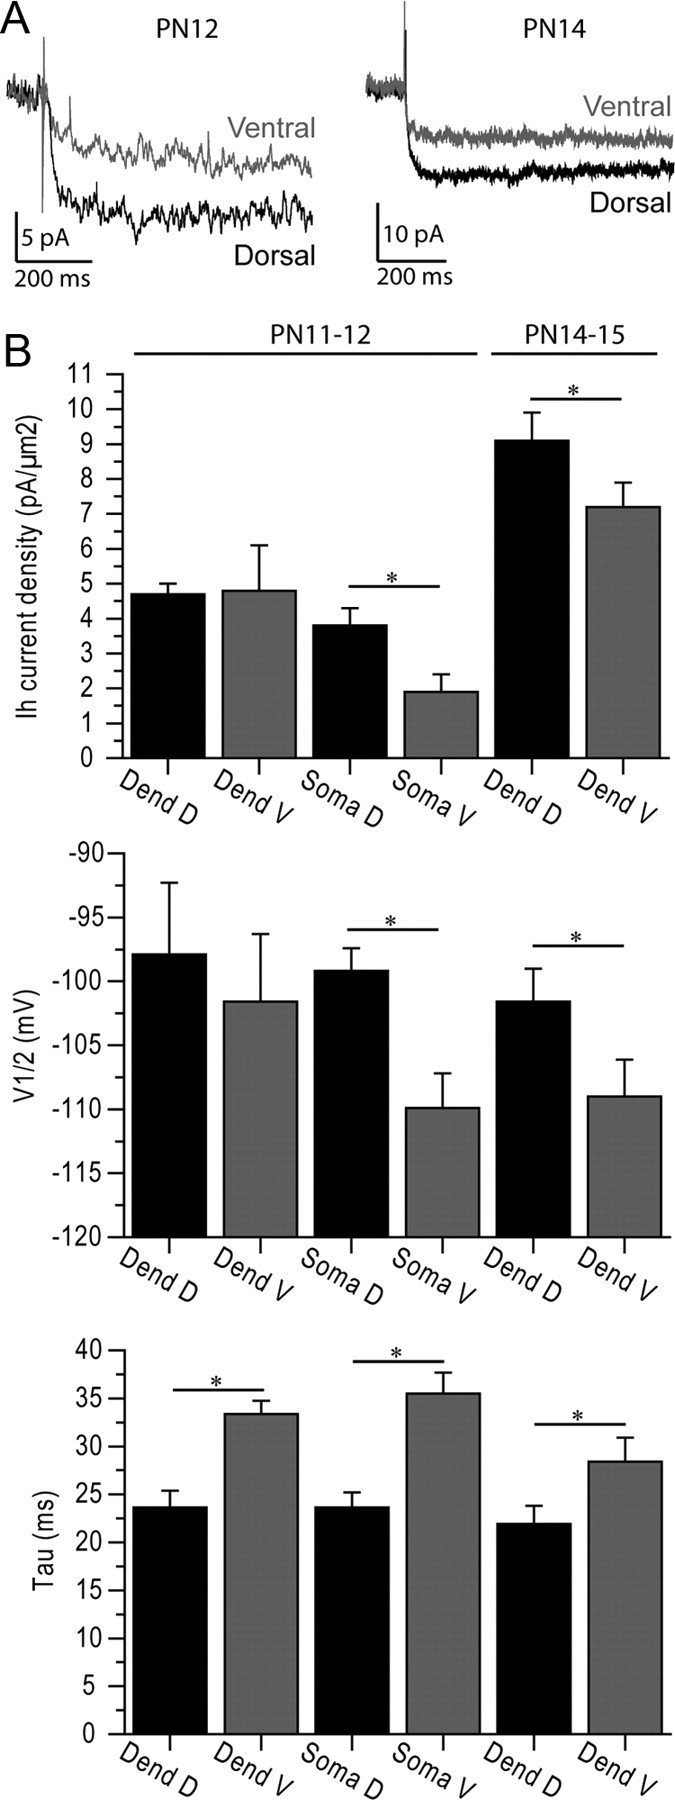
Ih properties measured with cell-attached recordings. A, Left, Examples of Ih activation using cell-attached recordings of a dorsal and ventral soma at PN12. Right, Examples of Ih activation using cell-attached recordings of a dorsal (250 μm from the soma) and ventral (260 μm from the soma) dendrite at PN14. Channel currents are larger in the dorsal part of the hippocampus. B, Summary histograms of Ih current density, V1/2 and τ in somata and dendrites recorded at PN11–12, and in dendrites at PN14–15. Somatic recordings revealed larger Ih with faster kinetics in dorsal than ventral somata at PN11–12. In contrast, dendritic values were not different apart from the activation time constant. The lack of difference may due to the fact that only proximal recordings (around 130 μm) could be performed at that stage of development. The difference in the dendrites became significant at PN14–15, as recordings could be performed around 230 μm. *p < 0.05.
In adult animals, Ih and resonance increase in the dendrites with the distance from the soma and become significantly different from the soma around 200 μm (Magee, 1998; Narayanan and Johnston, 2007; Hu et al., 2009). At PN11–12, dendrites were too thin to be recorded past 150 μm. We thus performed cell-attached dendritic recordings a few days later, at PN14–15, a developmental stage when dendrites could be followed in distal stratum radiatum close to the lacunosum moleculare border (dorsal, 228 ± 10 μm, n = 9; ventral, 234 ± 7 μm, n = 7). Cell-attached recordings revealed that Ih density was larger, V1/2 more positive and the activation time constant faster in dorsal than ventral cells (Table 3; Fig. 6) (dorsal: 9.1 ± 0.8 pA/μm2, V1/2 = −101.6 ± 2.6 mV, τ = 21.9 ± 1.9 ms; ventral: 7.2 ± 0.7 pA/μm2, V1/2 = −109.0 ± 3.3 mV, τ = 28.4 ± 2.5 ms). For these recordings, we had to use high-resistance fine-tip electrodes, which prevented us from performing stable whole-cell recordings to measure resonance. We conclude that distal dendrites of dorsal cells express a higher density of HCN channels than dendrites of ventral cells.
To determine the molecular correlates of these spatial gradients of Ih properties, we analyzed the dorsoventral pattern of expression of HCN1 and HCN2 subunits, the two major contributors to hippocampal Ih (Ludwig et al., 2003; Nolan et al., 2004; Surges et al., 2006; Brewster et al., 2007) at mRNA and protein levels, and at several levels of resolution.
Increased levels of HCN1, HCN2, and TRIP8b in dorsal hippocampus
Using RT-PCR, we did not find differences in HCN1 and HCN2 mRNA levels between ventral and dorsal hippocampus (Fig. 7A, n = 4). Western blot analyses revealed increased levels of HCN1 and HCN2 protein in dorsal as compared with ventral hippocampus (Fig. 7B, expressed as a fraction of ventral hippocampal levels, HCN1: dorsal 1.38 ± 0.04, ventral 1.00 ± 0.16, p < 0.04; HCN2: dorsal 2.39 ± 0.22, ventral 1.00 ± 0.18, p < 0.0006). ICC, enabling visualization of the cellular origin and subcellular distribution of HCN1, revealed a clear dorsoventral gradient of this channel (Fig. 8). When the optical density of the HCN1 signal was quantified per that of the dendritic marker MAP2 (Fig. 8), increased density of HCN1/dendrite was found in dorsal versus ventral hippocampus. Remarkably, this dorsal augmentation was confined to the distal dendritic fields in stratum lacunosum moleculare (Fig. 8), in keeping with the electrophysiology data (Fig. 6).
Figure 7.

HCN subunit and TRIP8b dorsoventral differential distribution as a molecular substrate for the larger Ih amplitude in dorsal versus ventral somata. A, RT-PCR did not reveal dorsoventral differences for HCN1 and HCN2 mRNA. B, HCN1, HCN2, and TRIP8b protein levels from Western blots (left) demonstrate that HCN1, HCN2, and TRIP8b protein levels are significantly larger in dorsal than ventral hippocampus (right). *p < 0.05; **p < 0.01. Student's t test. Error bars represent SEM.
Figure 8.
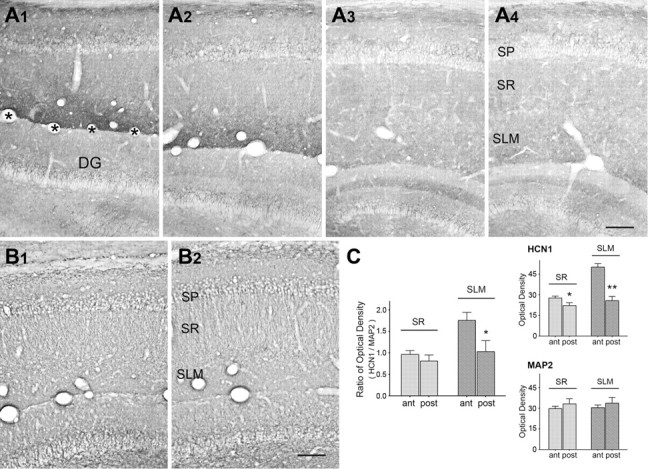
Dorsoventral gradient of dendritic HCN1 channels along developing hippocampal CA1. A, In the developing hippocampus (P12), HCN1 channels are localized in the dendritic field of CA1 pyramidal cells including strata radiatum (SR) and lacunosum moleculare (SLM). The HCN1 immunoreactivity is higher in the dorsal level (A1, bregma: ∼−3.0 mm), then decreases gradually along the dorsoventral hippocampal axis (A4, bregma: ∼+6.6 mm). B, The immunoreactivity of dendritic marker MAP2 in the dorsal hippocampal CA1 (B1, bregma: ∼−3.8 mm) as well as in the ventral level (B2, bregma: ∼+6.6 mm). C, Quantitative analysis of HCN1 and MAP2 immunoreactivity in SR and SLM. For each area, 12 matched sections from 4 brains (3 sections/area/brain) were analyzed, and optical density was calibrated by subtracting the density of the corpus callosum (white matter background value). Adjacent sections were used for HCN1 and MAP2. Two-way repeated-measures ANOVA was used, followed by Bonferroni's post hoc comparison. *p < 0.05; **p < 0.01. SP, stratum pyramidale; DG, dentate gyrus. Asterisks demarcate the hippocampal fissure. Scale bars, 100 μm.
Increased TRIP8b levels in the ventral hippocampus
Increased HCN protein levels are consistent with increased Ih amplitude in dorsal cell somata and dendrites. However, additional factors, including interactions with auxiliary proteins such as TRIP8b, influence Ih properties (Santoro et al., 2004; Lewis et al., 2009; Zolles et al., 2009). TRIP8b was increased fivefold in the dorsal as compared with the ventral hippocampus (Fig. 7B; dorsal 5.00 ± 0.87, ventral 1.00 ± 0.32, p < 0.002). Because TRIP8b inhibits cAMP modulation of Ih (Zolles et al., 2009), we predicted that HCN-dependent properties would be more sensitive to cAMP modulation in ventral than dorsal cells, where TRIP8b levels are higher.
Ih and resonance show increased sensitivity to cAMP in the ventral hippocampus
Intracellular application of 10 μm cAMP increased resonance in ventral cells (Fig. 9A; n = 8, Fres 3.7 ± 0.2 Hz before cAMP, 4.3 ± 0.2 Hz after cAMP; Q 1.13 ± 0.01 before, 1.19 ± 0.01 after); Ih amplitude (Fig. 9B; at −140 mV, 256 ± 23 pA before, 379 ± 42 pA after; at −90 mV, 119 ± 16 pA before, 188 ± 17 pA after), shifted V1/2 by 9 mV toward more depolarized values (Fig. 9B; −91.2 ± 1.2 mV before, −82.5 ± 1.9 mV after) and decreased the fast activation time constant (Fig. 9B; τfast, 28 ± 1 ms before, 23 ± 2 ms after; τslow, 225 ± 28 ms before, 215 ± 27 ms after). In dorsal cells (Fig. 9; n = 15), apart from a significant shift of V1/2, there were no statistically significant modifications in the other parameters (Ih amplitude at −140 mV, 313 ± 25 pA before, 304 ± 30 pA after; at −90 mV, 150 ± 11 pA before, 159 ± 16 pA after; V1/2 −88.9 ± 0.7 mV before, −82.5 ± 1.7 mV after; τfast, 17 ± 2 ms before, 19 ± 1 ms after; τslow, 195 ± 27 ms before, 168 ± 22 ms after; Fres 4.4 ± 0.2 Hz before, 4.3 ± 0.2 Hz after; Q 1.27 ± 0.02 before, 1.25 ± 0.03 after; paired t test p > 0.4 for all parameters, except for V1/2 for which p < 0.005).
Figure 9.

Application of cAMP increases Ih amplitude and kinetics and resonance in ventral somata. A, Impedance curve before and after cAMP in a ventral cell. Histograms show the increase of Fres and Q following cAMP application in ventral, but not dorsal cells. B, Example of the effect of cAMP on Ih current and activation curve in the same cell as in (A). Histograms of Ih current properties before and after cAMP. Note the increase in amplitude and faster kinetics in ventral, but not dorsal cells. C, Temporal summation was decreased by cAMP in ventral cells, but not in dorsal cells. *p < 0.05; **p < 0.01; ***p < 0.001 (paired t test). D, dorsal; V, ventral.
Finally, cAMP decreased temporal summation of EPSPs in ventral cells (Fig. 9C; at 25 Hz, before cAMP 7 ± 3%, after cAMP 0 ± 1%; at 50 Hz, before 72 ± 5%, after 60 ± 4, n = 12) but not in dorsal cells (Fig. 9C; at 25 Hz, before −3 ± 1%, after −4 ± 2%; at 50 Hz, before 41 ± 4%, after 45 ± 4%, n = 14). Addition of ZD7288 at the end of the experiment equalized temporal summation in dorsal and ventral cells (at 25 Hz, dorsal 58 ± 8%, n = 6; ventral 57 ± 23%, n = 4; at 50 Hz, dorsal 140 ± 26%, n = 6; ventral 151 ± 25%, n = 4, data not shown).
Discussion
Our results reveal a dorsoventral gradient during the second postnatal week, characterized by augmented resonance and Ih and lower temporal summation in dorsal than ventral cells. This indicates an early and fine-tuned orchestration of hippocampal organization. Regulated molecular programs of HCN1/2 and TRIP8b expression seem to contribute to this organization.
The 3D organization of the medial entorhinal cortex allows the functional mapping of stellate cells along the dorsoventral axis. The curvature of the hippocampus prevents such an approach, since dendritic recordings require a complete preservation of the cell, which is obtained in one or two slices per hemisphere, hence the use of dorsal and ventral slices in this study. The hippocampus develops in a dorsoventral gradient (Bayer, 1980). Dorsal cells could thus be more mature than ventral ones at PN11–12. However, the morphological characteristics of the recorded cells were similar in the dorsal and ventral hippocampus.
Results obtained in young (present study) and adult animals (Narayanan and Johnston, 2007; Marcelin et al., 2009) show that resonance increases with age in CA1 pyramidal cells, in parallel with the frequency of theta rhythm recorded in vivo (Leblanc and Bland, 1979). At PN5–6, there is no resonance and no proper theta oscillations in vivo. At PN11, Fres ≈ 4 Hz, and theta frequency is 3.4–3.9 Hz in vivo; whereas in adult animals, Fres = 6–10 Hz along the somatodendritic axis, and theta frequency is 4–12 Hz. This does not necessarily imply that a causal relationship exists between resonance frequency and theta rhythm. We suggest that resonance parameters at the single cell level are tuned to the frequency generated at the network level. Interestingly, phase lead, which may be important for phase precession (Narayanan and Johnston, 2008; Marcelin et al., 2009), was below the theta frequency range at PN11–12, but in the theta range in adult animals (Narayanan and Johnston, 2008; Marcelin et al., 2009). This may be related to the fact that animals poorly actively explore their environment at PN11–12. In adult animals, resonance is much stronger in both hippocampus (Narayanan and Johnston, 2007; Marcelin et al., 2009) and entorhinal cortex (Giocomo et al., 2007; Garden et al., 2008; Giocomo and Hasselmo, 2008; Boehlen et al., 2010).
Resonance and phase responses were larger, and temporal summation smaller, in dorsal than ventral somata, suggesting that CA1 principal cells process information differently along the dorsoventral axis. Whether such topological arrangement plays a role in the dorsoventral expansion of place fields remains to be determined. The differences in Ih properties are sufficient to account for the differences in resonance and temporal summation between dorsal and ventral cells, since a decrease in Ih amplitude and/or availability decreases resonance and increases temporal summation (Narayanan and Johnston, 2007; Marcelin et al., 2009). The developmental profile of Ih properties is similar to the developmental profile of resonance, as at early stages Ih has slow kinetics and small amplitude (Surges et al., 2006), leading to a lack of resonance. Interestingly, dentate granule cells do not appear to express Ih at early stages (Stabel et al., 1992). The spatial profile of resonance, temporal summation, and Ih in CA1 pyramidal cells is thus similar to that found in stellate cells of the entorhinal cortex (Giocomo et al., 2007; Garden et al., 2008; Giocomo and Hasselmo, 2008; Boehlen et al., 2010). In our conditions (−70 mV), resonance and temporal coding were Ih dependent. Near firing threshold, resonance involves other sets of channels, in particular IM and INaP (Hutcheon and Yarom, 2000; Hu et al., 2009). The dorsoventral distributions of IM and INaP remain to be assessed.
At PN11–12, Ih and resonance properties were not larger in dendrites than in somata. Since dendritic recordings could not be performed farther than 125 μm away from the soma and since resonance and Ih starts to increase farther than 150 μm in adult animals (Magee, 1998; Narayanan and Johnston, 2007), we may have not recorded far enough to see a difference. However, dendritic recordings performed far enough from the soma at PN14–15 revealed a clear difference between the dorsal and ventral part of the hippocampus.
Our attempt to find molecular correlates revealed an increased expression of HCN1 and TRIP8b in dorsal hippocampus, which could account for larger Ih current and decreased cAMP sensitivity in dorsal cells (Santoro et al., 2004; Lewis et al., 2009; Zolles et al., 2009). Interestingly, cAMP shifted V1/2 but not the amplitude of Ih in dorsal cells. The shift of V1/2 by cAMP was not sufficient to change resonance, as predicted by modeling (Narayanan and Johnston, 2007). In contrast, cAMP increased resonance and decreased temporal summation in ventral somata. Such modulation could play an important role when cAMP levels are specifically increased in the ventral hippocampus during strong emotional conditions (Klamer et al., 2005). Relevant to this concept of functional segregation, resonance and Ih are differentially modulated by cholinergic inputs in stellate cells along the dorsoventral axis (Heys et al., 2010). Increased levels of HCN2 and TRIP8b in the dorsal hippocampus should have resulted in slower Ih kinetics in dorsal cells, in contrast to the present findings. Other putative modulators of Ih, including MiRP1 (Proenza et al., 2002), phosphoinositides (Zolles et al., 2006; Pian et al., 2007), and protein kinases (Poolos et al., 2006), might be involved. Their dorsoventral expression patterns remain to be assessed. The larger expression of HCN2 in the dorsal hippocampus should have resulted in a larger modulation by cAMP. The high expression of TRIP8b may play a role in this decreased sensitivity, a proposal that can be tested in TRIP8b-lacking animals.
To conclude, our data support the concept that physiological architecture is tuned to the information to be processed (Giocomo et al., 2007; Garden et al., 2008). We propose the existence of organizational rules linking resonance, Ih, and perhaps theta oscillations (although causality between these phenomena remains to be established). Given the similarity of the spatial and temporal profiles of these parameters in stellate cells and CA1 pyramidal cells, we propose that the developmental programs controlling these parameters may be shared by the entorhinal cortex and the hippocampus, two structures processing complementary features of the environment.
Footnotes
This work was supported by INSERM, ANR ANTARES, and MINOS grants, EPICURE (C.B. and A.B.), National Institutes of Health (NIH) 1F30NS064757 (A.S.L.) and 1K02NS05595 and 1R01NS059934 (D.M.C.), T32 04450 (S.M), and R37 NS35439 (T.Z.B). We thank M.-P. Nesa and A. Ghestem for technical help. B.M. was supported by CIFRE contract with Elekta.
The authors declare no competing financial interests.
References
- Bayer, 1980.Bayer SA. Development of the hippocampal region in the rat. II. Morphogenesis during embryonic and early postnatal life. J Comp Neurol. 1980;190:115–134. doi: 10.1002/cne.901900108. [DOI] [PubMed] [Google Scholar]
- Bender et al., 2001.Bender RA, Brewster A, Santoro B, Ludwig A, Hofmann F, Biel M, Baram TZ. Differential and age-dependent expression of hyperpolarization-activated, cyclic nucleotide-gated cation channel isoforms 1–4 suggests evolving roles in the developing rat hippocampus. Neuroscience. 2001;106:689–698. doi: 10.1016/s0306-4522(01)00314-1. [DOI] [PMC free article] [PubMed] [Google Scholar]
- Bender et al., 2005.Bender RA, Galindo R, Mameli M, Gonzalez-Vega R, Valenzuela CF, Baram TZ. Synchronized network activity in developing rat hippocampus involves regional hyperpolarization-activated cyclic nucleotide-gated (HCN) channel function. Eur J Neurosci. 2005;22:2669–2674. doi: 10.1111/j.1460-9568.2005.04407.x. [DOI] [PMC free article] [PubMed] [Google Scholar]
- Bender et al., 2007.Bender RA, Kirschstein T, Kretz O, Brewster AL, Richichi C, Rüschenschmidt C, Shigemoto R, Beck H, Frotscher M, Baram TZ. Localization of HCN1 channels to presynaptic compartments: novel plasticity that may contribute to hippocampal maturation. J Neurosci. 2007;27:4697–4706. doi: 10.1523/JNEUROSCI.4699-06.2007. [DOI] [PMC free article] [PubMed] [Google Scholar]
- Bernard et al., 2004.Bernard C, Anderson A, Becker A, Poolos NP, Beck H, Johnston D. Acquired dendritic channelopathy in temporal lobe epilepsy. Science. 2004;305:532–535. doi: 10.1126/science.1097065. [DOI] [PubMed] [Google Scholar]
- Boehlen et al., 2010.Boehlen A, Heinemann U, Erchova I. The range of intrinsic frequencies represented by medial entorhinal cortex stellate cells extends with age. J Neurosci. 2010;30:4585–4589. doi: 10.1523/JNEUROSCI.4939-09.2010. [DOI] [PMC free article] [PubMed] [Google Scholar]
- Brewster et al., 2007.Brewster AL, Chen Y, Bender RA, Yeh A, Shigemoto R, Baram TZ. Quantitative analysis and subcellular distribution of mRNA and protein expression of the hyperpolarization-activated cyclic nucleotide-gated channels throughout development in rat hippocampus. Cereb Cortex. 2007;17:702–712. doi: 10.1093/cercor/bhk021. [DOI] [PMC free article] [PubMed] [Google Scholar]
- Burton et al., 2008.Burton BG, Economo MN, Lee GJ, White JA. Development of theta rhythmicity in entorhinal stellate cells of the juvenile rat. J Neurophysiol. 2008;100:3144–3157. doi: 10.1152/jn.90424.2008. [DOI] [PMC free article] [PubMed] [Google Scholar]
- Chen et al., 2001.Chen Y, Bender RA, Frotscher M, Baram TZ. Novel and transient populations of corticotropin-releasing hormone-expressing neurons in developing hippocampus suggest unique functional roles: a quantitative spatiotemporal analysis. J Neurosci. 2001;21:7171–7181. doi: 10.1523/JNEUROSCI.21-18-07171.2001. [DOI] [PMC free article] [PubMed] [Google Scholar]
- Dong et al., 2009.Dong HW, Swanson LW, Chen L, Fanselow MS, Toga AW. Genomic-anatomic evidence for distinct functional domains in hippocampal field CA1. Proc Natl Acad Sci U S A. 2009;106:11794–11799. doi: 10.1073/pnas.0812608106. [DOI] [PMC free article] [PubMed] [Google Scholar]
- Esclapez et al., 1999.Esclapez M, Hirsch JC, Ben-Ari Y, Bernard C. Newly formed excitatory pathways provide a substrate for hyperexcitability in experimental temporal lobe epilepsy. J Comp Neurol. 1999;408:449–460. doi: 10.1002/(sici)1096-9861(19990614)408:4<449::aid-cne1>3.0.co;2-r. [DOI] [PubMed] [Google Scholar]
- Fanselow and Dong, 2010.Fanselow MS, Dong HW. Are the dorsal and ventral hippocampus functionally distinct structures? Neuron. 2010;65:7–19. doi: 10.1016/j.neuron.2009.11.031. [DOI] [PMC free article] [PubMed] [Google Scholar]
- Fink et al., 1998.Fink L, Seeger W, Ermert L, Hänze J, Stahl U, Grimminger F, Kummer W, Bohle RM. Real-time quantitative RT-PCR after laser-assisted cell picking. Nat Med. 1998;4:1329–1333. doi: 10.1038/3327. [DOI] [PubMed] [Google Scholar]
- Garden et al., 2008.Garden DL, Dodson PD, O'Donnell C, White MD, Nolan MF. Tuning of synaptic integration in the medial entorhinal cortex to the organization of grid cell firing fields. Neuron. 2008;60:875–889. doi: 10.1016/j.neuron.2008.10.044. [DOI] [PubMed] [Google Scholar]
- Giocomo and Hasselmo, 2008.Giocomo LM, Hasselmo ME. Time constants of h current in layer ii stellate cells differ along the dorsal to ventral axis of medial entorhinal cortex. J Neurosci. 2008;28:9414–9425. doi: 10.1523/JNEUROSCI.3196-08.2008. [DOI] [PMC free article] [PubMed] [Google Scholar]
- Giocomo et al., 2007.Giocomo LM, Zilli EA, Fransén E, Hasselmo ME. Temporal frequency of subthreshold oscillations scales with entorhinal grid cell field spacing. Science. 2007;315:1719–1722. doi: 10.1126/science.1139207. [DOI] [PMC free article] [PubMed] [Google Scholar]
- Heys et al., 2010.Heys JG, Giocomo LM, Hasselmo ME. Cholinergic modulation of the resonance properties of stellate cells in layer II of medial entorhinal cortex. J Neurophysiol. 2010;104:258–270. doi: 10.1152/jn.00492.2009. [DOI] [PMC free article] [PubMed] [Google Scholar]
- Hines and Carnevale, 1997.Hines ML, Carnevale NT. The NEURON simulation environment. Neural Comput. 1997;9:1179–1209. doi: 10.1162/neco.1997.9.6.1179. [DOI] [PubMed] [Google Scholar]
- Hu et al., 2002.Hu H, Vervaeke K, Storm JF. Two forms of electrical resonance at theta frequencies, generated by M-current, h-current and persistent Na+ current in rat hippocampal pyramidal cells. J Physiol. 2002;545:783–805. doi: 10.1113/jphysiol.2002.029249. [DOI] [PMC free article] [PubMed] [Google Scholar]
- Hu et al., 2009.Hu H, Vervaeke K, Graham LJ, Storm JF. Complementary theta resonance filtering by two spatially segregated mechanisms in CA1 hippocampal pyramidal neurons. J Neurosci. 2009;29:14472–14483. doi: 10.1523/JNEUROSCI.0187-09.2009. [DOI] [PMC free article] [PubMed] [Google Scholar]
- Hutcheon and Yarom, 2000.Hutcheon B, Yarom Y. Resonance, oscillation and the intrinsic frequency preferences of neurons. Trends Neurosci. 2000;23:216–222. doi: 10.1016/s0166-2236(00)01547-2. [DOI] [PubMed] [Google Scholar]
- Jung et al., 2011.Jung S, Warner LN, Pitsch J, Becker AJ, Poolos NP. Rapid loss of dendritic HCN channel expression in hippocampal pyramidal neurons following status epilepticus. J Neurosci. 2011;31:14291–14295. doi: 10.1523/JNEUROSCI.1148-11.2011. [DOI] [PMC free article] [PubMed] [Google Scholar]
- Kjelstrup et al., 2008.Kjelstrup KB, Solstad T, Brun VH, Hafting T, Leutgeb S, Witter MP, Moser EI, Moser MB. Finite scale of spatial representation in the hippocampus. Science. 2008;321:140–143. doi: 10.1126/science.1157086. [DOI] [PubMed] [Google Scholar]
- Klamer et al., 2005.Klamer D, Palsson E, Fejgin K, Zhang J, Engel JA, Svensson L. Activation of a nitric-oxide-sensitive cAMP pathway with phencyclidine: elevated hippocampal cAMP levels are temporally associated with deficits in prepulse inhibition. Psychopharmacology (Berl) 2005;179:479–488. doi: 10.1007/s00213-004-2051-z. [DOI] [PubMed] [Google Scholar]
- Langston et al., 2010.Langston RF, Ainge JA, Couey JJ, Canto CB, Bjerknes TL, Witter MP, Moser EI, Moser MB. Development of the spatial representation system in the rat. Science. 2010;328:1576–1580. doi: 10.1126/science.1188210. [DOI] [PubMed] [Google Scholar]
- Leblanc and Bland, 1979.Leblanc MO, Bland BH. Developmental aspects of hippocampal electrical activity and motor behavior in the rat. Exp Neurol. 1979;66:220–237. doi: 10.1016/0014-4886(79)90076-1. [DOI] [PubMed] [Google Scholar]
- Lewis et al., 2009.Lewis AS, Schwartz E, Chan CS, Noam Y, Shin M, Wadman WJ, Surmeier DJ, Baram TZ, Macdonald RL, Chetkovich DM. Alternatively spliced isoforms of TRIP8b differentially control h channel trafficking and function. J Neurosci. 2009;29:6250–6265. doi: 10.1523/JNEUROSCI.0856-09.2009. [DOI] [PMC free article] [PubMed] [Google Scholar]
- Ludwig et al., 2003.Ludwig A, Budde T, Stieber J, Moosmang S, Wahl C, Holthoff K, Langebartels A, Wotjak C, Munsch T, Zong X, Feil S, Feil R, Lancel M, Chien KR, Konnerth A, Pape HC, Biel M, Hofmann F. Absence epilepsy and sinus dysrhythmia in mice lacking the pacemaker channel HCN2. EMBO J. 2003;22:216–224. doi: 10.1093/emboj/cdg032. [DOI] [PMC free article] [PubMed] [Google Scholar]
- Magee, 1998.Magee JC. Dendritic hyperpolarization-activated currents modify the integrative properties of hippocampal CA1 pyramidal neurons. J Neurosci. 1998;18:7613–7624. doi: 10.1523/JNEUROSCI.18-19-07613.1998. [DOI] [PMC free article] [PubMed] [Google Scholar]
- Marcelin et al., 2009.Marcelin B, Chauvière L, Becker A, Migliore M, Esclapez M, Bernard C. h channel-dependent deficit of theta oscillation resonance and phase shift in temporal lobe epilepsy. Neurobiol Dis. 2009;33:436–447. doi: 10.1016/j.nbd.2008.11.019. [DOI] [PubMed] [Google Scholar]
- Moser and Moser, 1998.Moser MB, Moser EI. Functional differentiation in the hippocampus. Hippocampus. 1998;8:608–619. doi: 10.1002/(SICI)1098-1063(1998)8:6<608::AID-HIPO3>3.0.CO;2-7. [DOI] [PubMed] [Google Scholar]
- Narayanan and Johnston, 2007.Narayanan R, Johnston D. Long-term potentiation in rat hippocampal neurons is accompanied by spatially widespread changes in intrinsic oscillatory dynamics and excitability. Neuron. 2007;56:1061–1075. doi: 10.1016/j.neuron.2007.10.033. [DOI] [PMC free article] [PubMed] [Google Scholar]
- Narayanan and Johnston, 2008.Narayanan R, Johnston D. The h channel mediates location dependence and plasticity of intrinsic phase response in rat hippocampal neurons. J Neurosci. 2008;28:5846–5860. doi: 10.1523/JNEUROSCI.0835-08.2008. [DOI] [PMC free article] [PubMed] [Google Scholar]
- Nolan et al., 2004.Nolan MF, Malleret G, Dudman JT, Buhl DL, Santoro B, Gibbs E, Vronskaya S, Buzsáki G, Siegelbaum SA, Kandel ER, Morozov A. A behavioral role for dendritic integration: HCN1 channels constrain spatial memory and plasticity at inputs to distal dendrites of CA1 pyramidal neurons. Cell. 2004;119:719–732. doi: 10.1016/j.cell.2004.11.020. [DOI] [PubMed] [Google Scholar]
- Nolan et al., 2007.Nolan MF, Dudman JT, Dodson PD, Santoro B. HCN1 channels control resting and active integrative properties of stellate cells from layer II of the entorhinal cortex. J Neurosci. 2007;27:12440–12451. doi: 10.1523/JNEUROSCI.2358-07.2007. [DOI] [PMC free article] [PubMed] [Google Scholar]
- O'Keefe and Nadel, 1978.O'Keefe J, Nadel L. The hippocampus as a cognitive map. Oxford: Oxford UP; 1978. [Google Scholar]
- Pian et al., 2007.Pian P, Bucchi A, Decostanzo A, Robinson RB, Siegelbaum SA. Modulation of cyclic nucleotide-regulated HCN channels by PIP(2) and receptors coupled to phospholipase C. Pflugers Arch. 2007;455:125–145. doi: 10.1007/s00424-007-0295-2. [DOI] [PubMed] [Google Scholar]
- Pike et al., 2000.Pike FG, Goddard RS, Suckling JM, Ganter P, Kasthuri N, Paulsen O. Distinct frequency preferences of different types of rat hippocampal neurones in response to oscillatory input currents. J Physiol 529 Pt. 2000;1:205–213. doi: 10.1111/j.1469-7793.2000.00205.x. [DOI] [PMC free article] [PubMed] [Google Scholar]
- Poolos et al., 2006.Poolos NP, Bullis JB, Roth MK. Modulation of h-channels in hippocampal pyramidal neurons by p38 mitogen-activated protein kinase. J Neurosci. 2006;26:7995–8003. doi: 10.1523/JNEUROSCI.2069-06.2006. [DOI] [PMC free article] [PubMed] [Google Scholar]
- Proenza et al., 2002.Proenza C, Angoli D, Agranovich E, Macri V, Accili EA. Pacemaker channels produce an instantaneous current. J Biol Chem. 2002;277:5101–5109. doi: 10.1074/jbc.M106974200. [DOI] [PubMed] [Google Scholar]
- Santoro et al., 2004.Santoro B, Wainger BJ, Siegelbaum SA. Regulation of HCN channel surface expression by a novel C-terminal protein-protein interaction. J Neurosci. 2004;24:10750–10762. doi: 10.1523/JNEUROSCI.3300-04.2004. [DOI] [PMC free article] [PubMed] [Google Scholar]
- Sargolini et al., 2006.Sargolini F, Fyhn M, Hafting T, McNaughton BL, Witter MP, Moser MB, Moser EI. Conjunctive representation of position, direction, and velocity in entorhinal cortex. Science. 2006;312:758–762. doi: 10.1126/science.1125572. [DOI] [PubMed] [Google Scholar]
- Shin and Chetkovich, 2007.Shin M, Chetkovich DM. Activity-dependent regulation of h channel distribution in hippocampal CA1 pyramidal neurons. J Biol Chem. 2007;282:33168–33180. doi: 10.1074/jbc.M703736200. [DOI] [PMC free article] [PubMed] [Google Scholar]
- Shin et al., 2006.Shin M, Simkin D, Suyeoka GM, Chetkovich DM. Evaluation of HCN2 abnormalities as a cause of juvenile audiogenic seizures in Black Swiss mice. Brain Res. 2006;1083:14–20. doi: 10.1016/j.brainres.2006.01.102. [DOI] [PubMed] [Google Scholar]
- Stabel et al., 1992.Stabel J, Ficker E, Heinemann U. Young CA1 pyramidal cells of rats, but not dentate gyrus granule cells, express a delayed inward rectifying current with properties of IQ. Neurosci Lett. 1992;135:231–234. doi: 10.1016/0304-3940(92)90443-b. [DOI] [PubMed] [Google Scholar]
- Surges et al., 2006.Surges R, Brewster AL, Bender RA, Beck H, Feuerstein TJ, Baram TZ. Regulated expression of HCN channels and cAMP levels shape the properties of the h current in developing rat hippocampus. Eur J Neurosci. 2006;24:94–104. doi: 10.1111/j.1460-9568.2006.04880.x. [DOI] [PMC free article] [PubMed] [Google Scholar]
- Swanson et al., 1978.Swanson LW, Wyss JM, Cowan WM. An autoradiographic study of the organization of intrahippocampal association pathways in the rat. J Comp Neurol. 1978;181:681–715. doi: 10.1002/cne.901810402. [DOI] [PubMed] [Google Scholar]
- Thompson et al., 2008.Thompson CL, Pathak SD, Jeromin A, Ng LL, MacPherson CR, Mortrud MT, Cusick A, Riley ZL, Sunkin SM, Bernard A, Puchalski RB, Gage FH, Jones AR, Bajic VB, Hawrylycz MJ, Lein ES. Genomic anatomy of the hippocampus. Neuron. 2008;60:1010–1021. doi: 10.1016/j.neuron.2008.12.008. [DOI] [PubMed] [Google Scholar]
- Vasilyev and Barish, 2002.Vasilyev DV, Barish ME. Postnatal development of the hyperpolarization-activated excitatory current Ih in mouse hippocampal pyramidal neurons. J Neurosci. 2002;22:8992–9004. doi: 10.1523/JNEUROSCI.22-20-08992.2002. [DOI] [PMC free article] [PubMed] [Google Scholar]
- Wills et al., 2010.Wills TJ, Cacucci F, Burgess N, O'Keefe J. Development of the hippocampal cognitive map in preweanling rats. Science. 2010;328:1573–1576. doi: 10.1126/science.1188224. [DOI] [PMC free article] [PubMed] [Google Scholar]
- Yoshida et al., 2011.Yoshida M, Giocomo LM, Boardman I, Hasselmo ME. Frequency of subthreshold oscillations at different membrane potential voltages in neurons at different anatomical positions on the dorsoventral axis in the rat medial entorhinal cortex. J Neurosci. 2011;31:12683–12694. doi: 10.1523/JNEUROSCI.1654-11.2011. [DOI] [PMC free article] [PubMed] [Google Scholar]
- Zolles et al., 2006.Zolles G, Klöcker N, Wenzel D, Weisser-Thomas J, Fleischmann BK, Roeper J, Fakler B. Pacemaking by HCN channels requires interaction with phosphoinositides. Neuron. 2006;52:1027–1036. doi: 10.1016/j.neuron.2006.12.005. [DOI] [PubMed] [Google Scholar]
- Zolles et al., 2009.Zolles G, Wenzel D, Bildl W, Schulte U, Hofmann A, Müller CS, Thumfart JO, Vlachos A, Deller T, Pfeifer A, Fleischmann BK, Roeper J, Fakler B, Klöcker N. Association with the auxiliary subunit PEX5R/Trip8b controls responsiveness of HCN channels to cAMP and adrenergic stimulation. Neuron. 2009;62:814–825. doi: 10.1016/j.neuron.2009.05.008. [DOI] [PubMed] [Google Scholar]