

Abstract
Systemic lupus erythematosus (SLE) is a chronic heterogeneous autoimmune disorder characterized by the loss of tolerance to self-antigens and dysregulated interferon responses. The etiology of SLE is complex, involving both heritable and environmental factors. Candidate-gene studies and genome-wide association (GWA) scans have been successful in identifying new loci that contribute to disease susceptibility; however, much of the heritable risk has yet to be identified. In this study, we sought to replicate 1,580 variants showing suggestive association with SLE in a previously published GWA scan of European Americans; we tested a multiethnic population consisting of 7,998 SLE cases and 7,492 controls of European, African American, Asian, Hispanic, Gullah, and Amerindian ancestry to find association with the disease. Several genes relevant to immunological pathways showed association with SLE. Three loci exceeded the genome-wide significance threshold: interferon regulatory factor 8 (IRF8; rs11644034; pmeta-Euro = 2.08 × 10⁻¹⁰), transmembrane protein 39A (TMEM39A; rs1132200; pmeta-all = 8.62 × 10⁻⁹), and 17q21 (rs1453560; pmeta-all = 3.48 × 10⁻¹⁰) between IKAROS family of zinc finger 3 (AIOLOS; IKZF3) and zona pellucida binding protein 2 (ZPBP2). Fine mapping, resequencing, imputation, and haplotype analysis of IRF8 indicated that three independent effects tagged by rs8046526, rs450443, and rs4843869, respectively, were required for risk in individuals of European ancestry. Eleven additional replicated effects (5 × 10⁻⁸ < pmeta-Euro < 9.99 × 10⁻⁵) were observed with CFHR1, CADM2, LOC730109/IL12A, LPP, LOC63920, SLU7, ADAMTSL1, C10orf64, OR8D4, FAM19A2, and STXBP6. The results of this study increase the number of confirmed SLE risk loci and identify others warranting further investigation.
Introduction
Systemic lupus erythematosus (SLE [MIM 152700]) is a chronic autoimmune disease that is classically characterized by inflammation, dysregulated type 1 interferon responses, and autoantibodies directed to the nuclear compartment. Women of childbearing age are preferentially affected at a rate nine times that of men, and those of African American and Asian ancestries are affected more frequently and manifest more severe disease than those of European ancestry.1 Although the etiology of SLE is largely unknown, its pathogenesis most likely involves a complex interplay between environmental (e.g., UV light, Epstein-Barr virus infection, etc.) and genetic (e.g., MHC, IRF5 [MIM 607218], etc.) components.2 A sibling risk ratio (λs) of approximately 30 in SLE illustrates a strong genetic component,3 and the fact that observational studies have identified many families with multiple cases of SLE and other autoimmune conditions suggests the potential for shared genetic predisposition.4–6
Candidate-gene studies and, more recently, genome-wide association (GWA) scans have been highly successful in identifying multiple susceptibility loci.2,7 The histocompatibility leukocyte antigen (HLA) region has been known to contribute to the risk of SLE and other related autoimmune diseases since the 1970s.8–11 In the early 2000s, gene expression studies determined that, compared to healthy controls, individuals with SLE overexpress genes in the interferon pathway.12–14 Association between SLE and variants in the region of IRF5 was first reported in 2005 and has since been replicated in most GWA scans of SLE.15–19 In 2008, four GWA scans of SLE cases of European descent were published, and the first GWA scan of Asian descent was published in 2009.16,17,19–21 Collectively, these studies have identified and confirmed ∼35 loci that contribute to the pathogenesis of SLE. These data highlight the importance of several pathways, including those involving lymphocyte activation and function, immune-complex clearance, innate immune response, and adaptive immune responses.2 However, a substantial portion of the heritable risk has yet to be identified.17,22 The lack of causal variants, rare variants, and/or other loci yet to be discovered might account for the missing heritability.
In an effort to identify regions contributing to SLE risk, we sought to replicate suggestive association signals in our previously published European American SLE GWA scan.19 We evaluated 1,580 single-nucleotide polymorphisms (SNPs) in an independent population of 7,998 SLE cases and 7,492 controls of European, African American, Asian, Hispanic, Gullah, and Amerindian ancestry (Tables S1–S3, available online). Three loci, interferon regulatory factor 8 (IRF8 [MIM 601565]), transmembrane protein 39A (TMEM39A), and the region between IKAROS family of zinc finger 3 (AIOLOS; IKZF3 [MIM 606221]) and zona pellucida binding protein 2 (ZPBP2 [MIM 608449]) exceeded the genome-wide significance threshold (p < 5 × 10⁻⁸). Through fine mapping, resequencing, and imputation of the IRF8 region, we identified three independent effects required for risk. Moreover, we replicated 11 other loci, several of which had been previously reported in related conditions.
Subjects and Methods
GWA Scan
Genotyping, quality control, procedures for data analysis, and summary statistics for the GWA scan were described previously in Graham et al., 2008.19
Study Design
The genotype data used in this study were generated as a part of a joint effort of more than 40 investigators from around the world. These investigators contributed samples, funding, and hypotheses on a combined array containing ∼35,000 SNPs (Figure S1). The Oklahoma Medical Research Foundation (OMRF) served as the coordinating center, ran the arrays, and sent the data to a central facility for quality control at Wake Forest Medical Center. These data were then distributed back to the investigators, who requested the SNPs for final analysis and publication.23–28
Subjects
The multiracial replication study consisted of 17,003 total samples (8,922 SLE cases and 8,077 controls) and included individuals of self-reported African American, Asian, European, Gullah, Hispanic, and Amerindian ancestry (Table S1). A total of 374 samples were common between the GWA scan and the replication study so that genotypes generated by the two platforms could be confirmed and so that genotypes of SNPs not present on the Affymetrix 5.0 array could be obtained. These data were only used as observed data for the imputation analysis of specific genomic regions, as described below; to maintain independence between the GWA scan and replication samples, we did not include the data generated on these shared samples in the replication or fine-mapping analyses. The OMRF gathered the samples from consenting subjects (according to the guidelines of the ethics committees at the respective institutions where the samples were collected) and prepared them for genotyping. All cases used in this study fulfilled at least 4 of the 11 American College of Rheumatology criteria for SLE, whereas the healthy, population-based controls did not have any family history of SLE or any other autoimmune disease.29
Genotyping and Sample Quality Control
A total of 1,580 SNPs that attained p < 0.05 in the previously published GWA scan were selected for replication. In addition, 287 SNPs (chosen to capture all variation with a minimum r2 threshold of 0.8 via the TAGGER algorithm in HAPLOVIEW30) within the IRF8 region and 347 ancestral-informative markers (AIMs) spanning the genome were genotyped. Genotyping of SNPs was performed at OMRF with Infinium chemistry on an Illumina iSelect custom array according to the manufacturer's protocol. The following quality-control procedures were implemented prior to the analysis (Table S2): there were well-defined clusters within the scatter plots, the SNP call rate was >90% across all samples genotyped, the minor allele frequency was >1%, the sample call rate was >90%, p > 0.05 for differential missingness between cases and controls, the total proportion missing was <5%, and the Hardy-Weinberg proportions were p > 0.01 in controls and p > 0.0001 in cases.
Samples exhibiting excess heterozygosity (>5 standard deviations [SDs] from the mean) or a <90% call rate were excluded from the analysis. The remaining individuals were examined for excessive allele sharing as estimated by identity-by-descent (IBD). In sample pairs with excess relatedness (IBD > 0.4), one individual was removed from the analysis on the basis of the following criteria: (1) remove the sample with the lower call rate, (2) remove the control and retain the case, (3) remove the male sample before the female sample, (4) remove the younger control before the older control, and (5) in a situation with two cases, remove the case with fewer phenotype data available. Discrepancies between self-reported and genetically determined gender were evaluated. Males were required to be heterozygous at rs2557523 (given that the G allele for this SNP is only observed on the Y chromosome and the A allele appears only on the X chromosome) and to have ≤10% chromosome X heterozygosity. Females were required to be homozygous for the A allele at rs2557523 and to have >10% chromosome X heterozygosity.
Ascertainment of Population Stratification
Genetic outliers from each ethnic and/or racial group were removed from further analysis as determined by principal-component analysis and admixture estimates (Figure S6).31,32 Using the 163 AIMs that passed quality control in both EIGENSTRAT31 and ADMIXMAP33,34 to distinguish the four continental ancestral populations—Africans, Europeans, Amerindians, and East Asians—allowed identification of the substructure within the sample set (Figure S6A).35,36 We utilized principal components from EIGENSTRAT outputs to identify outliers >4 SDs from the mean of each of the first three principal components (PC) for the individual population clusters. After quality control, a total of 1,139 samples were excluded (Figure S6B and Table S3). Overall, 2,586 subjects were included in the GWA scan, and 15,490 subjects were included in the replication study, resulting in a total of 18,076 subjects.
Statistical Analysis
Testing for SNP-SLE association in the replication study was carried out through the computation of logistic regression as implemented in PLINK v.1.07.37 The calculation of the additive genetic model included adjustments for the first three PCs and gender. Models were also adjusted for ancestry with estimates provided by ADMIXMAP and resulted in no observable difference in association as compared with PC adjustment. We conducted conditional likelihood-ratio tests by using the extended WHAP functionality in PLINK v.1.07. The genome-wide p value threshold for all data replicating GWA-scan results was p < 5 × 10⁻⁸ after meta-analysis. For the fine mapping and imputation of IRF8, we utilized a Bonferroni-corrected p value threshold of p < 1.09 × 10⁻⁴ on the basis of the maximum number of tests across all populations (460 independent variants with r2 < 0.8). Using METAL,38 we performed meta-analyses of the SNPs observed in both the GWA scan and the multiracial replication study with a weighted Z score. Each racial group was weighted by the square root of its sample size so that sample-size differences could be controlled for between studies. We combined all data generated unless the variant failed quality control in a given racial group.
To test for meta-analysis heterogeneity, we utilized both Cochran's Q test and the I2 index. Cochran's Q test is a classical method that calculates the weighted sum of the squared deviations between individual study effects and the overall effect across studies.39 It follows a chi-square distribution with k-1 degrees of freedom (k is the number of studies). A value of p < 0.05 was considered significant evidence of heterogeneity. The I2 index measures the degree or percentage of inconsistency—due to heterogeneity rather than random chance—across studies.40 The I2 index ranges from 0% to 100% and can equal 0%–25% (low heterogeneity), 26% –50% (moderate heterogeneity), 51%–75% (high heterogeneity), or 76%–100% (very high heterogeneity).
Linkage disequilibrium (LD) and probable haplotypes were determined with HAPLOVIEW v.4.2.30 We calculated haplotype blocks for those haplotypes present at >3% frequency by using the solid-spine of LD algorithms with minimum r2 values of 0.8.30
Resequencing
We resequenced the IRF8 region (chromosome 16: 84,488,150–84,539,352 bp) in 206 (92 SLE cases and 114 healthy controls) European and 46 (25 SLE cases and 21 healthy controls) African American subjects. For each sample, 3–5 μg of whole genomic DNA were sheared and prepared for sequencing with an Illumina Paired-End Genomic DNA Sample Prep Kit. Targeted regions of interest from each sample were then enriched with a SureSelect Target Enrichment System utilizing a custom-designed bait pool (Agilent Technologies). Resequencing was undertaken with an Illumina GAIIx platform according to standard procedures. Post-sequence data were processed with Illumina's Pipeline software v.1.7. All samples were sequenced to minimum average fold coverage of 25×.
Variant Detection and Quality Control
Unique sequences corresponding to an individual nucleotide molecule were aligned to the human genome reference (hg18) with the Burrows-Wheeler Aligner (BWA)41 alignment tool. Reads were locally realigned around known and suspected insertion and deletion sites with the Genome Analysis Toolkit (GATK) analysis suite so that the best possible read alignment could be generated.42 Recalculation of the correct quality score for each base within the alignment was then performed empirically with the GATK suite. This process served to correct overestimated high-quality scores initially reported by the sequencer itself.
After local realignment around deletion-insertion polymorphism (DIP) sites and base quality-score recalibration, SNP and DIP genotypes were generated for each sample individually as well as for the samples as a whole. Finally, SNP and DIP genotypes were hard-filtered against a set of criteria designed to remove any remaining low-quality calls. For a variant to be included in the call list, we required a Phred quality score >30, a quality-by-depth ratio of >5.0, a strand bias score of <−0.10, and a homopolymer run of <5 bases. The variant phase was determined with the program BEAGLE.43 Variants meeting call parameters were output to files compatible with PLINK and other genotyping tools via the VCFtools analysis suite.
To assess the accuracy of sequence-based SNP calling, we cross-referenced the sequenced and genotyped allele calls. We observed ∼99% concordance between genotypes and sequence-based variant detection, suggesting high-quality sequence data. We manually inspected the samples with ≥5% of variants differing between sequencing and genotyping to determine where sequence quality was poor. As an additional quality-control measure, we confirmed each variant identified by our automated workflow by manual inspection of the assembled contig by using the Integrative Genomics Viewer (IGV) program.44
Imputation
To increase the informativeness of the IRF8 region, we conducted imputation in subjects of European, African American, and Asian ancestry over a 100 kb interval spanning the IRF8 locus. Imputation of the replication data across chromosome 16 (84.45–84.46 Mb) was performed with IMPUTE2 and the reference panels provided in Table S7.45–47 Imputed genotypes were required to meet or exceed a probability threshold of 0.8, an information measure of >0.4, and the same quality-control-criteria thresholds described above for inclusion in the analyses.
Results
Two SNPs, rs11648084 and rs11644034, telomeric to IRF8 at 16q24.1 were suggestive of association with SLE in our published GWA scan (p = 5.99 × 10⁻⁴ and 2.29 × 10⁻³, respectively; odds ratio [OR] = 0.76 and 0.66, respectively; Table 1). Both rs11648084 and rs11644034 were replicated in the current, independent population of SLE cases and controls of European ancestry and exceeded the genome-wide threshold (pmeta-Euro = 2.34 × 10⁻⁹ and pmeta-Euro = 2.08 × 10⁻¹⁰, respectively; Table 1). However, neither SNP was significantly associated with SLE in any other population studied, perhaps as a result of the reduced sample size, clinical and/or genetic heterogeneity, decreased minor allele frequency, and/or reduced correlation with the causal variants (Table 1 and Table S4).
Table 1.
SLE Risk Loci Surpassing the Genome-wide Significance Thresholda
| Chr | SNP | Locus | Allelesb |
European (3,562 Cases/3,491 Controls) |
African American (1,527 Cases/1,811 Controls) |
Asian (1,265 Cases/1,260 Controls) |
Meta |
Test of Heterogeneity |
|||||||
|---|---|---|---|---|---|---|---|---|---|---|---|---|---|---|---|
| pGWA scanc | ORGWA scan (95% Cl) | pREP | ORREP (95% Cl) | pMETA-Euro | p | OR (95% Cl) | p | OR (95% Cl) | pMETA-ALLd | pQe | I2 | ||||
| 3 | rs1132200 | TMEM39A | G/A | 1.65 × 10⁻³ | 0.72 (0.59–0.88) | 2.37 × 10⁻⁴ | 0.83 (0.76–0.92) | 1.81 × 10⁻⁶ | 6.92 × 10⁻² | 0.75 (0.56–1.02) | 1.66 × 10⁻³ | 0.73 (0.59–0.89) | 8.62 × 10⁻⁹ | 0.450 | 0.0% |
| 16 | rs11644034 | IRF8 | G/A | 2.29 × 10⁻³ | 0.66 (0.54–0.79) | 2.36 × 10⁻⁸ | 0.78 (0.71–0.85) | 2.08 × 10⁻¹⁰ | 5.10 × 10⁻¹ | 0.95 (0.81–1.11) | 2.63 × 10⁻² | 0.79 (0.65–0.97) | 2.72 × 10⁻⁹ | 0.016 | 61.5% |
| 16 | rs11648084 | IRF8 | G/A | 5.99 × 10⁻⁴ | 0.76 (0.65–0.89) | 9.35 × 10⁻⁷ | 0.83 (0.77–0.89) | 2.34 × 10⁻⁹ | 6.33 × 10⁻² | 0.90 (0.81–1.01) | 7.52 × 10⁻¹ | 1.02 (0.91–1.14) | 7.00 × 10⁻⁷ | 0.001 | 74.0% |
| 17 | rs9913957 | IKZF3 | A/G | 7.87 × 10⁻³ | 1.75 (1.27–2.41) | 5.14 × 10⁻⁴ | 1.38 (1.15–1.66) | 1.38 × 10⁻⁵ | 1.07 × 10⁻² | 1.22 (1.05–1.41) | − | − | 1.39 × 10⁻⁸ | 0.105 | 45.1% |
| 17 | rs8076347 | IKZF3 | C/A | 3.07 × 10⁻³ | 1.93 (1.41–2.62) | 3.04 × 10⁻³ | 1.32 (1.10–1.58) | 4.75 × 10⁻⁵ | 2.19 × 10⁻³ | 1.20 (1.07–1.34) | − | − | 3.01 × 10⁻⁸ | 0.047 | 55.4% |
| 17 | rs8079075 | IKZF3 | A/G | 1.47 × 10⁻³ | 1.90 (1.39–2.59) | 5.08 × 10⁻⁴ | 1.39 (1.16–1.68) | 3.81 × 10⁻⁶ | 2.62 × 10⁻³ | 1.26 (1.08–1.46) | − | − | 4.83 × 10⁻⁹ | 0.201 | 31.3% |
| 17 | rs1453560 | ZPBP2 | A/C | 7.81 × 10⁻⁴ | 1.92 (1.41–2.61) | 6.42 × 10⁻⁴ | 1.37 (1.14–1.64) | 3.21 × 10⁻⁶ | 4.86 × 10⁻⁴ | 1.23 (1.09–1.37) | − | − | 3.48 × 10⁻¹⁰ | 0.097 | 46.4% |
The following abbreviations are used: Chr, chromosome; OR, odds ratio; GWA, genome-wide association; REP, replication; and CI, confidence interval.
Table S7 contains results for all populations evaluated within this study.
Major/minor alleles.
Result of GWA scan was previously reported in Graham et al.1
Data were combined for all racial groups genotyped within our study that passed quality control.
Cochran's Q test statistic.
To better refine the association signal, 287 additional SNPs covering ∼100 kb encompassing the IRF8 coding region were genotyped (see Subjects and Methods; Figures 1A and 1D, Table 2, and Table S4). The most significant association in the European population was with rs9936079 (p = 3.96 × 10⁻⁹, OR = 0.77; Figures 1A and 1D and Table 2), located ∼11 kb telomeric to IRF8 and found to be in strong LD with rs11644034 (r2 = 0.92; Figures 2B and 2C). The Asian population also exhibited association with rs9936079 (p = 2.95 × 10⁻³, OR = 0.73); however, rs9936079 failed to pass quality-control measures (see Subjects and Methods; differential missingness p = 10−7) in individuals of African ancestry and was not associated with disease in patients of Hispanic or Amerindian ancestry. Meta-analysis yielded pmeta-all = 9.28 × 10⁻¹¹ (Table 2 and Table S4).
Figure 1.
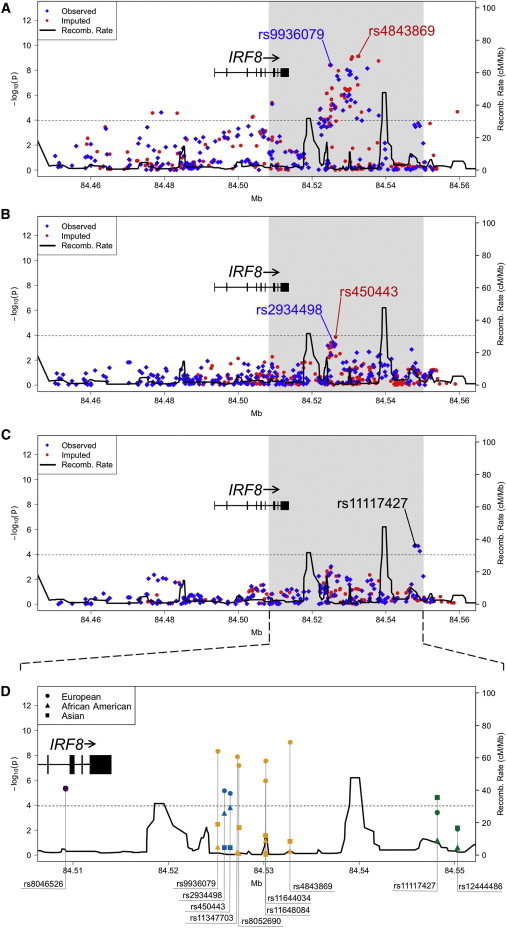
Variants in the Region of IRF8 Tested for Association with SLE
The association between IRF8 and SLE in European (A), African American (B), and Asian (C) ancestral populations is given with observed (blue diamonds) and imputed (red circles) variants. The dotted line represents the Bonferroni-corrected threshold (p = 1.09 × 10⁻⁴) for the fine-mapping study. The solid black line represents the recombination rate. The variants labeled with blue text represent the most significant observed SNPs, whereas the variants labeled in red represent the most significant SNPs after imputation. In the Asians, rs11117427 was both the most significant observed and imputed variant.
(D) Shown is an expanded view of the most statistically significant region in Europeans (circles), African Americans (triangles), and Asians (squares) for selected variants tagged by rs8046526 (purple), rs450443 (turquoise), rs4843869 (yellow-orange), and rs11117427 (green). The following abbreviation is used: Recomb., recombination.
Table 2.
IRF8 Variants Associated with SLEa
| SNP | Genotyped or Imputed | Position (bp) |
European |
pAfrican-American | pAsian | |||
|---|---|---|---|---|---|---|---|---|
| Allelesb | MAFc | p | OR (95% Cl) | |||||
| rs8046526 | I | 84,509,136 | C/T | 0.14/0.16 | 3.96 × 10⁻⁶ | 0.80 (0.73–0.88) | − | − |
| rs8058904 | G | 84,509,183 | A/G | 0.14/0.16 | 5.14 × 10⁻⁶ | 0.80 (0.73–0.88) | 1.96 × 10⁻¹ | − |
| rs9936079 | G | 84,525,095 | G/A | 0.17/0.22 | 3.96 × 10⁻⁹ | 0.77 (0.70–0.84) | − | 2.95 × 10⁻³ |
| rs385344 | I | 84,525,105 | C/G | 0.30/0.27 | 1.37 × 10⁻⁵ | 1.18 (1.10–1.27) | − | 2.43 × 10⁻¹ |
| rs34337659 | I | 84,525,158 | T/C | 0.31/0.27 | 1.55 × 10⁻⁵ | 1.18 (1.10–1.27) | 3.97 × 10⁻⁴ | 1.14 × 10⁻¹ |
| rs66509440 | I | 84,525,182 | C/T | 0.28/0.25 | 6.36 × 10⁻⁶ | 1.20 (1.11–1.30) | 3.97 × 10⁻⁴ | − |
| rs66804793 | I | 84,525,190 | G/A | 0.28/0.25 | 6.16 × 10⁻⁶ | 1.20 (1.11–1.30) | 3.84 × 10⁻⁴ | − |
| rs74032085 | I | 84,525,245 | T/C | 0.28/0.24 | 2.25 × 10⁻⁶ | 1.22 (1.12-1.32) | 4.72 × 10⁻⁴ | − |
| rs16940044 | I | 84,525,266 | A/G | 0.27/0.24 | 2.16 × 10⁻⁶ | 1.22 (1.12–1.32) | 4.73 × 10⁻⁴ | − |
| rs2934497 | I | 84,525,379 | C/T | 0.27/0.23 | 2.62 × 10⁻⁷ | 1.24 (1.14–1.35) | 5.12 × 10⁻⁴ | 1.95 × 10⁻¹ |
| rs2970091 | I | 84,525,387 | G/A | 0.28/0.24 | 2.96 × 10⁻⁷ | 1.24 (1.14–1.34) | 5.31 × 10⁻⁴ | 1.93 × 10⁻¹ |
| rs2934498 | G | 84,525,783 | A/G | 0.31/0.27 | 5.96 × 10⁻⁶ | 1.19 (1.11–1.29) | 3.92 × 10⁻⁴ | 2.09 × 10⁻¹ |
| rs439885 | G | 84,526,175 | G/A | 0.31/0.27 | 1.16 × 10⁻⁵ | 1.19 (1.10–1.28) | 5.59 × 10⁻⁴ | 1.98 × 10⁻¹ |
| rs450443 | I | 84,526,392 | T/G | 0.30/0.27 | 9.73 × 10⁻⁶ | 1.18 (1.10–1.28) | 1.41 × 10⁻⁴ | 2.04 × 10⁻¹ |
| rs396987 | I | 84,526,435 | A/G | 0.30/0.27 | 8.89 × 10⁻⁶ | 1.19 (1.10–1.28) | 5.44 × 10⁻⁴ | 2.04 × 10⁻¹ |
| rs4843865 | G | 84,526,806 | T/A | 0.17/0.21 | 2.93 × 10⁻⁸ | 0.78 (0.72–0.85) | 6.64 × 10⁻¹ | 1.46 × 10⁻² |
| rs11347703 | I | 84,527,141 | G/− | 0.18/0.21 | 1.11 × 10⁻⁸ | 0.78 (0.72–0.85) | 5.73 × 10⁻¹ | − |
| rs8052690 | G | 84,527,239 | A/G | 0.18/0.21 | 5.69 × 10⁻⁸ | 0.79 (0.72–0.86) | 6.58 × 10⁻¹ | 5.28 × 10⁻³ |
| rs186249 | G | 84,528,397 | G/C | 0.30/0.26 | 1.66 × 10⁻⁵ | 1.19 (1.10–1.28) | 1.63 × 10⁻² | 9.37 × 10⁻¹ |
| rs11117422 | G | 84,529,514 | G/C | 0.17/0.21 | 9.37 × 10⁻⁹ | 0.77 (0.71–0.84) | 6.76 × 10⁻¹ | 1.13 × 10⁻² |
| rs11644034 | G | 84,530,113 | G/A | 0.17/0.20 | 2.36 × 10⁻⁸ | 0.78 (0.71–0.85) | 5.10 × 10⁻¹ | 2.63 × 10⁻² |
| rs305066 | I | 84,530,277 | C/T | 0.33/0.29 | 8.18 × 10⁻⁶ | 1.18 (1.10–1.27) | − | 3.62 × 10⁻¹ |
| rs13335265 | G | 84,530,311 | C/G | 0.16/0.20 | 1.23 × 10⁻⁸ | 0.77 (0.70–0.84) | 2.86 × 10⁻¹ | 1.06 × 10⁻² |
| rs12711490 | G | 84,530,529 | A/G | 0.17/0.20 | 2.11 × 10⁻⁸ | 0.78 (0.71–0.85) | 4.51 × 10⁻¹ | 7.55 × 10⁻² |
| rs11641153 | I | 84,530,641 | A/G | 0.16/0.20 | 1.31 × 10⁻⁹ | 0.76 (0.70–0.83) | 4.85 × 10⁻¹ | 7.02 × 10⁻² |
| rs11641155 | I | 84,530,653 | A/G | 0.16/0.20 | 1.23 × 10⁻⁹ | 0.76 (0.70–0.83) | − | 7.02 × 10⁻² |
| rs7205434 | I | 84,530,696 | C/G | 0.16/0.20 | 1.23 × 10⁻⁹ | 0.76 (0.70–0.83) | 4.85 × 10⁻¹ | 7.02 × 10⁻² |
| rs4843868 | I | 84,530,902 | C/T | 0.16/0.20 | 8.57 × 10⁻¹⁰ | 0.76 (0.70–0.83) | 5.82 × 10⁻¹ | 7.02 × 10⁻² |
| rs305063 | G | 84,532,158 | C/A | 0.32/0.29 | 7.34 × 10⁻⁵ | 1.17 (1.08–1.26) | − | 9.66 × 10⁻¹ |
| rs4843323 | I | 84,532,462 | C/T | 0.16/0.20 | 7.71 × 10⁻¹⁰ | 0.76 (0.70–0.83) | − | − |
| rs4843869 | I | 84,532,642 | G/A | 0.16/0.20 | 7.61 × 10⁻¹⁰ | 0.76 (0.70–0.83) | 4.19 × 10⁻¹ | 6.59 × 10⁻² |
| rs7202472 | G | 84,535,003 | C/A | 0.15/0.19 | 7.25 × 10⁻⁹ | 0.77 (0.70–0.84) | 3.94 × 10⁻¹ | 1.41 × 10⁻² |
| rs11117426 | G | 84,547,768 | A/G | 0.16/0.19 | 2.42 × 10⁻⁴ | 0.84 (0.77–0.92) | 1.07 × 10⁻¹ | 2.12 × 10⁻⁵ |
| rs11117427 | G | 84,548,058 | G/A | 0.16/0.18 | 3.46 × 10⁻⁴ | 0.84 (0.77–0.93) | − | 1.99 × 10⁻⁵ |
| rs12445476 | G | 84,548,770 | A/C | 0.16/0.18 | 1.76 × 10⁻⁴ | 0.84 (0.76–0.92) | 6.49 × 10⁻² | 2.19 × 10⁻⁵ |
| rs11642873 | G | 84,549,206 | A/C | 0.15/0.18 | 2.92 × 10⁻⁴ | 0.84 (0.77–0.92) | 8.82 × 10⁻¹ | 5.63 × 10⁻⁵ |
| rs34912238 | I | 84,559,404 | C/T | 0.16/0.19 | 2.15 × 10⁻⁵ | 0.82 (0.75–0.90) | − | − |
The following abbreviations are used: G, genotyped; I, imputed; MAF, minor-allele frequency; OR, odds ratio; and CI, confidence interval.
All subjects, including the 374 that were removed so that the replication study was independent from the GWA scan, were imputed. Tables S4 and S5 contain results for all populations evaluated within this study.
Major/minor alleles.
Case/control.
Figure 2.
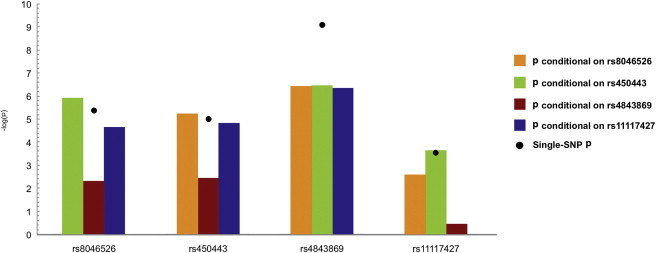
Conditional-Analysis Results Conducted in Individuals of European Ancestry
The results of the conditional analysis with the four SNPs show peak association in Europeans (rs8046526 and rs4843869), African Americans (rs450443), and Asians (rs11117427). The black dot represents the unadjusted single-marker association with SLE.
We observed a modest association in the African Americans at rs2934498 (p = 3.92 × 10⁻⁴, OR = 0.83), which was also significant in those individuals of European ancestry (p = 5.96 × 10⁻⁶, OR = 1.19) but not in those of Asian ancestry (Figure 1B,D, Table 2, and Table S4). The strongest Asian association was observed in a region (rs11117427, p = 1.99 × 10⁻⁵, OR = 0.64) ∼34 kb telomeric to IRF8 (Figures 1C and 1D, Table 2, and Table S4). Association was also observed with rs11117427 (p = 3.46 × 10⁻⁴, OR = 0.84) in the Europeans (Figures 1A and 1D and Table 2). Interestingly, this SNP is only ∼2 kb away from rs12444486, which has been reported by Gateva et al.22 as being suggestive of association with SLE in Europeans (Figure 1D and Table S4).
We resequenced the IRF8 region in 206 subjects of European ancestry and in 46 subjects of African American ancestry to identify variants not previously evaluated within the IRF8 region and to assess their association with SLE (see Subjects and Methods). Thirty-eight and 85 variants not present in dbSNP 130 were identified in European and African American individuals, respectively. After imputing these data into our larger European and African American datasets (see Subjects and Methods), the most significantly associated region within the European population was ∼19 kb telomeric to IRF8 (rs4843869, p = 7.61 × 10⁻¹⁰, OR = 0.76; Table 2 and Figures 1A and 1D). Ultimately, three strongly correlated (r2 > 0.90) SNPs emerged as the most significantly associated with SLE in the Europeans: rs11644034 (identified via GWA scan), rs9936079 (identified by fine mapping), and rs4843869 (imputed on the basis of resequencing). Interestingly, our targeted resequencing revealed a DIP (rs11347703, p = 1.11 × 10⁻⁸, OR = 0.78) that was located less than 100 bp from a genotyped SNP, rs8052690 (p = 5.69 × 10⁻⁸, OR = 0.79, Table 2). This DIP, which has high biological plausibility, was in strong LD with the peak European SNP (rs4843869) and rs8052690 (r2/D' > 0.9; Figures 2B and 2C). Of note, some of the African Americans resequenced in this study did harbor the DIP (rs11347703) identified in the Europeans. However, neither rs11347703 nor any SNP correlated with it was found to be significantly associated with SLE in African Americans, which could be due to the decrease in power and/or a decrease in the minor allele frequency.
The peak association in African Americans after imputation was at rs450443 (p = 1.41 × 10⁻⁴, OR = 0.82; Table 2 and Figures 1B and 1D) and was in strong LD (r2 = 0.88) with rs2934498. Patients of European but not Asian ancestry showed association with rs450443 (p = 9.73 × 10⁻⁶, OR = 1.18; Table 2 and Figures 1A, 1C, and 1D). We conducted imputation in the Asian population by using 1,000 Genomes phased haplotypes;48 however, rs11117427 remained the peak signal (Table 2 and Figures 1C and 1D).
To assess the independence of variants in the European population, we used logistic regression models that adjusted for the best tagging SNP at each signal. When we adjusted for rs4843869 in Europeans, the association persisted at rs450443, and variants correlated to it. However, adjusting for rs4843869 negated the association with rs11117427 and its correlated variants (Figures 2B, 2C, and 3, Table S5, and Figure S2A). Adjusting for either rs450443 or rs11117427 was only able to negate the associations of the polymorphisms that were correlated with each of these SNPs (Figures 2B, 2C, and 3, Table S5, and Figures S2B and S2C). A SNP (rs8046526) in the sixth intron of IRF8 was also associated with SLE risk in Europeans (p = 3.96 × 10⁻⁶, OR = 0.80) and remained significant after adjusting for the other SNPs (Table 2, Figures 1A, 1D, 2B, 2C, and 3, Table S5, and Figure S2D). Adjusting for rs8046526 in the Europeans only negated associations for itself and its correlated variants. However, adjusting the logistic regression model for rs8046526, rs450443, and rs4843869 negated all associations present in the European population (Figures 2B, 2C, and 3, Table S5, and Figure S2E), demonstrating the importance of these three IRF8 variants for SLE risk.
Figure 3.
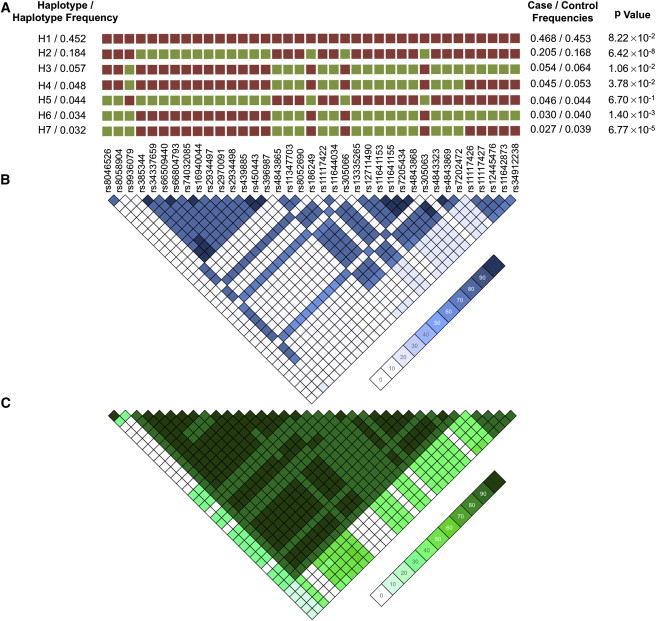
IRF8 Haplotype and LD in the European Ancestral Population
(A) Haplotype structure in Europeans present at a frequency >3%. Major alleles are represented by red squares, whereas the green squares are minor alleles.
(B and C) A LD plot of r2 (B) and D' (C) in Europeans illustrates that the variants tagged by rs450443 and those tagged by rs4843869 are in weak r2 but strong D', providing evidence that these variants are inherited together.
Haplotype analysis identified a single risk haplotype (H2) (p = 6.42 × 10⁻⁸) with a frequency of 18.4% in the European individuals (Figure 2). Two significant protective haplotypes, H6 and H7, were also identified (Figure 2). The risk-associated alleles within the region bounded by SNPs rs11117426–rs34912238 (the peak Asian effect) were also present in the most significant protective haplotype, H7, suggesting that this region might not impact disease risk in Europeans (Figure 2). The only differences between H3 and H6 as well as between H4 and H7 are rs8046526 and rs8058904 in the minor form, suggesting that these SNPs are important in conferring protection from disease (Figure 2). The only differences between H2 and H5 (which are not statistically significant) are the major alleles (for SNPs rs8046526 and rs8058904) residing on the H2 haplotype and the minor alleles on the neutral H5 haplotype. Thus, it appears that all three regions (tagged by rs8046526, rs450443, and rs4843869) are required for risk. Many variants residing on the risk haplotype are within regions known to bind multiple transcription factors in the ENCODE ChIP-Seq project dataset in immunologic cell types (Figures S3 and S4).49 Thus, we hypothesize that the risk haplotype has the potential to affect the regulation of IRF8 expression and/or the expression of other genes in the region.
Within TMEM39A in region 3q13.33, a coding SNP (rs1132200) that demonstrated suggestive evidence of association in our previous GWA scan (p = 1.65 × 10⁻³) was also confirmed in the European replication study (p = 2.37 × 10⁻⁴, OR = 0.83; Table 1 and Table S6). This nonsynonymous SNP showed association with SLE in Asian patients (p = 1.66 × 10⁻³, OR = 0.73) but not in African Americans, Hispanics, Gullah, or Amerindians (Table 1 and Table S6). When analyzing this SNP in all populations that passed quality control, a meta-analysis produced pmeta-all = 8.62 × 10⁻⁹, and no evidence of heterogeneity was observed between these datasets (Table 1 and Table S6).
Finally, we replicated several SNPs in the 17q12 region between IKZF3 and ZPBP2 (Table 1 and Table S6). Three SNPs within IKZF3 replicated, and rs8079075 was the most significant SNP in both the samples of European (p = 5.08 × 10⁻⁴, OR = 1.39) and African American (p = 2.62 × 10⁻³, OR = 1.26) ancestry (pmeta-all = 4.83 × 10⁻⁹). The most significant SNP in this region (rs1453560) is located between IKZF3 and ZPBP2 and was replicated in European (p = 6.42 × 10⁻⁴, OR = 1.37) and African American (p = 4.86 × 10⁻⁴, OR = 1.23) ancestral populations; the replication resulted in pmeta-all = 3.48 × 10⁻¹⁰ (Table 1 and Table S6). All four SNPs are highly correlated (r2 > 0.95). Even though Cochran's Q test of heterogeneity was not statistically significant, we observed moderate heterogeneity by the I2 index, perhaps as a result of the differences in allele frequency between the racial groups (Table 1). IKZF3 and ZPBP2 are transcribed in opposite directions of one another but share the same promoter region (Figure S5). The ENCODE ChIP-Seq project has identified multiple transcription-factor binding sites for chromatin in the chromosomal region surrounding rs1453560 (Figure S5).49
In addition to the three regions (described above) that now exceed genome-wide significance, 11 loci were replicated in the European SLE cases but did not exceed genome-wide significance (5 × 10⁻⁸ < pmeta-Euro < 9.99 × 10⁻⁵). These 11 loci include the following: CFHR1 (MIM 134371), CADM2, LOC730109/IL12A (MIM 161560), LPP (MIM 600700), LOC63920, SLU7 (MIM 605974), ADAMTSL1 (MIM 609198), C10orf64, OR8D4, FAM19A2, and STXBP6 (MIM 607958) (Table 3 and Table S7).
Table 3.
Replicated Loci that Demonstrate Suggestive Evidence of SLE Riska
| SNP | Locus | Allelesb |
European |
Test of Heterogeneity |
|||||
|---|---|---|---|---|---|---|---|---|---|
| pGWA scanc | ORGWA scan (95% Cl) | pREP | ORREP (95% Cl) | pMETA-Euro | pQd | I2 | |||
| rs7542235 | CFHR1 | A/G | 3.94 × 10⁻³ | 1.30 (1.11–1.54) | 1.10 × 10⁻³ | 1.15 (1.06–1.25) | 1.85 × 10⁻⁵ | 0.180 | 44.4% |
| rs485499 | LOC730109/IL12A | A/G | 2.14 × 10⁻³ | 0.75 (0.65–0.87) | 1.47 × 10⁻⁴ | 0.87 (0.81–0.94) | 1.31 × 10⁻⁶ | 0.076 | 68.2% |
| rs669003 | LOC730109/IL12A | A/G | 2.16 × 10⁻³ | 0.75 (0.65–0.87) | 1.15 × 10⁻⁴ | 0.87 (0.81–0.93) | 1.02 × 10⁻⁶ | 0.081 | 67.2% |
| rs7631930 | LPP | A/G | 3.60 × 10⁻³ | 1.25 (1.06–1.49) | 1.66 × 10⁻³ | 1.15 (1.05–1.25) | 2.71 × 10⁻⁵ | 0.375 | 0.00% |
| rs9310002 | CADM2 | G/A | 2.09 × 10⁻³ | 2.06 (1.38–3.07) | 6.12 × 10⁻³ | 1.39 (1.10–1.76) | 8.30 × 10⁻⁵ | 0.099 | 63.3% |
| rs1075059 | LOC63920 | A/C | 7.30 × 10⁻⁴ | 0.82 (0.71–0.95) | 7.26 × 10⁻³ | 0.91 (0.85–0.97) | 5.27 × 10⁻⁵ | 0.221 | 33.2% |
| rs1895321 | SLU7 | A/C | 4.21 × 10⁻³ | 1.22 (1.06–1.41) | 3.11 × 10⁻³ | 1.11 (1.04–1.19) | 6.09 × 10⁻⁵ | 0.260 | 21.2% |
| rs7039790 | ADAMTSL1 | C/A | 5.36 × 10⁻³ | 1.62 (1.24–2.12) | 1.14 × 10⁻³ | 1.27 (1.10–1.47) | 2.38 × 10⁻⁵ | 0.124 | 57.7% |
| rs2940712 | C10orf64 | G/A | 4.72 × 10⁻³ | 0.79 (0.67–0.91) | 8.73 × 10⁻⁴ | 0.88 (0.82–0.95) | 1.62 × 10⁻⁵ | 0.178 | 45.0% |
| rs10790605 | OR8D4 | G/A | 2.02 × 10⁻³ | 0.80 (0.67–0.95) | 4.35 × 10⁻³ | 0.88 (0.81–0.96) | 5.39 × 10⁻⁵ | 0.321 | 0.00% |
| rs7960162 | FAM19A2 | A/G | 4.95 × 10⁻³ | 0.76 (0.61–0.94) | 4.31 × 10⁻³ | 0.87 (0.79–0.96) | 9.79 × 10⁻⁵ | 0.253 | 23.6% |
| rs749373 | STXBP6 | A/G | 5.44 × 10⁻³ | 1.34 (1.11–1.62) | 2.32 × 10⁻³ | 1.16 (1.05–1.27) | 5.26 × 10⁻⁵ | 0.171 | 46.7% |
The following abbreviation is used: GWA, genome-wide association; OR, odds ratio; CI, confidence interval; and REP, replication.
Table S7 contains results for all populations evaluated within this study.
Major/minor alleles.
GWA scan previously reported in Graham et al.1
Cochran's Q test statistic.
Discussion
The interferon regulatory factors are a family of transcription factors that play a critical role in the regulation of several pathways, including the response to pathogens, apoptosis, the cell cycle, and hematopoietic differentiation.50 IRF8 is expressed in the nucleus (but partially in the cytoplasm) of B cells, macrophages, and CD11b dendritic cells (DCs).50 IRF8 can be induced by interferon-γ in macrophages and antigen stimulation within T cells. It also plays an important role in the development of B cells and macrophages.50 In the nucleus, IRF8 is required for promoting type I interferon responses in DCs upon viral stimulation.50 Interestingly, the overexpression of genes induced by type I interferons has been widely reported in SLE and other autoimmune conditions.12,51,52 In the cytosol, IRF8 is involved in the TLR9-MyD88-dependent signaling by binding to TRAF6 in both DCs and macrophages.50 After TLR9 stimulation, DCs from mice that are Irf8−/− cannot activate NF-κB or MAPKs.50 Of note, rs17445836, which was not included in our study but has been associated with multiple sclerosis (MIM 126200), lies approximately 61 kb telomeric to IRF8 and is far removed from the regions identified in SLE.53
Fine mapping, resequencing, imputation, and haplotype analysis of the IRF8 locus in Europeans identified a single haplotype requiring the presence of three independent effects to confer risk. Additionally, several variants within the IRF8 risk haplotype might influence binding to the many regulatory elements present within the region. Thus, we hypothesize that the likely functional effect would result in altered IRF8 mRNA and protein expression. Although we believe that most of the common variation within the IRF8 region has been evaluated in this study, it is possible that some variants with minor allele frequencies <1% also play a role in SLE risk but were not detected in our study because of the number of samples resequenced.
The TMEM39A-associated coding SNP (rs1132200) results in an amino acid change from alanine to threonine at position 487 of the protein. Although almost no biological data have been published suggesting its relevance to SLE, it has been found to be associated with multiple sclerosis.54 Better understanding whether the coding SNP in TMEM39A is functionally relevant or is merely correlated with other unexamined causal polymorphism(s) will require mechanistic and fine-mapping experiments.
Although the region surrounding the IKZF3-ZPBP2 locus at 17q21 has been associated with multiple phenotypes, the extensive LD in the region has prohibited investigators from clearly determining the relevant gene. Crohn disease (MIM 266600), ulcerative colitis (MIM 266600), primary biliary cirrhosis (MIM 109720), and rheumatoid arthritis (MIM 180300) all have reported associations with genes between 34.62–35.51 Mb of chromosome 17.55–60 Fine mapping and resequencing of this region in Europeans and African Americans are needed if researchers are to more precisely refine this association and determine the loci associated with risk. IKZF3 is a member of the IKAROS family of transcription factors involved in lymphocyte development; IKZF1 in this family has already been reported as a risk locus for SLE.22 Mice with a mutant form of IKZF3 produce anti-dsDNA autoantibodies, making it an interesting candidate gene for human SLE.61 Moreover, mice that are null for IKZF3 and OBF-1 (POU class 2 associating factor 1) do not mount an autoimmune response.61 The peak signal in our study was in a region containing multiple regulatory elements, so it is likely that the associated SNP could affect expression of IKZF3 or ZPBP2, which both share the promoter region. However, no known function of ZPBP2 has been reported.
Eleven additional regions were replicated in the European subjects but did not surpass genome-wide significance. Of these regions, LOC730108/IL12A was previously reported as a risk locus for primary biliary cirrhosis and multiple sclerosis.60,62 IL-12A induces interferon-gamma and helps differentiate Th1 and Th2 cells.63 The response of lymphocytes to IL-12A is mediated by STAT4, which is also implicated in SLE pathogenesis.64 The LIM domain containing preferred translocation partner in lipoma (LPP) is involved in focal adhesions, cell-cell adhesion, and cell motility. Variants within the LPP region have been associated with vitiligo and celiac disease.65,66 Confirmation of these associations will require replication in a larger independent and equally diverse population.
In conclusion, we have robustly established three additional susceptibility loci for SLE: IRF8, TMEM39A, and IKZF3-ZPBP2. Eleven other regions were replicated but did not exceed the genome-wide threshold of significance. Collectively, these data, along with other previously reported loci, demonstrate the growing complexity of the heritable contribution to SLE pathogenesis. A complete understanding of how genetics influence the pathophysiology of SLE will only be possible once we have identified all contributing loci and functional and/or causal variants for each association and have extensively evaluated the role of rare variants. More work will be required if we are to increase our understanding of how the loci identified in this study influence SLE etiology.
Acknowledgments
We are grateful to all the individuals with SLE and those serving as healthy controls who participated in this study. We thank the following individuals for contributing samples: Sandra Marc Bijl, D'Alfonso, Emoke Endreffy, Iñigo Rúa-Figueroa, Cintia Garcilazo, Carmen Gutierrez, Peter Junker, Helle Laustrup, Rafaella Scorza, Berta Martins da Silva, Ana Suarez, and Carlos Vasconcelos. For the GENLES collaboration, we thank Eduardo Acevedo, Mario Cardiel, Ignacio García de la Torre, Mabel Busajm, Cecilia Castel, Marco Maradiaga, José F. Moctezuma, and Jorge Musuruana. For the Asociación Andaluza de Enfermedades Autoimmunes collaboration, we thank Juan Jimenez-Alonso, Norberto Ortego-Centeno, Enrique de Ramon, and Julio Sanchez-Roman. We would like to thank Summer Frank and Mei Li Zhu for their assistance in genotyping, quality-control analyses, and clinical data management. We would also like to thank Emily Cole for her assistance in preparing figures. Grant support information is provided in the Supplemental Acknowledgments available online.
Supplemental Data
Web Resources
The URLs for data presented herein are as follows:
Encyclopedia of DNA Elements (ENCODE), http://genome.ucsc.edu/ENCODE/
HUGO Gene Nomenclature Committee, http://www.genenames.org/
LocusZoom, http://csg.sph.umich.edu/locuszoom/
Online Mendelian Inheritance in Man (OMIM), http://www.omim.org
UCSC Genome Browser, http://genome.ucsc.edu/
VCFtools, http://www.vcftools.sourceforge.net
References
- 1.Petri M. Epidemiology of systemic lupus erythematosus. Best Pract. Res. Clin. Rheumatol. 2002;16:847–858. doi: 10.1053/berh.2002.0259. [DOI] [PubMed] [Google Scholar]
- 2.Moser K.L., Kelly J.A., Lessard C.J., Harley J.B. Recent insights into the genetic basis of systemic lupus erythematosus. Genes Immun. 2009;10:373–379. doi: 10.1038/gene.2009.39. [DOI] [PMC free article] [PubMed] [Google Scholar]
- 3.Alarcón-Segovia D., Alarcón-Riquelme M.E., Cardiel M.H., Caeiro F., Massardo L., Villa A.R., Pons-Estel B.A., Grupo Latinoamericano de Estudio del Lupus Eritematoso (GLADEL) Familial aggregation of systemic lupus erythematosus, rheumatoid arthritis, and other autoimmune diseases in 1,177 lupus patients from the GLADEL cohort. Arthritis Rheum. 2005;52:1138–1147. doi: 10.1002/art.20999. [DOI] [PubMed] [Google Scholar]
- 4.Anaya J.M., Tobon G.J., Vega P., Castiblanco J. Autoimmune disease aggregation in families with primary Sjögren's syndrome. J. Rheumatol. 2006;33:2227–2234. [PubMed] [Google Scholar]
- 5.Arora-Singh R.K., Assassi S., del Junco D.J., Arnett F.C., Perry M., Irfan U., Sharif R., Mattar T., Mayes M.D. Autoimmune diseases and autoantibodies in the first degree relatives of patients with systemic sclerosis. J. Autoimmun. 2010;35:52–57. doi: 10.1016/j.jaut.2010.02.001. [DOI] [PMC free article] [PubMed] [Google Scholar]
- 6.Sestak A.L., Shaver T.S., Moser K.L., Neas B.R., Harley J.B. Familial aggregation of lupus and autoimmunity in an unusual multiplex pedigree. J. Rheumatol. 1999;26:1495–1499. [PubMed] [Google Scholar]
- 7.Deng Y., Tsao B.P. Genetic susceptibility to systemic lupus erythematosus in the genomic era. Nat. Rev. Rheumatol. 2010;6:683–692. doi: 10.1038/nrrheum.2010.176. [DOI] [PMC free article] [PubMed] [Google Scholar]
- 8.Reinertsen J.L., Klippel J.H., Johnson A.H., Steinberg A.D., Decker J.L., Mann D.L. B-lymphocyte alloantigens associated with systemic lupus erythematosus. N. Engl. J. Med. 1978;299:515–518. doi: 10.1056/NEJM197809072991004. [DOI] [PubMed] [Google Scholar]
- 9.Nies K.M., Brown J.C., Dubois E.L., Quismorio F.P., Friou G.J., Terasaki P.I. Histocompatibility (HL-A) antigens and lymphocytotoxic antibodies in systemic lupus erythematosus (SLE) Arthritis Rheum. 1974;17:397–402. doi: 10.1002/art.1780170409. [DOI] [PubMed] [Google Scholar]
- 10.Graham R.R., Ortmann W.A., Langefeld C.D., Jawaheer D., Selby S.A., Rodine P.R., Baechler E.C., Rohlf K.E., Shark K.B., Espe K.J. Visualizing human leukocyte antigen class II risk haplotypes in human systemic lupus erythematosus. Am. J. Hum. Genet. 2002;71:543–553. doi: 10.1086/342290. [DOI] [PMC free article] [PubMed] [Google Scholar]
- 11.McCulloch D.K., Klaff L.J., Kahn S.E., Schoenfeld S.L., Greenbaum C.J., Mauseth R.S., Benson E.A., Nepom G.T., Shewey L., Palmer J.P. Nonprogression of subclinical beta-cell dysfunction among first-degree relatives of IDDM patients. 5-yr follow-up of the Seattle Family Study. Diabetes. 1990;39:549–556. doi: 10.2337/diab.39.5.549. [DOI] [PubMed] [Google Scholar]
- 12.Baechler E.C., Batliwalla F.M., Karypis G., Gaffney P.M., Ortmann W.A., Espe K.J., Shark K.B., Grande W.J., Hughes K.M., Kapur V. Interferon-inducible gene expression signature in peripheral blood cells of patients with severe lupus. Proc. Natl. Acad. Sci. USA. 2003;100:2610–2615. doi: 10.1073/pnas.0337679100. [DOI] [PMC free article] [PubMed] [Google Scholar]
- 13.Bennett L., Palucka A.K., Arce E., Cantrell V., Borvak J., Banchereau J., Pascual V. Interferon and granulopoiesis signatures in systemic lupus erythematosus blood. J. Exp. Med. 2003;197:711–723. doi: 10.1084/jem.20021553. [DOI] [PMC free article] [PubMed] [Google Scholar]
- 14.Kirou K.A., Lee C., George S., Louca K., Papagiannis I.G., Peterson M.G., Ly N., Woodward R.N., Fry K.E., Lau A.Y. Coordinate overexpression of interferon-alpha-induced genes in systemic lupus erythematosus. Arthritis Rheum. 2004;50:3958–3967. doi: 10.1002/art.20798. [DOI] [PubMed] [Google Scholar]
- 15.Sigurdsson S., Nordmark G., Göring H.H., Lindroos K., Wiman A.C., Sturfelt G., Jönsen A., Rantapää-Dahlqvist S., Möller B., Kere J. Polymorphisms in the tyrosine kinase 2 and interferon regulatory factor 5 genes are associated with systemic lupus erythematosus. Am. J. Hum. Genet. 2005;76:528–537. doi: 10.1086/428480. [DOI] [PMC free article] [PubMed] [Google Scholar]
- 16.Hom G., Graham R.R., Modrek B., Taylor K.E., Ortmann W., Garnier S., Lee A.T., Chung S.A., Ferreira R.C., Pant P.V. Association of systemic lupus erythematosus with C8orf13-BLK and ITGAM-ITGAX. N. Engl. J. Med. 2008;358:900–909. doi: 10.1056/NEJMoa0707865. [DOI] [PubMed] [Google Scholar]
- 17.Harley J.B., Alarcón-Riquelme M.E., Criswell L.A., Jacob C.O., Kimberly R.P., Moser K.L., Tsao B.P., Vyse T.J., Langefeld C.D., Nath S.K., International Consortium for Systemic Lupus Erythematosus Genetics (SLEGEN) Genome-wide association scan in women with systemic lupus erythematosus identifies susceptibility variants in ITGAM, PXK, KIAA1542 and other loci. Nat. Genet. 2008;40:204–210. doi: 10.1038/ng.81. [DOI] [PMC free article] [PubMed] [Google Scholar]
- 18.Yang W., Shen N., Ye D.Q., Liu Q., Zhang Y., Qian X.X., Hirankarn N., Ying D., Pan H.F., Mok C.C., Asian Lupus Genetics Consortium Genome-wide association study in Asian populations identifies variants in ETS1 and WDFY4 associated with systemic lupus erythematosus. PLoS Genet. 2010;6:e1000841. doi: 10.1371/journal.pgen.1000841. [DOI] [PMC free article] [PubMed] [Google Scholar]
- 19.Graham R.R., Cotsapas C., Davies L., Hackett R., Lessard C.J., Leon J.M., Burtt N.P., Guiducci C., Parkin M., Gates C. Genetic variants near TNFAIP3 on 6q23 are associated with systemic lupus erythematosus. Nat. Genet. 2008;40:1059–1061. doi: 10.1038/ng.200. [DOI] [PMC free article] [PubMed] [Google Scholar]
- 20.Kozyrev S.V., Abelson A.K., Wojcik J., Zaghlool A., Linga Reddy M.V., Sanchez E., Gunnarsson I., Svenungsson E., Sturfelt G., Jönsen A. Functional variants in the B-cell gene BANK1 are associated with systemic lupus erythematosus. Nat. Genet. 2008;40:211–216. doi: 10.1038/ng.79. [DOI] [PubMed] [Google Scholar]
- 21.Han J.W., Zheng H.F., Cui Y., Sun L.D., Ye D.Q., Hu Z., Xu J.H., Cai Z.M., Huang W., Zhao G.P. Genome-wide association study in a Chinese Han population identifies nine new susceptibility loci for systemic lupus erythematosus. Nat. Genet. 2009;41:1234–1237. doi: 10.1038/ng.472. [DOI] [PubMed] [Google Scholar]
- 22.Gateva V., Sandling J.K., Hom G., Taylor K.E., Chung S.A., Sun X., Ortmann W., Kosoy R., Ferreira R.C., Nordmark G. A large-scale replication study identifies TNIP1, PRDM1, JAZF1, UHRF1BP1 and IL10 as risk loci for systemic lupus erythematosus. Nat. Genet. 2009;41:1228–1233. doi: 10.1038/ng.468. [DOI] [PMC free article] [PubMed] [Google Scholar]
- 23.Lessard C.J., Adrianto I., Kelly J.A., Kaufman K.M., Grundahl K.M., Adler A., Williams A.H., Gallant C.J., Anaya J.M., Bae S.C., Marta E. Alarcón-Riquelme on behalf of the BIOLUPUS and GENLES Networks Identification of a systemic lupus erythematosus susceptibility locus at 11p13 between PDHX and CD44 in a multiethnic study. Am. J. Hum. Genet. 2011;88:83–91. doi: 10.1016/j.ajhg.2010.11.014. [DOI] [PMC free article] [PubMed] [Google Scholar]
- 24.Namjou B., Kothari P.H., Kelly J.A., Glenn S.B., Ojwang J.O., Adler A., Alarcón-Riquelme M.E., Gallant C.J., Boackle S.A., Criswell L.A. Evaluation of the TREX1 gene in a large multi-ancestral lupus cohort. Genes Immun. 2011;12:270–279. doi: 10.1038/gene.2010.73. [DOI] [PMC free article] [PubMed] [Google Scholar]
- 25.Adrianto I., Wen F., Templeton A., Wiley G., King J.B., Lessard C.J., Bates J.S., Hu Y., Kelly J.A., Kaufman K.M., BIOLUPUS and GENLES Networks Association of a functional variant downstream of TNFAIP3 with systemic lupus erythematosus. Nat. Genet. 2011;43:253–258. doi: 10.1038/ng.766. [DOI] [PMC free article] [PubMed] [Google Scholar]
- 26.Tan W., Sunahori K., Zhao J., Deng Y., Kaufman K.M., Kelly J.A., Langefeld C.D., Williams A.H., Comeau M.E., Ziegler J.T., BIOLUPUS Network. GENLES Network Association of PPP2CA polymorphisms with systemic lupus erythematosus susceptibility in multiple ethnic groups. Arthritis Rheum. 2011;63:2755–2763. doi: 10.1002/art.30452. [DOI] [PMC free article] [PubMed] [Google Scholar]
- 27.Zhao J., Wu H., Khosravi M., Cui H., Qian X., Kelly J.A., Kaufman K.M., Langefeld C.D., Williams A.H., Comeau M.E., BIOLUPUS Network. GENLES Network Association of genetic variants in complement factor H and factor H-related genes with systemic lupus erythematosus susceptibility. PLoS Genet. 2011;7:e1002079. doi: 10.1371/journal.pgen.1002079. [DOI] [PMC free article] [PubMed] [Google Scholar]
- 28.Sanchez E., Nadig A., Richardson B.C., Freedman B.I., Kaufman K.M., Kelly J.A., Niewold T.B., Kamen D.L., Gilkeson G.S., Ziegler J.T., BIOLUPUS and GENLES Phenotypic associations of genetic susceptibility loci in systemic lupus erythematosus. Ann. Rheum. Dis. 2011;70:1752–1757. doi: 10.1136/ard.2011.154104. [DOI] [PMC free article] [PubMed] [Google Scholar]
- 29.Hochberg M.C. Updating the American College of Rheumatology revised criteria for the classification of systemic lupus erythematosus. Arthritis Rheum. 1997;40:1725. doi: 10.1002/art.1780400928. [DOI] [PubMed] [Google Scholar]
- 30.Barrett J.C., Fry B., Maller J., Daly M.J. Haploview: Analysis and visualization of LD and haplotype maps. Bioinformatics. 2005;21:263–265. doi: 10.1093/bioinformatics/bth457. [DOI] [PubMed] [Google Scholar]
- 31.Price A.L., Patterson N.J., Plenge R.M., Weinblatt M.E., Shadick N.A., Reich D. Principal components analysis corrects for stratification in genome-wide association studies. Nat. Genet. 2006;38:904–909. doi: 10.1038/ng1847. [DOI] [PubMed] [Google Scholar]
- 32.McKeigue P.M., Carpenter J.R., Parra E.J., Shriver M.D. Estimation of admixture and detection of linkage in admixed populations by a Bayesian approach: Application to African-American populations. Ann. Hum. Genet. 2000;64:171–186. doi: 10.1017/S0003480000008022. [DOI] [PubMed] [Google Scholar]
- 33.Hoggart C.J., Parra E.J., Shriver M.D., Bonilla C., Kittles R.A., Clayton D.G., McKeigue P.M. Control of confounding of genetic associations in stratified populations. Am. J. Hum. Genet. 2003;72:1492–1504. doi: 10.1086/375613. [DOI] [PMC free article] [PubMed] [Google Scholar]
- 34.Hoggart C.J., Shriver M.D., Kittles R.A., Clayton D.G., McKeigue P.M. Design and analysis of admixture mapping studies. Am. J. Hum. Genet. 2004;74:965–978. doi: 10.1086/420855. [DOI] [PMC free article] [PubMed] [Google Scholar]
- 35.Smith M.W., Patterson N., Lautenberger J.A., Truelove A.L., McDonald G.J., Waliszewska A., Kessing B.D., Malasky M.J., Scafe C., Le E. A high-density admixture map for disease gene discovery in african americans. Am. J. Hum. Genet. 2004;74:1001–1013. doi: 10.1086/420856. [DOI] [PMC free article] [PubMed] [Google Scholar]
- 36.Halder I., Shriver M., Thomas M., Fernandez J.R., Frudakis T. A panel of ancestry informative markers for estimating individual biogeographical ancestry and admixture from four continents: Utility and applications. Hum. Mutat. 2008;29:648–658. doi: 10.1002/humu.20695. [DOI] [PubMed] [Google Scholar]
- 37.Purcell S., Neale B., Todd-Brown K., Thomas L., Ferreira M.A., Bender D., Maller J., Sklar P., de Bakker P.I., Daly M.J., Sham P.C. PLINK: A tool set for whole-genome association and population-based linkage analyses. Am. J. Hum. Genet. 2007;81:559–575. doi: 10.1086/519795. [DOI] [PMC free article] [PubMed] [Google Scholar]
- 38.Willer C.J., Li Y., Abecasis G.R. METAL: Fast and efficient meta-analysis of genomewide association scans. Bioinformatics. 2010;26:2190–2191. doi: 10.1093/bioinformatics/btq340. [DOI] [PMC free article] [PubMed] [Google Scholar]
- 39.Cochran W.G. The Combination of Estimates from Different Experiments. Biometrics. 1954;10:101–129. [Google Scholar]
- 40.Higgins J.P., Thompson S.G., Deeks J.J., Altman D.G. Measuring inconsistency in meta-analyses. BMJ. 2003;327:557–560. doi: 10.1136/bmj.327.7414.557. [DOI] [PMC free article] [PubMed] [Google Scholar]
- 41.Li H., Durbin R. Fast and accurate short read alignment with Burrows-Wheeler transform. Bioinformatics. 2009;25:1754–1760. doi: 10.1093/bioinformatics/btp324. [DOI] [PMC free article] [PubMed] [Google Scholar]
- 42.McKenna A., Hanna M., Banks E., Sivachenko A., Cibulskis K., Kernytsky A., Garimella K., Altshuler D., Gabriel S., Daly M., DePristo M.A. The Genome Analysis Toolkit: A MapReduce framework for analyzing next-generation DNA sequencing data. Genome Res. 2010;20:1297–1303. doi: 10.1101/gr.107524.110. [DOI] [PMC free article] [PubMed] [Google Scholar]
- 43.Browning S.R., Browning B.L. Rapid and accurate haplotype phasing and missing-data inference for whole-genome association studies by use of localized haplotype clustering. Am. J. Hum. Genet. 2007;81:1084–1097. doi: 10.1086/521987. [DOI] [PMC free article] [PubMed] [Google Scholar]
- 44.Robinson J.T., Thorvaldsdóttir H., Winckler W., Guttman M., Lander E.S., Getz G., Mesirov J.P. Integrative genomics viewer. Nat. Biotechnol. 2011;29:24–26. doi: 10.1038/nbt.1754. [DOI] [PMC free article] [PubMed] [Google Scholar]
- 45.Frazer K.A., Ballinger D.G., Cox D.R., Hinds D.A., Stuve L.L., Gibbs R.A., Belmont J.W., Boudreau A., Hardenbol P., Leal S.M., International HapMap Consortium A second generation human haplotype map of over 3.1 million SNPs. Nature. 2007;449:851–861. doi: 10.1038/nature06258. [DOI] [PMC free article] [PubMed] [Google Scholar]
- 46.Howie B.N., Donnelly P., Marchini J. A flexible and accurate genotype imputation method for the next generation of genome-wide association studies. PLoS Genet. 2009;5:e1000529. doi: 10.1371/journal.pgen.1000529. [DOI] [PMC free article] [PubMed] [Google Scholar]
- 47.Via M., Gignoux C., Burchard E.G. The 1000 Genomes Project: New opportunities for research and social challenges. Genome Med. 2010;2:3. doi: 10.1186/gm124. [DOI] [PMC free article] [PubMed] [Google Scholar]
- 48.1000 Genomes Project Consortium A map of human genome variation from population-scale sequencing. Nature. 2010;467:1061–1073. doi: 10.1038/nature09534. [DOI] [PMC free article] [PubMed] [Google Scholar]
- 49.Birney E., Stamatoyannopoulos J.A., Dutta A., Guigó R., Gingeras T.R., Margulies E.H., Weng Z., Snyder M., Dermitzakis E.T., Thurman R.E., ENCODE Project Consortium. NISC Comparative Sequencing Program. Baylor College of Medicine Human Genome Sequencing Center. Washington University Genome Sequencing Center. Broad Institute. Children's Hospital Oakland Research Institute Identification and analysis of functional elements in 1% of the human genome by the ENCODE pilot project. Nature. 2007;447:799–816. doi: 10.1038/nature05874. [DOI] [PMC free article] [PubMed] [Google Scholar]
- 50.Tamura T., Yanai H., Savitsky D., Taniguchi T. The IRF family transcription factors in immunity and oncogenesis. Annu. Rev. Immunol. 2008;26:535–584. doi: 10.1146/annurev.immunol.26.021607.090400. [DOI] [PubMed] [Google Scholar]
- 51.Baechler E.C., Gregersen P.K., Behrens T.W. The emerging role of interferon in human systemic lupus erythematosus. Curr. Opin. Immunol. 2004;16:801–807. doi: 10.1016/j.coi.2004.09.014. [DOI] [PubMed] [Google Scholar]
- 52.Baechler E.C., Batliwalla F.M., Reed A.M., Peterson E.J., Gaffney P.M., Moser K.L., Gregersen P.K., Behrens T.W. Gene expression profiling in human autoimmunity. Immunol. Rev. 2006;210:120–137. doi: 10.1111/j.0105-2896.2006.00367.x. [DOI] [PubMed] [Google Scholar]
- 53.De Jager P.L., Jia X., Wang J., de Bakker P.I., Ottoboni L., Aggarwal N.T., Piccio L., Raychaudhuri S., Tran D., Aubin C., International MS Genetics Consortium Meta-analysis of genome scans and replication identify CD6, IRF8 and TNFRSF1A as new multiple sclerosis susceptibility loci. Nat. Genet. 2009;41:776–782. doi: 10.1038/ng.401. [DOI] [PMC free article] [PubMed] [Google Scholar]
- 54.International Multiple Sclerosis Genetics Consortium (IMSGC) Comprehensive follow-up of the first genome-wide association study of multiple sclerosis identifies KIF21B and TMEM39A as susceptibility loci. Hum. Mol. Genet. 2010;19:953–962. doi: 10.1093/hmg/ddp542. [DOI] [PMC free article] [PubMed] [Google Scholar]
- 55.Franke A., McGovern D.P., Barrett J.C., Wang K., Radford-Smith G.L., Ahmad T., Lees C.W., Balschun T., Lee J., Roberts R. Genome-wide meta-analysis increases to 71 the number of confirmed Crohn's disease susceptibility loci. Nat. Genet. 2010;42:1118–1125. doi: 10.1038/ng.717. [DOI] [PMC free article] [PubMed] [Google Scholar]
- 56.Liu X., Invernizzi P., Lu Y., Kosoy R., Lu Y., Bianchi I., Podda M., Xu C., Xie G., Macciardi F. Genome-wide meta-analyses identify three loci associated with primary biliary cirrhosis. Nat. Genet. 2010;42:658–660. doi: 10.1038/ng.627. [DOI] [PMC free article] [PubMed] [Google Scholar]
- 57.Hirschfield G.M., Liu X., Han Y., Gorlov I.P., Lu Y., Xu C., Lu Y., Chen W., Juran B.D., Coltescu C. Variants at IRF5-TNPO3, 17q12-21 and MMEL1 are associated with primary biliary cirrhosis. Nat. Genet. 2010;42:655–657. doi: 10.1038/ng.631. [DOI] [PMC free article] [PubMed] [Google Scholar]
- 58.Stahl E.A., Raychaudhuri S., Remmers E.F., Xie G., Eyre S., Thomson B.P., Li Y., Kurreeman F.A., Zhernakova A., Hinks A., BIRAC Consortium. YEAR Consortium Genome-wide association study meta-analysis identifies seven new rheumatoid arthritis risk loci. Nat. Genet. 2010;42:508–514. doi: 10.1038/ng.582. [DOI] [PMC free article] [PubMed] [Google Scholar]
- 59.Anderson C.A., Boucher G., Lees C.W., Franke A., D'Amato M., Taylor K.D., Lee J.C., Goyette P., Imielinski M., Latiano A. Meta-analysis identifies 29 additional ulcerative colitis risk loci, increasing the number of confirmed associations to 47. Nat. Genet. 2011;43:246–252. doi: 10.1038/ng.764. [DOI] [PMC free article] [PubMed] [Google Scholar]
- 60.Hirschfield G.M., Liu X., Xu C., Lu Y., Xie G., Lu Y., Gu X., Walker E.J., Jing K., Juran B.D. Primary biliary cirrhosis associated with HLA, IL12A, and IL12RB2 variants. N. Engl. J. Med. 2009;360:2544–2555. doi: 10.1056/NEJMoa0810440. [DOI] [PMC free article] [PubMed] [Google Scholar]
- 61.Sun J., Matthias G., Mihatsch M.J., Georgopoulos K., Matthias P. Lack of the transcriptional coactivator OBF-1 prevents the development of systemic lupus erythematosus-like phenotypes in Aiolos mutant mice. J. Immunol. 2003;170:1699–1706. doi: 10.4049/jimmunol.170.4.1699. [DOI] [PubMed] [Google Scholar]
- 62.International Multiple Sclerosis Genetics Conssortium (IMSGC) IL12A, MPHOSPH9/CDK2AP1 and RGS1 are novel multiple sclerosis susceptibility loci. Genes Immun. 2010;11:397–405. doi: 10.1038/gene.2010.28. [DOI] [PMC free article] [PubMed] [Google Scholar]
- 63.Peluso I., Pallone F., Monteleone G. Interleukin-12 and Th1 immune response in Crohn's disease: Pathogenetic relevance and therapeutic implication. World J. Gastroenterol. 2006;12:5606–5610. doi: 10.3748/wjg.v12.i35.5606. [DOI] [PMC free article] [PubMed] [Google Scholar]
- 64.Remmers E.F., Plenge R.M., Lee A.T., Graham R.R., Hom G., Behrens T.W., de Bakker P.I., Le J.M., Lee H.S., Batliwalla F. STAT4 and the risk of rheumatoid arthritis and systemic lupus erythematosus. N. Engl. J. Med. 2007;357:977–986. doi: 10.1056/NEJMoa073003. [DOI] [PMC free article] [PubMed] [Google Scholar]
- 65.Jin Y., Birlea S.A., Fain P.R., Gowan K., Riccardi S.L., Holland P.J., Mailloux C.M., Sufit A.J., Hutton S.M., Amadi-Myers A. Variant of TYR and autoimmunity susceptibility loci in generalized vitiligo. N. Engl. J. Med. 2010;362:1686–1697. doi: 10.1056/NEJMoa0908547. [DOI] [PMC free article] [PubMed] [Google Scholar]
- 66.Hunt K.A., Zhernakova A., Turner G., Heap G.A., Franke L., Bruinenberg M., Romanos J., Dinesen L.C., Ryan A.W., Panesar D. Newly identified genetic risk variants for celiac disease related to the immune response. Nat. Genet. 2008;40:395–402. doi: 10.1038/ng.102. [DOI] [PMC free article] [PubMed] [Google Scholar]
Associated Data
This section collects any data citations, data availability statements, or supplementary materials included in this article.