

Abstract
The physiological role of the A3 adenosine receptor (AR) was explored in cardiac ischaemia, inflammatory diseases and cancer. We report a new fluorophore-conjugated human (h) A3AR antagonist for application to cell-based assays in ligand discovery and for receptor imaging. Fluorescent pyrazolo[4,3-e][1,2,4]triazolo[1,5-c]pyrimidin-5-ylamine (pyrazolo-triazolo-pyrimidine, PTP) and triazolo[1,5-c]quinazolin-5-yl)amine (triazolo-quinazoline, TQ) AR antagonists were compared. A chain-extended and click-conjugated Alexa Fluor-488 TQ derivative (MRS5449) displayed a radioligand binding Ki value of 6.4 ± 2.5 nM in hA3AR-expressing CHO cell membranes. MRS5449 antagonized hA3AR agonist-induced inhibition of cyclic AMP accumulation in a concentration-dependent manner (KB 4.8 nM). Using flow cytometry (FCM), MRS5449 saturated hA3ARs with very high specific-to-nonspecific binding ratio with an equilibrium binding constant 5.15 nM, comparable to the Kd value of 6.65 nM calculated from kinetic experiments. Ki values of known AR antagonists in inhibition of MRS5449 binding in whole cell FCM were consistent with radioligand binding in membranes, but agonist binding was 5–20 fold weaker than obtained with agonist radioligand [125I]I-AB-MECA. Further binding analysis of MRS5549 suggested multiple agonist binding states of the A3AR. Molecular docking predicted binding modes of these fluorescent antagonists. Thus, MRS5449 is a useful tool for hA3AR characterization.
Keywords: purines, fluorescence, G protein-coupled receptor, A3 adenosine receptor, flow cytometry
1. Introduction
Activation of the Gi protein-coupled A3 adenosine receptor (AR) is associated with anticancer, antiischemic and antiinflammatory effects, and clinical trials of several prototypical selective agonists are underway [1,2]. A3AR antagonists are being examined as promising agents for the treatment of glaucoma [3,4]. Characterization of the A3AR in tissues and assays to establish a structure-activity relationship (SAR) of newly synthesized compounds for drug discovery, as for many other G protein-coupled receptors (GPCRs), is often dependent on the use of high affinity radioligands [5]. Fluorescent agonists and antagonists of GPCRs have been studied as molecular probes for binding experiments [6–8]. Recently, several 4,4-difluoro-4-bora-3a,4a-diaza-sindacene (BODIPY) derivatives have been reported as fluorescent ligands of the ARs, including the A3AR [9,10], and used to study receptor complexes. However, these fluorescent tracers are relatively nonselective within the AR family.
Receptor-selective fluorescent ligands are used increasingly as tools for the study of receptor physiology and pathophysiology at the cellular and even the subcellular level [7]. Furthermore, they are being investigated as screening tools in drug discovery [6]. In both cases, techniques employing receptor-selective fluorescent ligands have proved to be complementary to, and in several cases even superior to, the traditional radioligand-based techniques. Increasing costs and public concerns associated with radioactive isotope handling and disposal are also making the use of fluorescent ligands more attractive in research and diagnostics. With the increasing importance of GPCRs in pharmacology and the search for newer, more potent and/or selective receptor ligands and drugs, there is an accompanying need for the design and development of novel highly potent and selective fluorescent ligands. Such ligands will likely aid in the investigation of the physiological and pathophysiological functions of GPCRs and also in the development of drugs acting specifically at these receptors.
We recently introduced a versatile ligand for fluorescence polarization (FP) studies of the A2AAR, the fluorophore-conjugated tricyclic derivative MRS5346 [11]. This ligand was selective for that AR subtype and was not suitable for measurements of the A3AR due to low affinity. In this study, we have explored the SAR of chain-elongated derivatives of known AR antagonists, including the pyrazolo[4,3-e][1,2,4]triazolo[1,5-c]pyrimidin-5-ylamine class (designated here as pyrazolo-triazolo-pyrimidine, PTP), already reported to display A3AR selectivity [12]. We also prepared a fluorescent derivative of the closely related triazolo[1,5-c]quinazolin-5-yl)amine class (designated here as triazolo-quinazoline, TQ), of which the potent, but nonselective AR antagonist (N-[9-chloro-2-(2-furanyl)[1,2,4]triazolo[1,5-c]quinazolin-5-amine (CGS15943, 7, Figure 1) is a member [13,14]. We discovered that an Alexa Fluor-488 derivative (MRS5449, 9) of a TQ antagonist, in which the fluorophore was coupled to an extended chain using a click reaction [15], displayed high affinity at the human (h) A3AR and was suitable as a molecular probe in flow cytometry (FCM) studies.
Figure 1.

The chemical structures of fluorescent (A) PTP and (B) TQ derivatives. The route to synthesis of TQ derivative MRS5449, 9 is shown. Reagents and Conditions: a) 5-hexynoic acid, EDC.HCl, DMAP, Et3N, an CH2Cl2:DMF (1:1, v/v), 81%; b) Alexa Fluor-488 5-carboxamido-(6-azidohexanyl) bis(triethylammonium salt), aq. sodium ascorbate, aq. cupric sulfate pentahydrate solution, H2O, DMF, 26%.
FCM is a sensitive and reliable method for examining and counting fluorophore-tagged whole cells. It is routinely used in clinical practice (e.g. diagnosis of health disorders such as leukemia [16]) and has many applications in drug research (e.g. nucleic acid analysis [17]), but its application to quantitative receptor binding studies has been limited [18]. However, for quantitative molar measurements, the mean fluorescence intensity (MFI) of fluorescent small molecules bound to a cell can be measured as well, which is a relative value directly proportional to the number of receptor-bound molecules can be converted to a value of molecules of equivalent soluble fluorochrome (MESF) using quantitative fluorescence calibration (QFC) [19,20]. Therefore, comparable, instrument-independent fluorescence data can be calculated using a standard to provide pharmacological parameters of the binding of a fluorescent ligand to intact cells expressing the hA3AR.
2. Materials and Methods
2.1. Materials
Alexa Fluor-488 5-carboxamido-(6-azidodhexanyl)bis(triethylammonium salt) was purchased from Invitrogen (Carlsbad, CA). [3H]R-N6-(2-phenylisopropyl)adenosine ([3H]R-PIA, 42.6 Ci/mmol) was obtained from Moravek Biochemicals (Brea, CA). [125I]4-Amino-3-iodobenzyl-5'-N-methylcarboxamidoadenosine ([125I]I-AB-MECA, 2200 Ci/mmol), and [3H]-2-[p-(2-carboxyethyl)phenylethylamino]-5'-N-ethylcarboxamidoadenosine ([3H]CGS21680, 40.5 Ci/mmol) were purchased from Perkin Elmer (Waltham, MA). DMEM/F12 medium and 1 M Tris-HCl (pH 7.5) were purchased from Mediatech, Inc. (Herndon, VA). Adenosine deaminase, Cl-IB-MECA and NECA were from Sigma (St. Louis, MO). CGS15943, CGS21680, CPA, DPCPX, IB-MECA, MRS1220, PSB10, XAC and ZM241385 were from Tocris (Ellisville, MO). Quantum Alexa Fluor-488 MESF beads were purchased from Bangs Laboratories, Inc. (Fishers, IN). All other reagents were from Sigma-Aldrich (St. Louis, MO), unless noted, and were of analytical grade and used without further purification.
2.2. Chemical synthesis
The synthesis derivatives 1 – 6, including conjugation with fluorescein isothiocyanate, isomer 1 (FITC), will be described in detail elsewhere.
General methods
Reactions were conducted under an atmosphere of argon whenever anhydrous solvents were used. All reactions were monitored by thin-layer chromatography (TLC) using silica gel coated plates with a fluorescence indicator (Sigma-Aldrich, St. Louis, MO), which was visualized under UV light. Silica gel column chromatography was performed with silica gel (SiO2, 200–400 mesh, 60Å, Sigma-Aldrich, St. Louis, MO) using moderate air pressure. Evaporation of solvents was carried out under reduced pressure at a temperature below 40 °C. After column chromatography, appropriate fractions were pooled, evaporated and dried at high vacuum for at least 12 h to give the desired products in high purity. 1H NMR and analytical HPLC ascertained sample purity. No corrections in yield were made for solvent of crystallization. 1H NMR spectra were recorded at 400 MHz. Chemical shifts are reported in parts per million (ppm) relative to tetramethylsilane or deuterated solvent as the internal standard (δH: CDCl3 7.26 ppm). High resolution mass spectroscopic (HRMS) measurements were performed on a proteomics optimized Q-TOF-2 (Micromass-Waters) using external calibration with polyalanine. Observed mass accuracies are those expected on the basis of known performance of the instrument as well as the trends in masses of standard compounds observed at intervals during the series of measurements. Reported masses are observed masses uncorrected for this time-dependent drift in mass accuracy.
2.2.1. N-(9-Chloro-2-(furan-2-yl)-[1,2,4]triazolo[1,5-c]quinazolin-5-yl)hex-5-ynamide (8)
Compound 7 (11.2 mg, 39.2 μmol) was co-evaporated with anhydrous toluene (2 × 5 ml) and dissolved in anhydrous CH2Cl2: N,N'-dimethylformamide (1 ml, 1:1, v/v). 1-Ethyl-[3-dimethylaminopropyl]carbodiimide hydrochloride (EDC.HCl, 45 mg, 235 μmol), 5-hexynoic acid (26 μl, 235 μmol), 4-dimethylaminopyridine (2 mg, 15.6 μmol) and triethylamine (82 μl, 588 μmol) were added. The reaction mixture was stirred for 22 h whereupon it was diluted with CH2Cl2 (30 ml) and sequentially washed with brine (2 × 10 ml) and distilled water (2 ×10 ml). The organic phase was evaporated to dryness and the resulting residue purified by silica gel column chromatography (0–25% acetone in hexane, v/v) to afford compound 8 as a white solid (12.1 mg, 81%). Rf = 0.5 (30% acetone in hexane, v/v); MALDI-HRMS m/z 380.0919 ([M+H]+,C19H14N5O2Cl·H Calcd 380.0914); Selected signals:1H NMR (CDCl3) δ 9.03 (s, 1H), 8.51 (d, J = 2.3 Hz, 1H), 7.91 (d, J = 8.8 Hz, 1H), 7.76 (dd, J = 8.8 & 2.3 Hz, 1H), 7.70 (s, 1H), 7.33 (d, J = 3.5 Hz, 1H), 6.64–6.67 (m, 1H), 3.25 (t, J = 7.3 Hz, 2H), 2.42–2.48 (m, 2H), 2.03–2.13 (m, 3H). Analytical purity of compound 8 was determined using a Hewlett–Packard 1100 HPLC equipped with a Zorbax SB-Aq 5 μm analytical column (50 × 4.6 mm; Agilent Technologies Inc, Palo Alto, CA). Mobile phase: linear gradient solvent system: 5 mM TBAP (tetrabutylammonium dihydrogen phosphate)-CH3CN from 80:20 to 40:60 in 13 min; the flow rate was 0.5 ml/min. Peaks were detected by UV absorption with a diode array detector at 254, 275, and 280 nm. Purity >99% by HPLC (retention time: 10.43 min).
2.2.2. 2-(6-Amino-3-iminio-4,5-disulfonato-3H-xanthen-9-yl)-5-((6-(4-(4-((9-chloro-2-(furan-2-yl)-[1,2,4]triazolo[1,5-c]quinazolin-5-yl)amino)-4-oxobutyl)-1H-1,2,3-triazol-1-yl)hexyl)carbamoyl)benzoate (9, MRS5449)
A solution of Alexa Fluor-488 5-carboxamido-(6-azidohexanyl)bis(triethylammonium salt) (0.5 mg, 0.58 μmol, Invitrogen-Life Technologies, Grand Island, NY) in H2O (200 μl) was added to a solution of alkyne 8 (0.44 mg, 1.1 μmol) in N,N'-dimethylformamide (100 μl). A freshly prepared solution of aqueous sodium ascorbate (0.1 M, 8 μl, 5.86 μmol) was added to the reaction mixture followed by addition of aqueous cupric sulfate pentahydrate solution (0.1 M, 2.94 μl, 0.29 μmol). The resulting mixture was stirred overnight at room temperature; 10 mM aqueous solution of triethylammonium acetate buffer (2 ml) was added with constant mixing. The resulting mixture was lyophilized and purified by HPLC with a Luna 5μ RP-C18 semipreparative column (250 × 10.0 mm; Phenomenex, Torrance, CA) under the following conditions: flow rate of 2 ml/min; H2O-CH3CN from 100:0 (v/v) to 0:100 (v/v) in 30 min and isolated at 20.07 min to get Alexa Fluor-488 conjugate 9 (0.16 mg, 27%). ESI-HRMS m/z 1036.1957 [M + Na]+, C46H38N11O12S2Cl·H+: Calcd. 1036.1910. Analytical purity >99% by HPLC (retention time: 10.13 min).
2.3. Cell cultures and membrane preparation
Chinese hamster ovary (CHO) cells without heterologous AR expression were grown in DMEM/F12 (1:1) medium with 10% FBS, 2 mM L-glutamine, 50 U/ml penicillin/streptomycin. CHO cells expressing the A1 or A3 AR and HEK293 cells expressing the A2AAR were grown in the same medium but in the presence of 500 μg/ml hygromycin B and 800 μg/ml of G418, respectively. Cells, used for FCM analysis, were grown in 6-well plates (approximately 400,000 cells/well) and incubated at 37 °C for 24 h in the presence of 5% CO2. When the confluency of the cells reached 80% (approximately 106 cells/well), medium was replaced with fresh medium and MRS5449 was added in the presence or absence of competitive antagonists, and cells were processed for FCM.
For cell cultures used in radioligand binding assays, after harvest and homogenization, the cells were centrifuged at 200 × g for 10 min, and the pellet was resuspended in 50 mM Tris-HCl buffer (pH 7.5), containing 10 mM MgCl2. The suspension was homogenized with an electric homogenizer for 10 s and was then recentrifuged at 20,000 × g for 20 min at 4 °C. The resultant membrane pellets were resuspended in buffer in the presence of 3 units/ml adenosine deaminase, and the suspension was stored at −80°C until the binding experiments. The protein concentration was measured using the Bradford assay [21].
2.4. Radioligand membrane binding assays
Radioligand binding assays at hA1, hA2A, and hA3ARs were performed according to the procedures described previously [22] using the radiolabeled agonists [3H]R-PIA from Moravek Biochemicals (Brea, CA) or [3H]CGS21680 and [125I]I-AB-MECA from PerkinElmer (Waltham, MA) for the hA1, hA2AAR, and hA3AR assays, respectively.
2.5. Cyclic AMP accumulation assay
CHO cells stably expressing the hA3AR were seeded in 24-well plates and incubated at 37°C overnight. The medium was removed the following day and replaced with DMEM containing 50 mM HEPES, 10 μM rolipram, 3 units/ml adenosine deaminase (Worthington Biochemical Corp., Lakewood, NJ), and increasing concentrations of agonists and incubated for 30 min. Forskolin (10 μM) was added and incubated for an additional 15 min. The medium was removed, and the cells were lysed with 200 μL of 0.1 M HCl. 100 μl of the HCl solution was used in the Sigma Direct cAMP Enzyme Immunoassay following the instructions provided with the kit. The OD values were measured with a SpectraMax M5 Microplate reader (Molecular Devices, Sunnyvale, CA) at 405 nm.
2.6. Fluorescence microscopy experiments
CHO cells stably expressing the hA3AR were grown on sterile coverslips in 6-well plates, and experiments were performed when the cells reach 70% confluency after refreshing the medium. The cells were incubated with 50 nM MRS5449 for different time intervals from 15 min to 3 h at 37 °C in an atmosphere containing 5% CO2. At the end of each time interval, the medium was removed, and cells were washed three times with ice-cold PBS (Crystalgen, Commack, NY). The coverslips containing the cells were placed on sterile slides, and the cells were observed under a Zeiss AxioCam MRm fluorescence microscope (Carl Zeiss, Inc., Thornwood, NY).
2.7. Fluorescent ligand binding in intact CHO cells expressing the A3AR
In preliminary binding experiments of compounds 1–6 and MRS5449 were incubated with CHO cells expressing the hA3AR for 1 h at 37°C in an atmosphere containing 5% CO2. The concentrations used were incubated with 1.5 μM 1, 5 μM 2, 1.5 μM 3, 10 μM 4, 20 μM 5, 15 μM 6, or 10 nM MRS5449. For further binding experiments with MRS5449, control CHO cells (CHO cells without heterologous receptor expression) and CHO cells expressing hA3AR were incubated with 10 nM MRS5449 for 3 h.
In saturation binding experiments, CHO cells expressing the hA3AR were incubated with concentrations of MRS5449 ranging from 2.5 nM to 250 nM for 1 h. To study binding kinetics of MRS5449, we incubated CHO cells expressing the hA3AR with 10 nM MRS5449 for different time intervals from 5 min to 3 h. The association and dissociation rate was measured as follows: 10 nM MRS5449 was added to CHO cells expressing the A3AR and measured total binding at different time intervals. After 90 min, we initiated dissociation by adding 10 μM of non-fluorescent A3AR antagonist MRS1220 and then measured the dissociation at different time intervals.
To determine binding affinities of known AR ligands using MRS5449 as a tracer, hA3AR-expressing CHO cells were incubated with different concentrations of ligands in the presence of 5 nM MRS5449 for 90 min. Total binding was measured in the absence of the competitor. Nonspecific binding was determined in the presence of 10 μM MRS1220.
At the end of each time interval, the medium was removed and cells were washed three times with ice-cold DPBS. After washing, 1 ml 0.2 % EDTA solution was added to each well, and cells were incubated at 37 °C for 7 min. Following cell detachment, 1 ml medium was added to each well to neutralize the EDTA. The cell suspensions were transferred to polystyrene round-bottom BD Falcon tubes (BD, Franklin Lakes, NJ) and centrifuged for 5 min at 23 °C and 400×g. After centrifugation, the supernatant was discarded, and cells were washed with 3 ml PBS and centrifuged again at 23 °C and 400×g for 5 min. After discarding the supernatant, cells were suspended in 0.5 ml PBS and analyzed by FCM.
2.8. FCM calibration
A measurable intrinsic parameter of a fluorescent ligand or particle is its fluorescence yield, which can be expressed as molecular equivalent values of free fluorophore in solution (MESF). Standard particles suspensions with assigned MESF values, e.g. Quantum Alexa Fluor-488 MESF beads (Bangs Laboratories, Inc., Fishers, IN), establish an instrument-independent scale that accurately depicts the molar quantity of fluorophores on labeled particles.
The mean fluorescence intensity (MFI) values of the standard particles were recorded under optimized instrument setting and converted into MESF values using the QuickCal program v. 2.3 (Bangs Laboratories, Inc., Fishers, IN). MFIs of receptor-bound fluorescent small molecules in this study were measured under exactly the same conditions and the assigned MESF values were extrapolated from the calibration curve. Further details of MESF calibration can be found in Supporting Information.
2.9. FCM analysis
The intensity of fluorescence emission of each sample was measured by using FCM. Cell suspensions were vortexed briefly before analysis on a Becton and Dickinson FACSCalibur flow cytometer (BD, Franklin Lakes, NJ) with excitation at 488 nm. Samples were maintained in the dark during the analysis to avoid photobleaching. MFIs were obtained in the FL-1 channel in log mode. Ten thousand events were analyzed per sample. Data were collected using Cell Quest Pro software (BD, Franklin Lakes, NJ) and analyzed by Cyflogic v. 1.2.1 software (CyFlo, Ltd., Turku, Finland).
2.10. Data analysis
Data analysis was performed with the Prism 5 (GraphPad, San Diego CA) software. The mean autofluorescence of CHO cells was measured in the absence of the fluorescent ligand. The mean fluorescence in the presence of fluorescent ligand was corrected by subtracting this value [23]. Further details of data analysis can be found in Supporting Information.
2.11. Molecular modeling
We used our recently built homology model of the hA3AR [24], based on the crystallographic structure of an antagonist-bound hA2AAR [25], to identify the hypothetical binding modes of the new fluorescent derivatives.
In particular, a two-step approach has been used due to the large conformational flexibility of these ligands. In the first step, molecular docking simulations were performed using both PTP and TQ scaffolds only derivatized through the exocyclic amine with a C4-alkyl chain (i.e. n-butyl for PTP and n-butanoyl for TQ) that does not include the corresponding fluorophores. Molecular docking studies have been carried out at the hA3AR binding site using the docking software Gold (version 5.1) [26]. The electrostatic and hydrophobic contributions to the interaction energy of each receptor residue involved in the binding with these fragments were calculated using the software MOE (version 2010.10) [27].
Starting from top-scoring poses of both PTP and TQ simplified analogs, the complete ligands linked to the corresponding fluorophores were constructed by elongating the C4-alkyl spacer in the direction of the extracellular environment. Finally, an exhaustive conformational analysis of the fluorescent ligands along with extracellular loop 2 (EL2) of the protein (starting from Asn150 to Gln167) was performed, using the LowMode MD search method implemented in MOE [28]. Detailed information regarding molecular modeling methodologies is provided in Supporting Information.
3. RESULTS
3.1. Synthesis and characterization of fluorescent AR antagonists
3.1.1. Synthetic approaches
Known heterocyclic antagonists of the A3AR of high affinity were derivatized through the exocyclic amine with chemically functionalized chains and conjugated to fluorophores of the fluorone class. PTP derivatives of varying chain length 1 – 6 were prepared by coupling FITC to various chain-extended alkyl amino derivatives, in which the anchoring point was the exocyclic amine common to many structural classes of AR antagonists. FITC was used previously in a fluorescent agonist conjugate designed for binding to the A2AAR [29]. Derivatives 2 – 4 contained homologous n-alkyl spacer chains, and 5 and 6 contained multiple ether linkages. The shortest member of the series, 1, is a hydrazino derivative with no alkyl spacer chain, and the longest member, 6, contains a spacer chain of 13 atoms.
As an alternative to the known, generally A3AR-selective PTP scaffold, we explored the use of the TQ scaffold. It is known that acylations at the exocyclic amine of a nonselective triazolo[1,5-c]quinazolin-5-yl)amine AR antagonist, CGS15943, provide varying degrees of A3AR selectivity [14]. We also used an alternate coupling approach of click chemistry to label the scaffold with an analogue of fluorescein, i.e. the fluorophore Alexa Fluor-488, as was used in our previous FP study of the A2AAR [11]. Its spectral properties are nearly identical to those of fluorescein, over which it has many advantages for FCM experiments, e.g. photostability, brightness, relative pH-insensitivity and a relatively high Stokes shift.
Click chemistry is a facile means of combining two chemical moieties, even if divergent in molecular weight or chemical properties [15]. We have adapted the most commonly used form of click chemistry here for the synthesis of TQ derivative MRS5449, i.e. copper(I) catalyzed 3+2 cycloaddition of an azide and a terminal alkyne group [15]. This reaction forms a triazole linkage, which is expected to be more chemically stable than the thiourea group present in the PTP derivatives 1 – 6 and also makes it possible to interact with potential aromatic binding residues in the outer region of the receptor binding pocket [25].
In order to introduce the handle with a spacer arm for attachment of the Alexa Fluor-488 fluorophore, commercially available compound 7 (CGS15943) was initially condensed with 5-hexynoic acid using EDC to obtain the terminal alkyne derivative 8 in 80% yield. The fluorophore was attached to the terminal alkyne of compound 8 using click reaction conditions to obtain target conjugate MRS5449 in a yield of 26%.
3.1.2. Pharmacological and spectral characterization of newly synthesized AR antagonist ligands
The binding affinity of these derivatives at three subtypes of hARs was determined using standard radioligand binding methods, and the Ki values are shown in Table 1. The binding affinities of the conjugates 1 – 6 show that roughly μM affinity was not exceeded at three AR subtypes. The most potent hA3AR ligands in the group of PTP derivatives were 1 and 3 with Ki values of 780 and 720 nM, respectively, in a binding assay using [125I]I-AB-MECA as a radioligand. The hA3AR binding of TQ derivative MRS5449 displayed a Ki value of 6.4 nM (Figure 2A). The affinity of MRS5449 at two other ARs was lower; at hA1 and hA2AARs, the Ki values in inhibition of radioligand binding were 87 nM and 73 nM, respectively. Thus, the selectivity for the A3AR was over 10-fold. The effect of chain extension at the exocyclic amine of 7, as found in 8 or when terminated in a click-conjugated fluorophore in MRS5449, was to greatly reduce hA1 and hA2AAR affinity while maintaining nearly identical A3AR affinity. Moreover the conjugation of the fluorophore increased the hA3AR affinity.
Table 1.
Binding affinity of a series of fluorescent AR antagonist derivatives at three subtypes of hARs.a
| Compound | A1 | A2A | A3 |
|---|---|---|---|
| Ki (nM) or % Inhibition | Ki (nM) or % Inhibition | Ki (nM) or % Inhibition | |
| 1 | 9500b | 920±110 | 780b |
| 2 | (5±2%) | 2480±420 | 2390±660 |
| 3 | (7±5%) | 460±60 | 720±70 |
| 4 | (9±5%) | 1750±470 | 5660±610 |
| 5 | (0 %) | (30±6%) | 9390±1730 |
| 6 | (0 %) | 6010±420 | 7090±370 |
| 7 | 3.5 | 1.2 | 35 |
| 8 | 170±40 | 51.0±10.0 | 33.5±10.1 |
| 9 c | 87.0±24.0 | 73.0±8.0 | 6.4±2.5 |
All experiments were done on CHO (A1 and A3ARs) or HEK293 (A2AAR) cells stably expressing one of three subtypes of hARs. The binding affinity for A1, A2A and A3ARs was expressed as Ki values (n = 3–5, unless noted) and was determined by using agonist radioligands ([3H]R-PIA; [3H]CGS21680; or [125I]I-AB-MECA; respectively), unless noted. A percent in parentheses refers to inhibition of radioligand binding at 10 μM, unless noted. Binding data for CGS15943 7 were taken from literature reports [5]. IC50 values were converted to Ki values as reported [32].
duplicate determination.
9, MRS5449.
Figure 2.


A) Displacement by MRS5449 of radioligand binding to membrane preparations from CHO and HEK293 cells stably expressing hARs. Results are from one experiment representative of three independent experiments performed in duplicate. The Ki values from three experiments are listed in Table 1. B) Rightward-shift by MRS5449 of the concentration-response curve of the A3AR agonist Cl-IB-MECA in inhibition of forkolin-stimulated cyclic AMP production in CHO cells expressing the A3AR. C) Schild analysis of the effect of the fluorescent antagonist MRS5449 on inhibition of cyclic AMP accumulation induced by the A3AR agonist Cl-IB-MECA in CHO cells expressing the A3AR. The KB value was calculated to be 4.8 nM.
In a functional assay of cyclic AMP accumulation in CHO cells expressing the A3AR, MRS5449 concentration-dependently antagonized the effects of A3AR agonist Cl-IB-MECA (Figure 2B) corresponding to a KB value of 4.8 nM (Figure 2C). MRS5449 displayed excitation and emission peaks at 494 and 523 nm, respectively. Fluorescent characterization of the conjugates 1 – 6 is available in Supporting Information.
In preliminary FCM experiments, the binding affinity of compounds 1–6 and MRS5449 at the hA3AR expressed on CHO cells was measured by recording MFI values of the cell-fluorescence in the presence of small molecule conjugates and converting them into MESF values. However, conjugates 1 – 6 resulted in very low fluorescence emission, and only MRS5449 produced a sufficiently high MFI for further investigations in fluorescent experiments, even at 250 to 1000-fold lower concentration than compounds 1 – 6 (Figure 3). Compared with the binding to the A3AR (expressed as 100%), the respective binding of MRS5449 to CHO cells expressing the A1AR and HEK cells expressing the A2AAR was only 0.3% and 0.5%.
Figure 3.

Fluorescence ligand binding experiments with compound 1 – 6 and MRS5449 with FCM. hA3AR-expressing CHO cells were incubated with fluorescent small molecule conjugates were used in a concentration approximately two times higher than its Ki values, and mean fluorescence intensities (MFI) of the cell-small molecule conjugates were measured with FACSCalibur flow cytometer. MFI values were converted into MESF values using QuickCal program v. 2.3 after correcting for autofluorescence. Percentages above each column show the brightness of each compound using MRS5449 set at 100%. Results are expressed as mean ± S.E. (n=3).
According to its fluorescent properties, binding affinity and selectivity at the hA3AR, MRS5449 seemed to be a preferred ligand for further examination as a fluorescent tracer in various assay modes.
3.2. Fluorescence microscopy experiments
Fluorescence micrographs showing the binding of 50 nM MRS5449 to the A3AR expressed in CHO cells at different time points are shown in Figure 4. The fluorescence was highly associated with the plasma membrane, and internalized MRS5449 did not appear to be the source of most of the fluorescence. The corresponding control experiments, performed either in the absence of MRS5449 or in its presence except with preincubation with hA3AR antagonist MRS1220 (10 μM), did not indicate any appreciable bound fluorescence. The intensity of fluorescence gradually increased over an incubation period of 15 min – 180 min.
Figure 4.
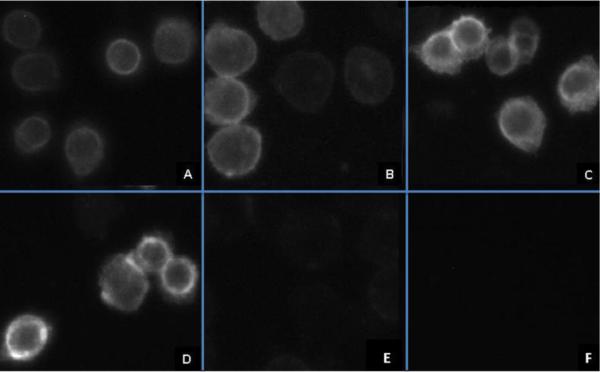
Fluorescence micrograph of CHO cells expressing the hA3AR following incubation with 50 nM MRS5449 for the time as indicated: A) 15 min; B) 60 min; C) 120 min; D) 180 min. hA3AR-expressing CHO cells preincubated with 10 μM MRS1220 (E) and hA3AR-expressing CHO cells in the absence of any fluorescence ligand (F) were used as controls, but significant cell fluorescence was not observed.
3.3. FCM assays with MRS5449
3.3.1. FCM calibration
We analyzed the fluorescence intensities of AlexaFluor-488 labeled standard beads with assigned MESF values at five different fluorescence intensity levels. This was used to establish a calibration curve to relate relative fluorescence signals to absolute fluorescence that was translated to molar concentration of the fluorophore (Figure S10, Supporting Information). By converting MFI values into MESF values based on this calibration curve, molar quantitation was accomplished.
3.3.2. Fluorescent ligand binding experiments
In a saturation binding experiment, we varied the concentration of fluorescent ligand MRS5449 from 2.5 nM to 250 nM and measured MFI of the receptor bound ligand. A saturation binding curve was obtained using MESF values, since FCM is insensitive to unbound soluble ligand (Figure 5A). As a negative control we used CHO cells expressing hA3AR in the absence of fluorescence ligand (autofluorescence). Nonspecific binding of 10 nM MRS5449 measured in the presence of 10 μM antagonist MRS1220 or 10 μM agonist Cl-IB-MECA or in control CHO cells (without heterologous receptor expression) was less than 1% of total binding. A FCM histogram of the total binding and nonspecific binding to hA3AR expressing CHO cells using MRS5449 at the suitable tracer concentration of 10 nM is shown in Figure 5B. Total binding was significantly higherthan the nonspecific binding in antagonist-treated cells, which was similar to the autofluorescence of the cells. The peak of the total binding located within the optimal window for analysis and was well separated from the levels of nonspecific binding and the autofluorescence. From the saturation curve, the equilibrium binding constant (Kd) was determined to be 5.15 ± 1.11 nM, which is similar to a Ki value of 6.4 nM obtained from radioligand binding experiments.
Figure 5.

Fluorescence binding experiments with MRS5449 using FCM in CHO cells expressing hA3AR. MFI of the cell-small molecule conjugates were measured with FACSCalibur flow cytometer. MFI values were converted into MESF values using QuickCal program v. 2.3 after correcting for autofluorescence. A) Saturation binding of MRS5449. Nonspecific binding was measured in the presence of 10 μM selective hA3AR antagonist MRS1220. The Kd value was determined to be 5.15±1.11 nM. Results are expressed as mean ± S.E. (n=3). B) Histogram of the total binding (blue), nonspecific binding (red) and autofluorescence (green) of 10 nM MRS5449 to CHO cells expressing hA3AR after 90 min incubation. The histogram represents data of one of the three independent experiments. C) Association binding kinetics of MRS5449 to CHO cells expressing hA3AR. CHO cells expressing hA3ARs were incubated with 10 nM MRS5449 for different time intervals. Nonspecific binding was measured in the presence of 10 μM MRS1220. The t1/2 for association was found to be 53 min. Results are expressed as mean ± S.E. (n=3). D) Dissociation kinetics of MRS5449. The concentration of MRS5449 used in association and the dissociation experiments was 10 nM. Dissociation was initiated after 90 min by adding 10 μM MRS1220. Kd was found to be 6.65 ± 0.55 nM. Results are expressed as mean ± S.E. (n=3).
We next determined using an FCM assay the association kinetics of the fluorescent ligand MRS5449. Figure 5C shows the time-dependent binding of 10 nM MRS5449 to the hA3AR. The t1/2 for association was found to be 53 min.
Dissociation was determined by adding 10 μM MRS1220 after equilibrium was reached (Figure 5D). The Kd value determined through association and dissociation kinetic experiments is 6.65 ± 0.55 nM, which correlated well with the equilibrium binding constant determined in a saturation binding experiment and also closely matched the Ki value in radioligand binding assays.
3.3.3. Screening of known AR ligands using MRS5449 as a tracer
Competition for fluorescent binding with known AR ligands was performed using FCM. To determine the Ki values of known ligands, we used MRS5449 as a tracer, at a concentration of 5 nM (close to its Kd value). Competitive binding results with known agonists and chemically diverse antagonists are shown in Figure 6A and Table 2. The observed pharmacology of antagonists in this whole cell FCM assay corresponded to that previously observed for the hA3AR. However, Ki values of known AR agonists in inhibition of MRS5449 binding were roughly 5–20 fold weaker than in agonist radioligand binding experiments in membranes. A further detailed examination of the displacement curve of Cl-IB-MECA for the antagonist fluorescent ligand MRS5449 suggests that multiple agonist binding states of the hA3AR can be demonstrated (Figure 6B). Analysis the binding curve with a two-site binding model shows that Cl-IB-MECA binds to a high-affinity binding component corresponding to a Ki value 0.1 nM, i.e. closer to the Ki value determined using an agonist radioligand [33]. A low affinity binding component for Cl-IB-MECA was determined to correspond to a Ki value of 136 nM (Figure 6B).
Figure 6.


A) Test of known AR ligands (MRS1220, Cl-IB-MECA, NECA and DPCPX). Competitive binding assay was performed using CHO cells expressing the hA3AR incubated with 5 nM MRS5449 and increasing concentrations of the adenosine receptor ligands for 90 min at 37 °C. The Ki values are (nM): 3.46 ± 0.8; 27.7 ± 6.3; 149 ± 13 and 1320 ± 60; respectively. Results are expressed as mean ± S.E. (n=3). B) Detailed displacement curve of Cl-IB-MECA using MRS5449 as a tracer. Competitive binding assay was performed using CHO cells expressing hA3AR incubated with 5 nM MRS5449 and increasing concentrations of the Cl-IB-MECA for 90 min at 37 °C. The displacement curve can be best fitted in a two-site model. Results are expressed as mean ± S.E. (n=2).
Table 2.
Inhibition of A3AR binding of known AR agonists and antagonists using MRS5449 as a FCM tracer in whole cells.
| Compound (selectivity) | hA3AR radioligand binding, Ki (nM)a | FCM binding at hA3AR, Ki (nM) |
|---|---|---|
| Agonists | ||
| CPA | 72 | 1490±230 |
| CGS21680 | 67 | 1580±190 |
| C1-IB-MECA | 1.4 | 27.7±6.3 |
| IB-MECA | 1.8 | 10.9±1.9 |
| NECA | 25 | 149±13 |
| Antagonists | ||
| DPCPX | 3980 | 1320±60 |
| ZM241385 | 743 | 300±27 |
| MRS1220 | 0.65 | 3.46±0.8 |
| PSB-10b | 0.441 | 9.54±2.2 |
| XAC | 13.8 | 19.9±1.8 |
| CGS15943 | 35 | 16.1±6.2 |
| Theophylline | 22,300 | 29,400±1400 |
3.4. Molecular modeling studies
We performed molecular modeling studies with the aim to identify the binding modes of the newly synthesized fluorescent derivatives at the hA3AR and to understand the structural basis for the affinity enhancement of MRS5449. For these studies we used a recently built homology model of the hA3AR [24], based on the crystallographic structure of an antagonist-bound hA2AAR [25].
Due to the conformational complexity of the ligands, we applied a two-step approach consisting of molecular docking of the ligand scaffolds followed by conformational searching of fluorophore-chain fragments inside the hA3AR binding site. In the first step, molecular docking simulations were performed using both PTP and TQ scaffolds derivatized only through their exocyclic amines with a C4-alkyl chain and without including the corresponding fluorophores. Binding poses at the hA3AR of PTP and TQ simplified analogs, along with their per residue electrostatic and hydrophobic contributions graphs are reported in Supporting Information.
Interestingly, analysis of top-scoring docking poses revealed that PTP and TQ scaffolds possessed a similar binding mode in the TM region of the hA3AR. Ligands recognition occurred in the upper region of the TM bundle, and the tricyclic nuclei were surrounded by TMs 3, 5, 6, and 7 with the furyl rings directed toward TM 2. Moreover, PTP and TQ scaffolds showed similar crucial interactions with residues of the binding site, such as two hydrogen bonds with Asn250 (6.55) and an aromatic π-π stacking interaction with Phe168 (EL2) (see Supporting Information). These observed similar interaction patterns were confirmed by the analysis of calculated electrostatic and hydrophobic contributions to the interaction energy of each receptor residue involved in the binding with these fragments. Comparison of these contributions for the two binding poses pointed out high similarities with only slight differences. In fact, favorable electrostatic contributions to the binding energy were stronger for the PTP fragment binding pose, while favorable hydrophobic contributions to the binding energy were stronger for the TQ fragment binding pose (see Supporting Information).
Starting from the top-scoring pose of each of the PTP and TQ simplified analogs, the corresponding complete ligands linked to the corresponding fluorophores were constructed by elongating the C4-alkyl spacer in the direction of the extracellular environment. Afterwards, an exhaustive conformational analysis of the fluorescent ligands along with EL2 of the protein (starting from Asn150 to Gln167) was performed, using the LowMode MD search method implemented in MOE [28].
Structures of the other ELs of the hA3AR (EL1, EL3) were kept fixed, while conformational search was performed for EL2, because it consists of a long sequence, and its conformation is consequently highly uncertain in the model.
Therefore, this procedure allowed us to explore the conformations of the fluorophore-chain fragments that have the most favorable interactions with EL2 and with the outer part of the binding site. Detailed binding conformations at the hA3AR of MRS5449 and compound 3 obtained after LowMode MD search are reported in Supporting Information. However, a schematic representation of these two ligand-receptor complexes, embedded in a solvated lipid bilayer simulating the cell membrane, is displayed in Figure 7. Analysis of the obtained conformations showed that compound 3 was able to form only a few interactions with the residues at the entrance of the hA3AR binding site, but was unable to interact with residues of EL2. This seemed to be due to the insufficient length of the chain departing from the exocyclic amine that precluded the fluorophore reaching and interacting with the tip of EL2.
Figure 7.
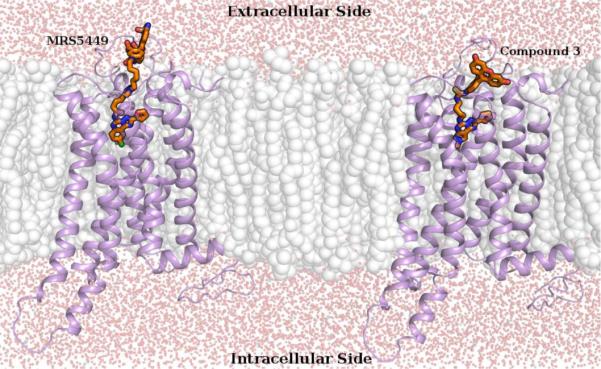
Hypothetical binding conformations at the hA3AR model of MRS5449 (on the left) and compound 3 (on the right), obtained after molecular modeling studies. Ligand-receptor models are embedded in a solvated lipid bilayer, simulating the cell membrane, and are viewed through a cross-section of the plasma membrane.
On the contrary, the Alexa Fluor-488 fluorophore of MRS5449 strongly interacted, mainly through its amino and sulfonate groups, with several residues of EL2, including His158, Arg159, Asn160, Ser165 and Gln167. It is to be noted that, given the flexible nature of EL2, the highly uncertain conformation of the EL region in the model and the flexible nature of the ligand linker, it is difficult to identify a detailed and robust binding mode for these fluorescent ligands. However, the performed conformational search highlighted important differences in the interactions of compound 3 and MRS5449 with the outer region of the hA3AR binding site.
Therefore, considering the results of this computational analysis, we can speculate that both the increased chain length and the extra functionality on the fluorophore of MRS5449 seemed to establish a more favorable interaction of this conjugate with the hA3AR and its higher affinity in comparison to PTP derivatives 1–6. As shown in Figure 7, the Alexa Fluor-488 fluorophore of MRS5449, thanks to appropriate length of its linker, was located in the outer loop area of the hA3AR, entirely outside of the TM region Thus, this ligand displayed excellent structural features for its application as a fluorescent probe in pharmacological experiments to characterize the hA3AR.
4. DISCUSSION
We have shown that the bivalent ligand MRS5449, containing a high affinity antagonist moiety coupled to a widely used fluorophore, can serve as a receptor subtype-selective molecular probe for FCM experiments on intact cells expressing the hA3AR. This now adds to a growing list of fluorescent probes for the ARs [9–11,29]. Although the selectivity in comparison to the hA1AR and hA2AAR was only moderate, it seemed sufficient to provide a selective FCM signal corresponding to the hA3AR. We have not evaluated this molecular probe at ARs in other species, but it is expected that the affinity at the rat and mouse A3AR will be considerably lower based on known SAR of the TQ series at ARs [12].
Thus, a fluorescence assay using FCM can be a useful tool in hA3AR binding studies. Compared to radioligand binding assays using isolated cell membranes and at room temperature, this FCM approach using a 37°C incubation of intact cells is a novel technique to study ARs closer to their native environment. Using MRS5449 as a tracer, the agonist-induced changes of ARs in intact cells (such as desensitization, internalization or downregulation) may be followed during the binding process. Moreover, the low nonspecific binding of MRS5449 and the high sensitivity of the FCM enables this approach to be suitable for the physiological and pathophysiological characterization of hA3AR and the pharmacological characterization of its ligands.
A disadvantage of this FCM method is that it is not suitable for high throughput assay and is more technically demanding than conventional radioligand binding technique [32]. However, in studies requiring the characterization of hA3AR ligands in their native environment, the FCM method is a preferable choice.
It should be noted that in the present study, both the association and dissociation of MRS5449 were slower compared with those from radioligand binding to cell membrane preparations. It is not clear if this reflects a property of this fluorescent ligand or is a characteristic of A3AR binding in intact cells. Slow rate constants have been noted for the binding of other fluorescent GPCR ligands.
Unfortunately, none of the affinities of the PTP derivatives reached the nM range at any of the ARs. We have not directly compared the PTP scaffold with a TQ scaffold in the otherwise identical conjugate series. Therefore, we cannot establish the precise structural basis for the selectivity of MRS5449 in comparison to PTP derivatives 1 – 6. However, as shown by molecular modeling, both the chain length and the extra functionality on the fluorophore (i.e. amino and sulfonate groups) of MRS5449 are likely crucial features for the binding of this ligand at the hA3AR. According to the present study, the Alexa Fluor-488 fluorophore of MRS5449 is predicted to strongly interact with residues located at the tip of EL2 of the hA3AR, such as His158, Arg159 and Asn160.
The hA3AR is overexpressed in various forms of cancer and inflammation [1,2]. The expression level of the A3AR in peripheral blood mononuclear cells is also indicative of the disease state [34]. Therefore, a FCM approach to the characterization of the surface expression of the A3AR could be useful as a diagnostic indicator in a clinical setting.
In summary, we have developed a potent and selective fluorescent ligand, MRS5449, by conjugating the AR antagonist CGS15943 and the Alexa Fluor-488. MRS5449 has been used successfully in quantifying the hA3AR, studying receptor kinetic properties, and ligand screening in intact cells using FCM. A similar approach can be applied to develop fluorescent ligands for other AR subtypes and other GPCRs.
Supplementary Material
Acknowledgements
This research was supported by the Intramural Research Program of the NIH, National Institute of Diabetes and Digestive and Kidney Diseases. EK thanks the Hungarian-American Enterprise Scholarship Foundation (HAESF) for financial support. The work coordinated by SM was carried out with financial support from the University of Padova, Italy, and the Italian Ministry for University and Research (MIUR), Rome, Italy. SM is very grateful to Chemical Computing Group Inc. (Montreal, Quebec, Canada) for a scientific and technical partnership.
Abbreviations
- AF488
Alexa Fluor-488
- CHO
Chinese hamster ovary
- CGS15943
N-[9-chloro-2-(2-furanyl)[1,2,4]triazolo[1,5-c]quinazolin-5-amine
- CGS21680
2-[p-(2-carboxyethyl)phenylethylamino]-5′-N-ethylcarboxamido-adenosine
- Cl-IB-MECA
1-[2-chloro-6-[[(3-iodophenyl)methyl]amino]-9H-purin-9-yl]-1-deoxy-N-methyl-β-D-ribofuranuronamide
- CPA
(2R,3R,4S,5R)-2-[6-(cyclopentylamino)purin-9-yl]-5(hydroxymethyl)oxolane-3,4-diol
- DMAP
4-dimethylaminopyridine
- DMEM
Dulbecco's Modified Eagle Medium
- DMF
N,N-dimethylformamide
- DMSO
dimethyl sulfoxide
- PBS
phosphate buffered saline
- DPCPX
8-cyclopentyl-1,3-dipropylxanthine
- EDC
1-ethyl-[3-dimethylaminopropyl]carbodiimide
- EDTA
ethylenediaminetetraacetic acid
- EL
extracellular loop
- FBS
fetal bovine serum
- FCM
flow cytometry
- FITC
fluorescein isothiocyanate
- GPCR
G protein-coupled receptor
- HEK
human embryonic kidney
- [125I]I-AB-MECA
[125I]4-amino-3-iodobenzyl-5′-N-methylcarboxamidoadenosine
- IB-MECA
1-Deoxy-1-[6-[[(3-iodophenyl)methyl]amino]-9H-purin-9-yl]-N-methyl-β-D-ribofuranuronamide
- MD
molecular dynamics
- MESF
molecules of equivalent soluble fluorochrome
- MOE
Molecular Operating Environment
- MFI
mean fluorescent intensity
- MRS1220
N-[9-chloro-2-(2-furanyl)[1,2,4]-triazolo[1,5-c]quinazolin-5-yl]benzene acetamide
- MRS5346
5-((2-(2-(4-(3-(5-amino-2-(furan-2-yl)-7H-pyrazolo[4,3-e][1,2,4]triazolo[1,5-c]pyrimidin-7-yl)propyl)phenoxy)acetamido)-ethyl)carbamoyl)-2-(6-amino-3-iminio-4,5-disulfonato-3H-xanthen-9-yl)benzoate
- MRS5449
2-(6-amino-3-iminio-4,5-disulfonato-3H-xanthen-9-yl)-5-((6-(4-(4-((9-chloro-2-(furan-2-yl)-[1,2,4]triazolo[1,5-c]quinazolin-5-yl)amino)-4-oxobutyl)-1H-1,2,3-triazol-1-yl)hexyl)carbamoyl)benzoate
- NECA
5′-N-ethylcarboxamidoadenosine
- PSB10
8-ethyl-1,4,7,8-tetrahydro-4-methyl-2-(2,3,5-trichlorophenyl)-5H-imidazo[2,1-i]purin-5-one monohydrochloride
- TM
transmembrane helix
- XAC
xanthine amine congener,N-(2-aminoethyl)-2-[4-(2,3,6,7-tetrahydro-2,6-dioxo-1,3-dipropyl-1H-purin-8-yl)phenoxy]-acetamide hydrochloride
- ZM241385
4-(2-[7-amino-2-(2-furyl)[1,2,4]triazolo[2,3-a][1,3,5]triazin-5-ylamino]ethyl)phenol
Footnotes
Publisher's Disclaimer: This is a PDF file of an unedited manuscript that has been accepted for publication. As a service to our customers we are providing this early version of the manuscript. The manuscript will undergo copyediting, typesetting, and review of the resulting proof before it is published in its final form. Please note that during the production process errors may be discovered which could affect the content, and all legal disclaimers that apply to the journal pertain.
References
- [1].Ochaion A, Bar-Yehuda S, Cohen S, Barer F, Patoka R, Amital H, Reitblat T, Reitblat A, Ophir J, Konfino I, Chowers Y, Ben-Horin S, Fishman P. The anti-inflammatory target A3 adenosine receptor is over-expressed in rheumatoid arthritis, psoriasis and Crohn's disease. Cell Immunol. 2009;258:115–22. doi: 10.1016/j.cellimm.2009.03.020. [DOI] [PubMed] [Google Scholar]
- [2].Gessi S, Merighi S, Fazzi D, Stefanelli A, Varani K, Borea PA. Adenosine receptor targeting in health and disease. Expert Opin Investig Drugs. 2011;20:1591–609. doi: 10.1517/13543784.2011.627853. [DOI] [PubMed] [Google Scholar]
- [3].Wang Z, Do CW, Avila MY, Peterson-Yatorno K, Stone RA, Gao ZG, Joshi BV, Besada P, Jeong LS, Jacobson KA, Civan MM. Nucleoside-derived antagonists to A3 adenosine receptors lower mouse intraocular pressure and act across species. Exp Eye Res. 2010;90:146–54. doi: 10.1016/j.exer.2009.10.001. [DOI] [PMC free article] [PubMed] [Google Scholar]
- [4].Okamura T, Kurogi Y, Hashimoto K, Sato S, Nishikawa H, Kiryu Y, Nagao Y. Structure–activity relationships of adenosine A3 receptor ligands: new potential therapy for the treatment of glaucoma. Bioorg Med Chem Lett. 2004;14:3775–9. doi: 10.1016/j.bmcl.2004.04.099. [DOI] [PubMed] [Google Scholar]
- [5].Fredholm BB, IJzerman AP, Jacobson KA, Linden J, Müller C. Nomenclature and classification of adenosine receptors – An update. Pharmacol Rev. 2011;63:1–34. doi: 10.1124/pr.110.003285. [DOI] [PMC free article] [PubMed] [Google Scholar]
- [6].Middleton RJ, Kellam B. Fluorophore-tagged GPCR ligands. Curr Opin Chem Biol. 2005;9:517–25. doi: 10.1016/j.cbpa.2005.08.016. [DOI] [PubMed] [Google Scholar]
- [7].Kuder K, Kiec-Kononowicz K. Fluorescent GPCR ligands as new tools in pharmacology. Curr Med Chem. 2008;15:2132–43. doi: 10.2174/092986708785747599. [DOI] [PubMed] [Google Scholar]
- [8].Bajaj A, Celic A, Ding F, Naider F, Becker JM, Dumont ME. A fluorescent α-factor analogue exhibits multiple steps on binding to its G protein coupled receptor in yeast. Biochemistry. 2004;43:13564–13578. doi: 10.1021/bi0494018. [DOI] [PubMed] [Google Scholar]
- [9].Cordeaux Y, Briddon SJ, Alexander SP, Kellam B, Hill SJ. Agonist-occupiedA3 adenosine receptors exist within heterogeneous complexes in membrane microdomains of individual living cells. FASEB J. 2008;22:850–60. doi: 10.1096/fj.07-8180com. [DOI] [PubMed] [Google Scholar]
- [10].Corriden R, Stoddart L, Hill S, Briddon S. Using the fluorescent antagonist, XAC-X-BY630 to quantify antagonist-adenosine A3 receptor complexes in membrane microdomains of single living cells. Proc. Brit. Pharmacol. Soc. 2009;7 Abstract 086P. http://www.pA2online.org/abstracts/Vol7Issue4abst086P.pdf. [Google Scholar]
- [11].Kecskés M, Kumar TS, Yoo L, Gao ZG, Jacobson KA. Novel Alexa Fluor-488 labeled antagonist of the A2A adenosine receptor: Application to a fluorescence polarization-based receptor binding assay. Biochem Pharmacol. 2010;80:506–11. doi: 10.1016/j.bcp.2010.04.027. [DOI] [PMC free article] [PubMed] [Google Scholar]
- [12].Baraldi PG, Cacciari B, Romagnoli R, Spalluto G, Moro S, Klotz KN, Leung E, Varani K, Gessi S, Merighi S, Borea PA. Pyrazolo[4,3-e]1,2,4-triazolo[1,5-c]pyrimidine derivatives as highly potent and selective human A3 adenosine receptor antagonists: influence of the chain at the N8 pyrazole nitrogen. J Med Chem. 2000;43:4768–80. doi: 10.1021/jm001047y. [DOI] [PubMed] [Google Scholar]
- [13].Ghai G, Francis JE, Williams M, Dotson RA, Hopkins MF, Cote DT, Goodman FR, Zimmerman MB. Pharmacological characterization of CGS 15943A: a novel nonxanthine adenosine antagonist. J Pharmacol Exp Therap. 1987;242:784–90. [PubMed] [Google Scholar]
- [14].Kim YC, Ji XD, Jacobson KA. Derivatives of the triazoloquinazoline adenosine antagonist (CGS15943) are selective for the human A3 receptor subtype. J Med Chem. 1996;39:4142–8. doi: 10.1021/jm960482i. [DOI] [PMC free article] [PubMed] [Google Scholar]
- [15].Moses JE, Moorhouse AD. The growing applications of click chemistry. Chem Soc Rev. 2007;36:1249–62. doi: 10.1039/b613014n. [DOI] [PubMed] [Google Scholar]
- [16].Weng K, Xie X, Qiu G, Gu W. Clinical reagents of GM-CSF and IFN-α induce the generation of functional chronic myeloid leukemia dendritic cells in vitro. Cytotechnology. 2012 Sep 22;64:75–81. doi: 10.1007/s10616-011-9393-2. [DOI] [PMC free article] [PubMed] [Google Scholar]
- [17].Oertel S, Thiemann M, Richter K, Weber KJ, Huber PE, Lopez Perez R, Brons S, Bischof M, Kulozik AE, Ehemann V, Debus J, Blattmann C. Combination of suberoylanilide hydroxamic acid with heavy ion therapy shows promising effects in infantile sarcoma cell lines. Radiat Oncol. 2011;6:119. doi: 10.1186/1748-717X-6-119. [DOI] [PMC free article] [PubMed] [Google Scholar]
- [18].Simons PC, Shi M, Foutz T, Cimino DF, Lewis J, Buranda T, Lim WK, Neubig RR, McIntire WE, Garrison J, Prossnitz E, Sklar LA. Ligand-receptor-G-protein molecular assemblies on beads for mechanistic studies and screening by flow cytometry. Mol Pharmacol. 2003;64:1227–38. doi: 10.1124/mol.64.5.1227. [DOI] [PubMed] [Google Scholar]
- [19].National Committee for Clinical Laboratory Standards . NCCLS Document I/LA24-A (ISBN 1-56238-543-7) Fluorescence Calibration and Quantitative Measurement of Fluorescence Intensity; Approved Guideline. [Google Scholar]
- [20].Mittag A, Tarnok A. Basics of standardization and calibration in cytometry –a review. J Biophoton. 2009;2:470–81. doi: 10.1002/jbio.200910033. [DOI] [PubMed] [Google Scholar]
- [21].Bradford MM. A rapid and sensitive method for the quantitation of microgram quantities of protein utilizing the principle of protein-dye binding. Anal Biochem. 1976;72:248–254. doi: 10.1016/0003-2697(76)90527-3. [DOI] [PubMed] [Google Scholar]
- [22].Gao ZG, Blaustein J, Gross AS, Melman N, Jacobson KA. N6-Substituted adenosine derivatives: Selectivity, efficacy, and species differences at A3 adenosine receptors. Biochem Pharmacol. 2003;65:1675–84. doi: 10.1016/s0006-2952(03)00153-9. [DOI] [PMC free article] [PubMed] [Google Scholar]
- [23].Wood JCS. Flow Cytometry Instrumentation: Establishing and Maintaining System Linearity. Current Protocols in Cytometry. 2009:1.4.1–1.4.14. doi: 10.1002/0471142956.cy0104s47. [DOI] [PubMed] [Google Scholar]
- [24].Lenzi O, Colotta V, Catarzi D, Varano F, Poli D, Filacchioni G, Varani K, Vincenzi F, Borea PA, Paoletta S, Morizzo E, Moro S. 2-Phenylpyrazolo[4,3-d]pyrimidin-7-one as a new scaffold to obtain potent and selective human A3 adenosine receptor antagonists: new insights into the receptor-antagonist recognition. J Med Chem. 2009;52:7640–52. doi: 10.1021/jm900718w. [DOI] [PubMed] [Google Scholar]
- [25].Jaakola VP, Griffith MT, Hanson MA, Cherezov V, Chien YET, Lane JR, IJzerman AP, Stevens RC. The 2.6 Angstrom crystal structure of a human A2A adenosine receptor bound to an antagonist. Science. 2008;322:1211–7. doi: 10.1126/science.1164772. [DOI] [PMC free article] [PubMed] [Google Scholar]
- [26].GOLD suite, version 5.1; software available from Cambridge Crystallographic Data Centre (12 Union Road Cambridge CB2 1EZ UK) http://www.ccdc.cam.ac.uk.
- [27].MOE (Molecular Operating Environment), version 2010.10; software available from Chemical Computing Group Inc. (1010 Sherbrooke Street West, Suite 910, Montreal, Quebec, Canada H3A 2R7) http://www.chemcomp.com.
- [28].Labute P. LowModeMD - Implicit Low Mode Velocity Filtering Applied to Conformational Search of Macrocycles and Protein Loops. J Chem Inf Model. 2010;50:792–800. doi: 10.1021/ci900508k. [DOI] [PubMed] [Google Scholar]
- [29].McCabe RT, Skolnick P, Jacobson KA. 2-[2-[4-[2-[2-[1,3-Dihydro-1,1-bis (4-hydroxyphenyl)-3-oxo-5-isobenzofuranthioureidyl]ethylaminocarbonyl]-ethyl]phenyl]ethylamino]-5'-N-ethylcarboxamidoadenosine (FITC-APEC): A fluorescent ligand for A2-adenosine receptors. J Fluoresc. 1992;2:217–23. doi: 10.1007/BF00865279. [DOI] [PMC free article] [PubMed] [Google Scholar]
- [32].Bylund DB, Toews ML. Radioligand binding methods: practical guide and tips. Am J Physiol. 1993;265:L421–9. doi: 10.1152/ajplung.1993.265.5.L421. [DOI] [PubMed] [Google Scholar]
- [33].Müller C, Jacobson KA. Recent developments in adenosine receptor ligands and their potential as novel drugs. BBA - Biomembranes. 2011;1808:1290–308. doi: 10.1016/j.bbamem.2010.12.017. [DOI] [PMC free article] [PubMed] [Google Scholar]
- [34].Gessi S, Cattabriga E, Avitabile A, Gafa' R, Lanza G, Cavazzini L, Bianchi N, Gambari R, Feo C, Liboni A, et al. Elevated expression of A3 adenosine receptors in human colorectal cancer is reflected in peripheral blood cells. Clin Cancer Res. 2004;10:5895–901. doi: 10.1158/1078-0432.CCR-1134-03. [DOI] [PubMed] [Google Scholar]
Associated Data
This section collects any data citations, data availability statements, or supplementary materials included in this article.