

Abstract
A stereotaxic brain atlas of the basal ganglia and thalamus of Macaca fascicularis presented here is designed with a surgical perspective. In this regard, all coordinates have been referenced to a line linking the anterior and posterior commissures (ac–pc line) and considering the center of the ac at the midline as the origin of the bicommissural space. The atlas comprises of 43 different plates (19 coronal levels, 10 sagittal levels and 14 horizontal levels). In addition to ‘classical’ cyto- and chemoarchitectural techniques such as the Nissl method and the acetylcholinesterase stain, several immunohistochemical stains have been performed in adjacent sections, including the detection of tyrosine hydroxylase, enkephalin, neurofilaments, parvalbumin and calbindin. In comparison to other existing stereotaxic atlases for M. fasicularis, this atlas has two main advantages: firstly, brain cartography is based on a wide variety of cyto- and chemoarchitectural stains carried out on adjacent sections, therefore enabling accurate segmentation. Secondly and most importantly, sagittal and horizontal planes are included. Sagittal planes are very useful for calculating oblique trajectories, whereas, clinical researchers engaged in neuroimaging studies will be more familiar with horizontal sections, as they use horizontal (also called “axial”) brain images in their daily routine of their clinical practices.
Keywords: Stereotaxy, Parkinson’s disease, Ventriculography, Cerebral cartography
Introduction
In the past, the usefulness of atlases available for stereotaxy in non-human primates has been limited by the way in which the horizontal zero plane was defined. When using the orbitomeatal plane (the so-called Frankfurt plane) or the Horsley–Clarke reference (10 mm dorsal and parallel to the Frankfurt plane), huge differences have been observed between existing atlases (Shanta et al. 1968; Szabo and Cowan 1984). This especially holds true when trying to calculate stereotaxic coordinates for deep brain structures, as reported elsewhere (Percheron and Lacourly 1973; Dubach et al. 1985). Given the current popularity of ventriculography-assisted surgery as well as other non-invasive imaging methods such as MRI, researchers can now rely on internal landmarks instead of cranial references for accurate primate stereotaxy. In this regard, the bicommissural plane defined as a horizontal plane linking the anterior and posterior commissures (ac–pc line) is the basic reference in modern primate stereotaxy, as is the standard for human neuroimaging (Tailarach et al. 1957; Schaltebrand and Wahren 1977; Morel 2007).
In designing a useful stereotaxic atlas for non-human primate surgery, several requirements must be considered, as summarized by Martin and Bowden (1996). Among others, these “golden rules” comprises (1) appropriate stereotaxic references for any given point within the brain, (2) complete segmentation for unambiguous representation of the boundaries of the brain nuclei, (3) comprehensive and detailed representation of brain structures and (4) usage of standardized nomenclature. In our experience, two more requirements are desirable: firstly, a modern atlas should be constructed keeping in mind at all times a surgical perspective, and therefore, all coordinates should be referenced to the ac–pc line, as the origin of the bicommisural space being the center of the anterior commissure at the midline. Secondly, we emphasize the need for technical excellence of stained sections (histochemical and immunohistochemical procedures) from which brain cartography is performed. Although existing atlases do not fulfill all these demanding criteria, several atlases do approach the ideal. The Szabo and Cowan atlas (1984) established the basis for stereotaxic surgery in Macaca fascicularis many years ago. Later on, this atlas was superseded by the seminal contribution of Martin and Bowden (1996). The Martin–Bowden atlas was published one year later in a book format by the University of Washington in Seattle (1997) and then licensed to Elsevier (Martin and Bowden 2000), the latter version included a useful CD-ROM. Unlike the Szabo-Cowan atlas, the Martin and Bowden atlas combined complete brain segmentation and exquisite drawing technique, with the use of a comprehensive nomenclature based on NeuroNames Brain Hierarchy (Bowden and Martin 1995). It is also worth noting that an excellent probabilistic atlas for the basal ganglia in macaques was published some years ago by François et al. (1996). Finally, three stereotaxic atlases of Macaca mulatta based on different concepts have been made available: one comprising of full brain segmentation based on coronal sections from Paxinos and his colleagues (2009, 2nd edition, fist edition appeared in 2000), another one containing Nissl-stained sagittal sections of the basal ganglia and thalamus (Ilinsky and Kultas-Ilinsky 2002), and the most recent atlas was designed for MRI-based stereotaxic surgery, including horizontal and coronal sections stained with several cytoarchitectonic and immunohistochemical techniques (Saleem and Logothetis, 2007).
Although the atlas of the basal ganglia and thalamus of M. fascicularis presented here is not intended to be the last word in primate stereotaxy, this is the first time brain parcellation was carried out in coronal-, sagittal- and horizontal-stained sections using a number of cyto- and chemoarchitectural techniques. The ultimate goal was to generate a useful surgical tool to improve stereotaxic accuracy, regardless of the angle of penetration for a given probe when approaching deep brain structures.
Materials and methods
The brains used in this atlas were those of three adult male M. fascicularis monkeys, each one with a different body weight (3.4, 4.9 and 9.8 kg, from which coronal, sagittal and horizontal brain sections were cut, respectively). Animal handling was conducted in accordance with the European Council Directive 86/609/EEC as well as in agreement with the Society for Neuroscience Policy on the use of animals in Neuroscience Research. The experimental design was approved by the Ethical Committee for Animal Testing of the University of Navarra (ref: 018/2008) as well as by the Department of Health from the Government of Navarra (ref: NA-UNAV-04-08).
Surgical anesthesia was induced by intramuscular injection of ketamine (5 mg/kg) and midazolam (5 mg/kg) resulting in deep anesthesia over a period of 2–3 h. Local anesthesia was implemented just before surgery by means of a 10% solution of lidocaine. Analgesia was administered with a single intramuscular injection of Finadyne (5 mg/kg) delivered at the end of the surgical procedure and repeated 24 and 48 h post-surgery. A similar schedule was followed for antibiotic delivery (ampicillin, 0.5 ml/day). After surgery, animals were kept under constant monitoring in single cages with “ad libitum” access to food and water.
Once anesthetized, each animal was placed in a stereotaxic frame (David Kopf Instruments, Tujunga, CA), equipped with elevated earbars to allow the acquisition of a lateral ventriculography without any obstruction from the side bars of the stereotaxic frame. The ventriculography consisted of the delivery of 0.3 ml of Rx contrast (Omnigraph 330×, Juste SAQF, Madrid, Spain) into the frontal horn of the right lateral ventricle. Once the Rx film was developed, both the anterior and posterior commissures, respectively, were localized. The ac–pc line (defined as a line passing through the centers of the ac and pc commissures) was then plotted and measured, and used further as a reference to ensure that the position of the head in the stereotaxic frame was parallel to the horizontal plane (Fig. 1). Adjustments were made by moving the eyebars up or down to place the bicommissural plane completely parallel to the horizontal plane of the stereotaxic frame, which were confirmed again by ventriculography.
Fig. 1.
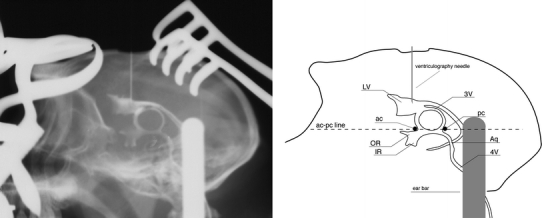
Contrast ventriculography for visualizing the intracerebral landmarks defining the bicommissural space. The zero point is defined by the center of the anterior commissure at the midline. A line linking the centers of the anterior and posterior commissures is called the ac–pc line and defines the horizontal zero plane. An orthogonal line passing through the center of the anterior commissure marks the coronal zero plane. Finally, the mediolateral zero plane is defined by a midline sagittal section of the brain. ac Anterior commissure, pc posterior commissure, LV lateral ventricle, 3V third ventricle, 4V fourth ventricle, Aq aqueduct, OR optical recess, IR infundibular recess
Immediately after surgery, animals were euthanized with an overdose of 10% chloral hydrate in distilled water and perfused transcardially. The perfusates consists of a saline Ringer solution followed by 3,000 ml of a fixative solution containing 4% paraformaldehyde and 0.1% glutaraldehyde in 0.125 M phosphate buffer (PB), pH 7.4. Perfusion was continued with 1,000 ml of a cryoprotectant solution containing 10% glycerin and 2% dimethylsulphoxide (DMSO) in 0.125 M PB, pH 7.4. Once perfusion was completed, the brains were extracted from the skull and the pial membranes were removed with the aid of small forceps. Brains were then stored for 48 h in a cryoprotectant solution containing 20% of glycerin and 2% DMSO in 0.125 M PB, pH 7.4.
Tissue processing
From each brain, ten series of adjacent frozen sections (40 µm-thick) were obtained on a sliding microtome (Microm Intl. GmbH, Walldorf, Germany) and collected in numbered containers filled with 0.125 M PB, pH 7.4, maintaining their serial order. One series of sections was mounted on gelatin-coated slides, dried, defatted and stained with thionin according to the standard Nissl method. A second series of free-floating sections was used for the histochemical stain of acetylcholinesterase (AChE), conducted according to the technique outlined by Graybiel and Ragsdale (1978) that slightly modifies the protocol issued by Geneser-Jensen and Blackstad (1971). The series of sections numbered 3–7 were used for the immunohistochemical detection of tyrosine hydroxylase, enkephalin, neurofilaments, parvalbumin and calbindin. All these immunohistochemical procedures were carried out on free-floating sections using the peroxidase-anti-peroxidase method (PAP method) that basically comprises the sequential use of a primary antibody, a bridge antibody and a PAP complex, and finally stained in brown using diaminobenzidine as the peroxidase chromogen. Once the staining procedures were completed, sections were mounted on gelatin-coated slides, dried, defatted and coverslipped with Entellan (Merck, Darmstadt, Germany). Details on the antibodies used, including commercial sources, dilutions used and incubation times are provided in Table 1. Series 8–10 were kept in the deep freezer at −80ºC for replacement purposes, if needed.
Table 1.
List of antibodies used
| Antibody name | Dilution and incubation time | Commercial source |
|---|---|---|
| Mouse anti-tyrosine hydroxylase | 1:1,000 (60 h, 4ºC) | Sigma (Ref: T2928) |
| Mouse anti-enkephalin | 1:100 (60 h, 4ºC) | Medicorp (Ref: 1018) |
| Mouse anti-neurofilaments H&M | 1:1,000 (60 h, 4ºC) | Chemicon (Ref: MAB1592) |
| Mouse anti-calbindin | 1:2,000 (60 h, 4ºC) | Sigma (Ref: C9848) |
| Rabbit anti-parvalbumin | 1:1,000 (60 h, 4ºC) | Chemicon (Ref: AB15736) |
| Mouse anti-parvalbumin | 1:1,000 (60 h, 4ºC) | Sigma (Ref: P3088) |
| Goat anti-mouse IgG | 1:50 (2 h, RT) | Dako (Ref: Z0420) |
| Donkey anti-goat IgG | 1:50 (2 h, RT) | Sigma (Ref: G-6638) |
| Swine anti-rabbit IgG | 1:50 (2 h, RT) | Dako (Ref: Z0195) |
| Goat-PAP | 1:500 (90 min, RT) | Sigma (Ref: P1901) |
| Rabbit-PAP | 1:500 (90 min, RT) | Dako (Ref: Z0113) |
| Mouse-PAP | 1:100 (90 min, RT) | Dako (Ref: P0850) |
All antisera used here were diluted in 0.05 M TBS-Tx pH 8, with 0.5% Triton X-100 (TBS-TX; Tx from Sigma). All the incubations with primary antisera were performed in the presence of 2% bovine serum albumin (Sigma)
Preparation of the atlas: photography, drawing and stereotaxic reference system
Taking photomicrographs from large brain specimens is a demanding task that is far from being fully resolved. Even by using a 0.5× apochromatic macro lens (N.A. 0.025, available from Nikon), only small areas of a monkey brain section can be properly photographed. Alternatives such as the use of X–Y motorized microscope stages, allowed for the composition of multiple snapshots onto a single digital figure with good resolution. This method, however, often resulted in large file sizes requiring a lot of computer power. Furthermore, although we initially sought the advice of professionals, the unevenly illuminated images were still a limitation. In summary, when trying to prepare good photomicrographs from large brain specimens one should find an acceptable balance between (1) optical resolution, (2) adequate illumination and (3) final file size. To the very best of our knowledge, this has only been achieved adequately by Krout et al. (2002), who used a CreoScitex EverSmart Supreme scanner (CreoScitex Americas, Bedford, MA) that affords a maximal resolution of 14,000 ppi across the entire image on a 305 × 432 mm bed. When applied to sections from rat brains, this scanning procedure is powerful enough to resolve individual DAB-stained neurons in thionin-stained sections. Due to initial unsuccessful attempts and the cost of such expensive equipment, the best choice at our disposal was to rely on a standard Agfa Arcus 1200 scanner equipped with a transparency mode. Accordingly, slides were placed coverslip-side down on the scanner bed and covered with an acetate film in which a milimetric external grid of 76 × 51 mm had been printed (this is the size of the microscope slides used for monkey brain sections). Next, under the preview mode, the area to be scanned was cropped to fit within the milimetric external grid and finally left to scan at a resolution of 2,048 × 2,048 ppi. Images obtained were transferred to Adobe Photoshop CS4 software with a fixed size of 110.7 × 156.4 mm, a resolution of 300 ppi and a manageable file size of 6.9 MB for each scanned section. Although it may seem surprising that the accompanying images were not taken with a microscope, the resolution obtained was adequate to undergo an accurate segmentation of even very small brain structures.
Digital pictures were exported to Adobe Illustrator CS4 software. This is a vectorial drawing program that allows the user to work in separate layers to create a composite, final illustration. We took advantage of this feature to create “virtual” fiducial markings through the anterior and posterior commissures (as well as the corresponding orthogonal axes) that were used for the alignment of adjacent sections. By using this procedure under the transparency mode, we were able to create a stack of brain sections, properly aligned to each other and across the stereotaxic space of reference. Once aligned, each individual layer (each containing one aligned section) was saved as an independent Adobe Illustrator file. Drawings of the structures were made with Adobe Illustrator from the central part of the AChE stained sections after applying a zoom of 178%.
Results
The primary purpose of this atlas is to serve as a surgical tool to improve accuracy during stereotaxic surgery of basal ganglia and thalamic nuclei in M. fascicularis. Keeping this surgical perspective in mind, the present atlas is composed of 43 plates (19 coronal plates, 10 sagittal plates and 14 horizontal plates). Throughout these 43 plates, up to 140 structures were identified and placed in a millimetric stereotaxic space of reference. Coronal plates (Plates 1, 2, 3, 4, 5, 6, 7, 8, 9, 10, 11, 12, 13, 14, 15, 16, 17, 18 and 19) are equally spaced (1.1 mm in between) and range rostrally from the head of the caudate nucleus to a plane located 2.2 mm caudal to the posterior commissure (at the level of the decussation of the superior cerebellar peduncle), caudally. Sagittal plates (Plates 20, 21, 22, 23, 24, 25, 26, 27, 28 and 29) are not equally spaced in an attempt to maximize the representation of key small basal ganglia structures such as the subthalamic nucleus (STh). Sagittal sections covered a mediolateral space that begins at the midline and reaches the most lateral part of the putamen at the level of the claustrum (12 mm lateral to the midline). Horizontal planes (Plates 30, 31, 32, 33, 34, 35, 36, 37, 38, 39, 40, 41, 42 and 43) are equally spaced 1.5 mm apart from each other. These plates range from the most dorsal part of the caudate nucleus down to the anatomical border between the pons and the mesencephalon, this level is identified by the posterior exit of the trochlear nerve.
Plate 1.
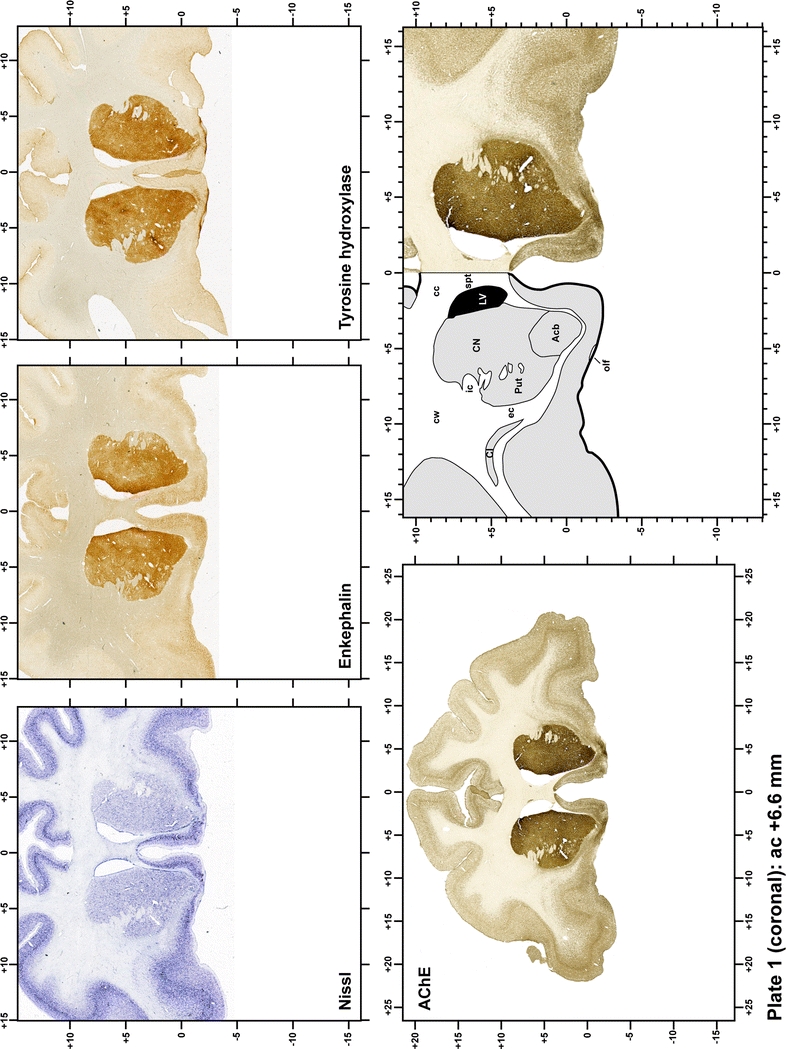
Plate 2.
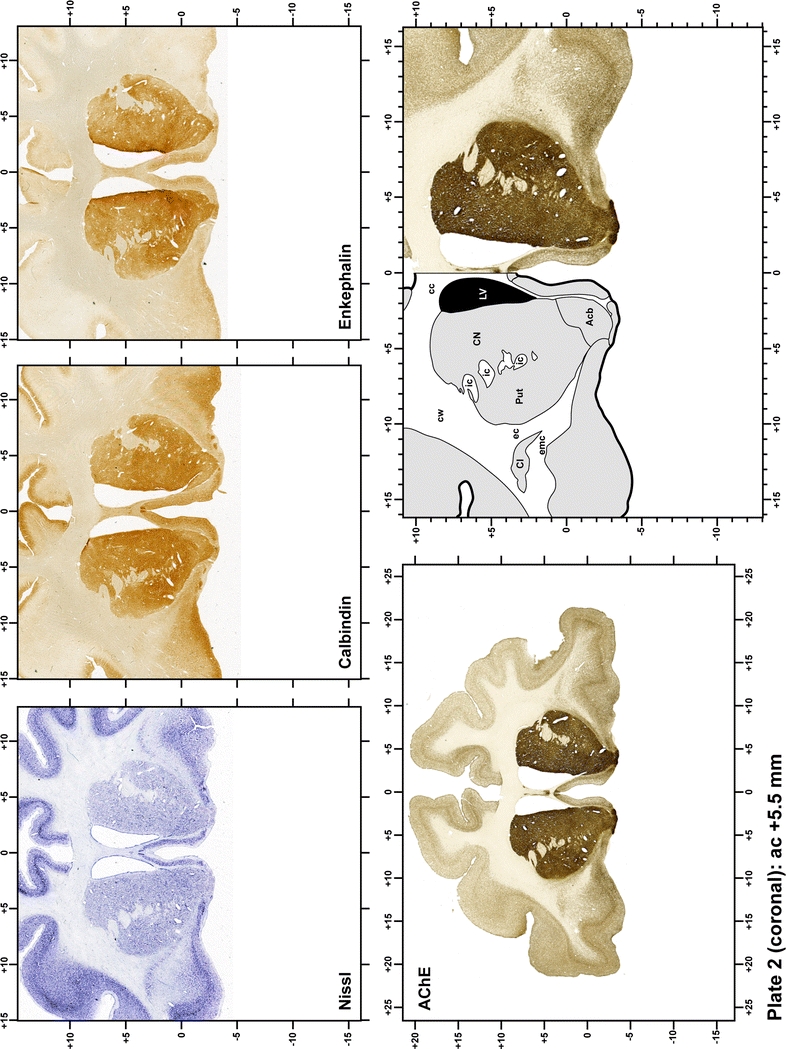
Plate 3.
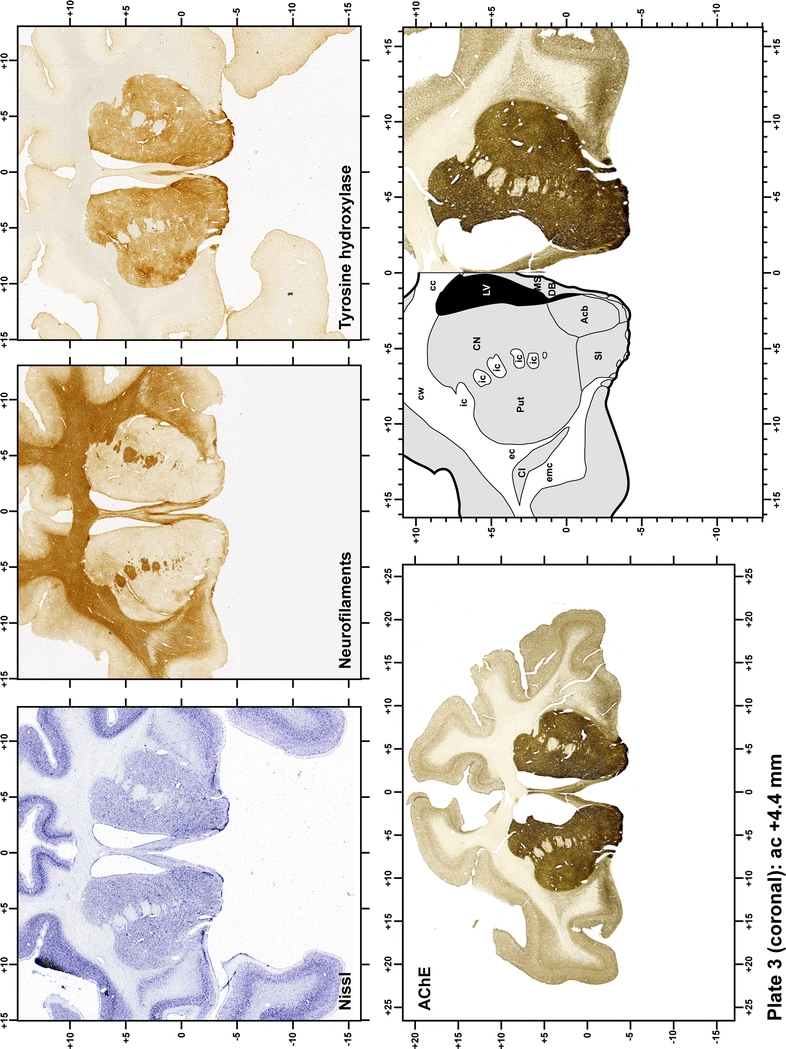
Plate 4.
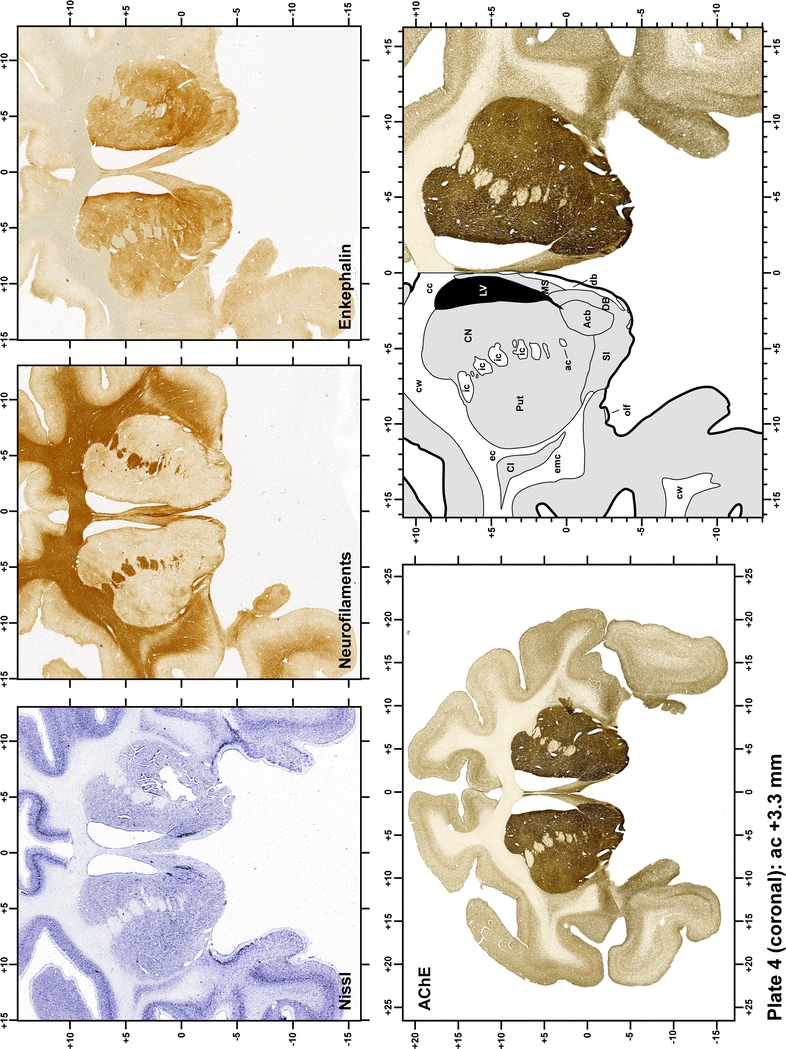
Plate 5.
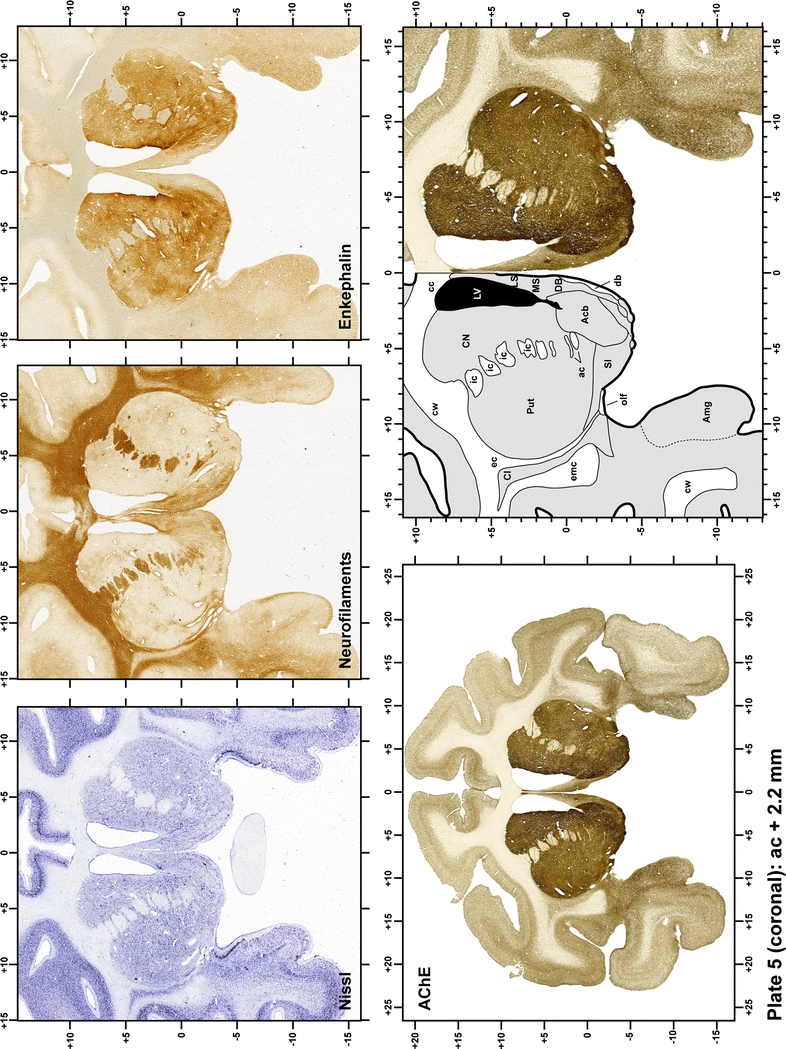
Plate 6.
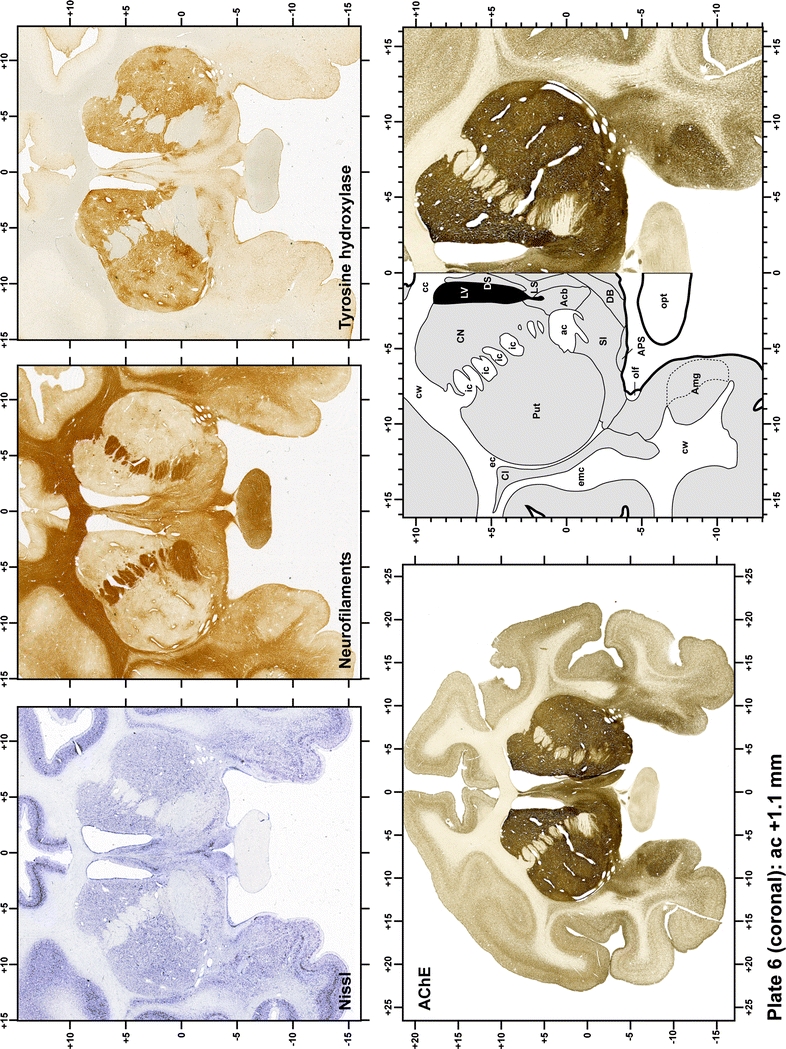
Plate 7.
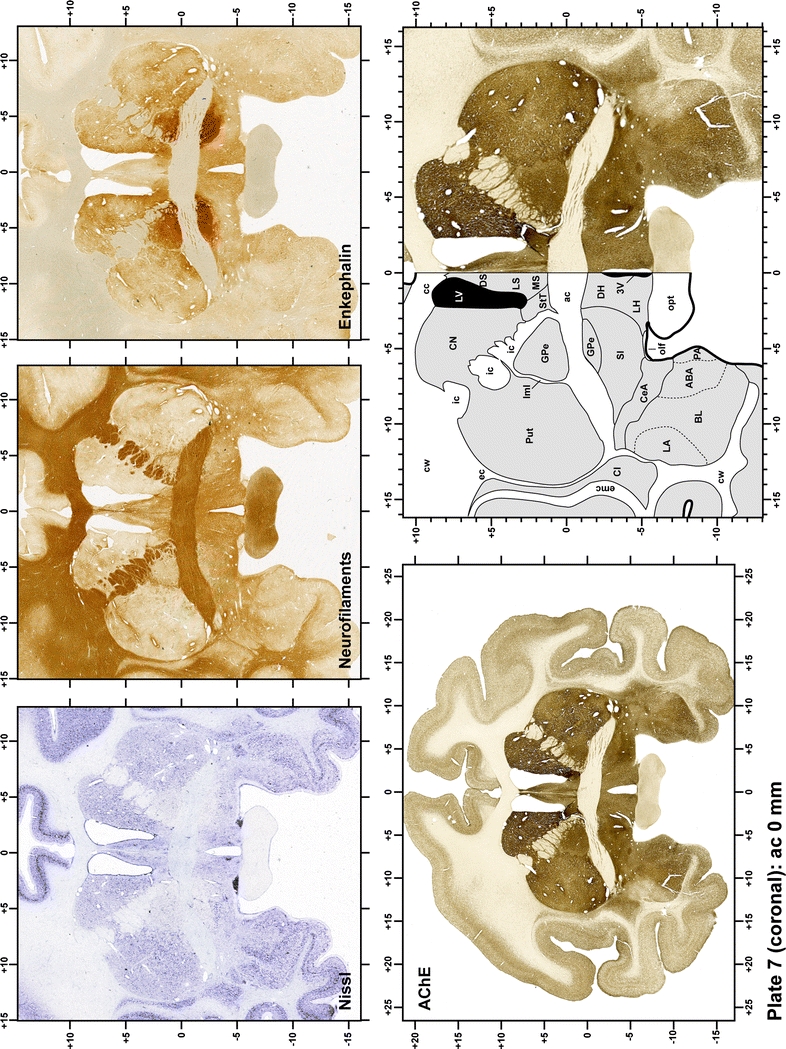
Plate 8.
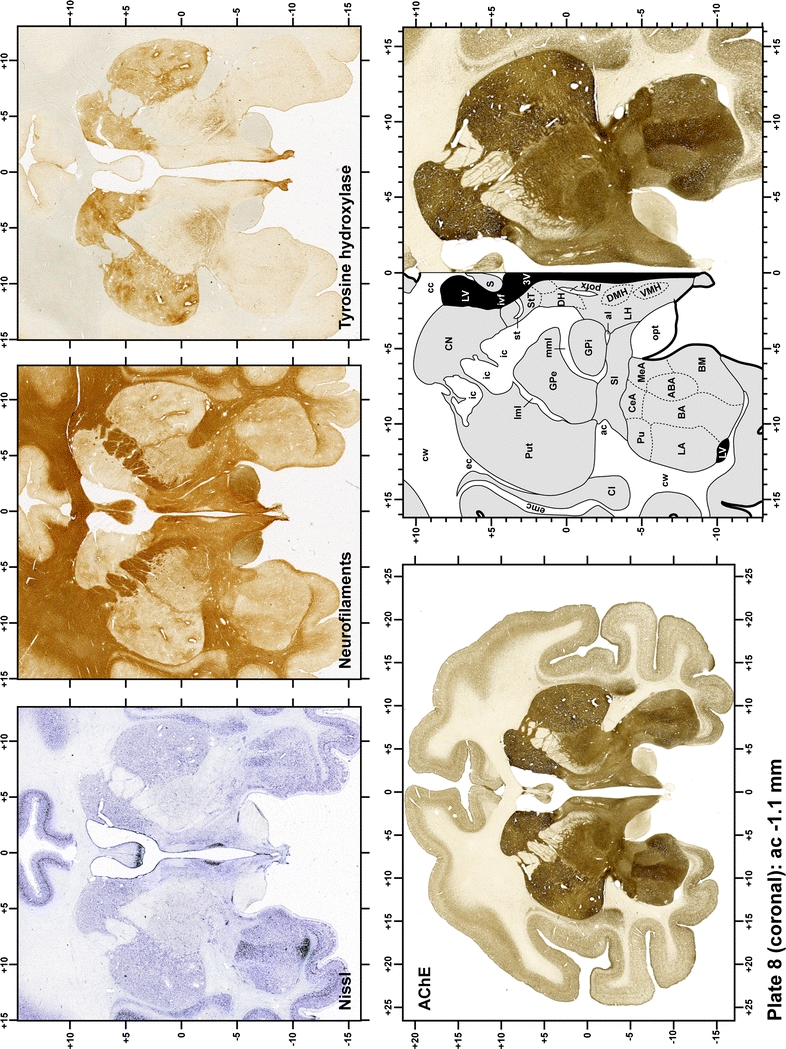
Plate 9.
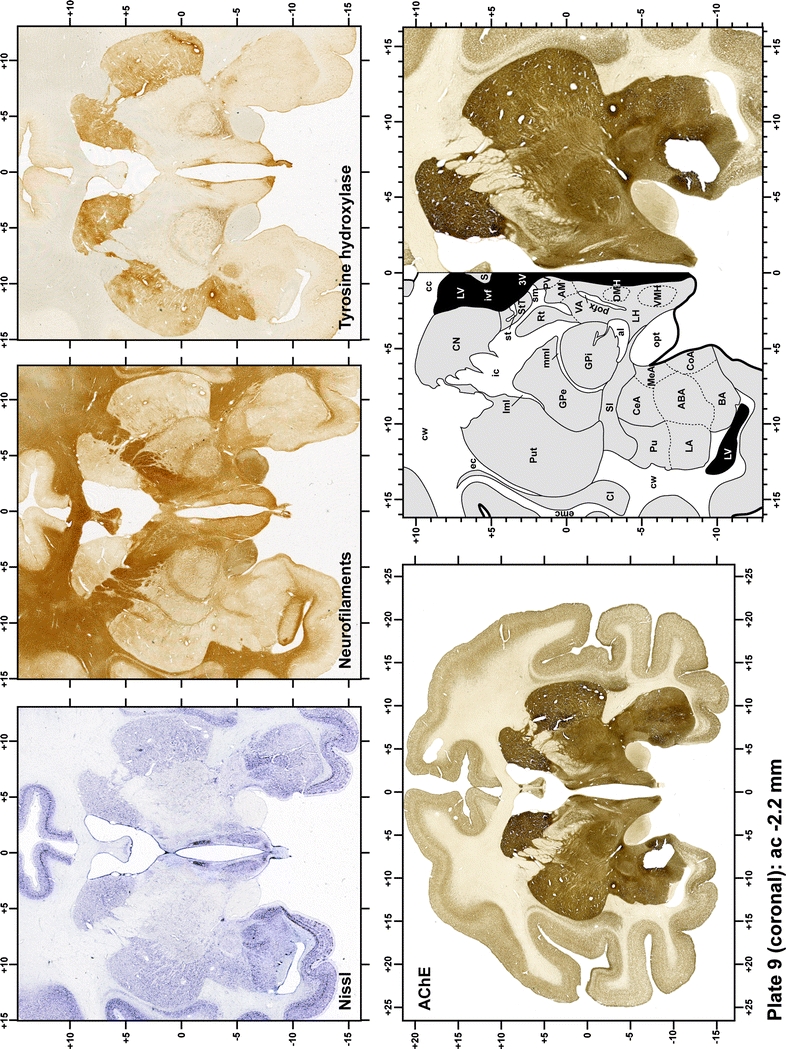
Plate 10.
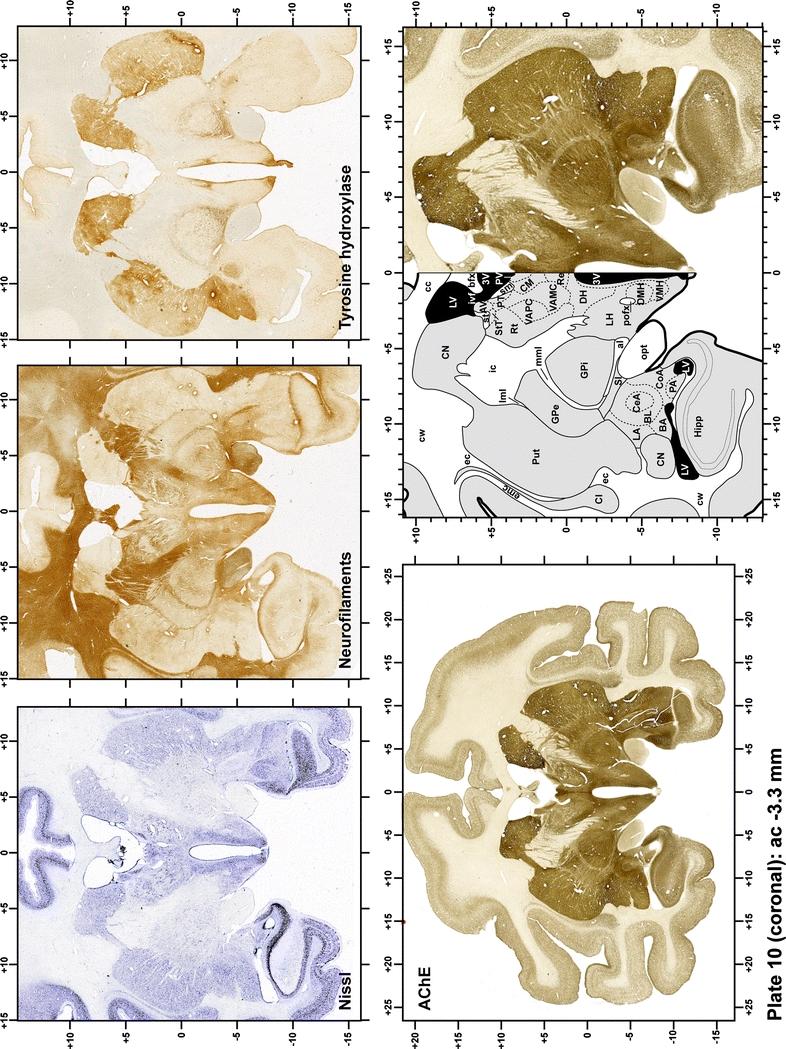
Plate 11.
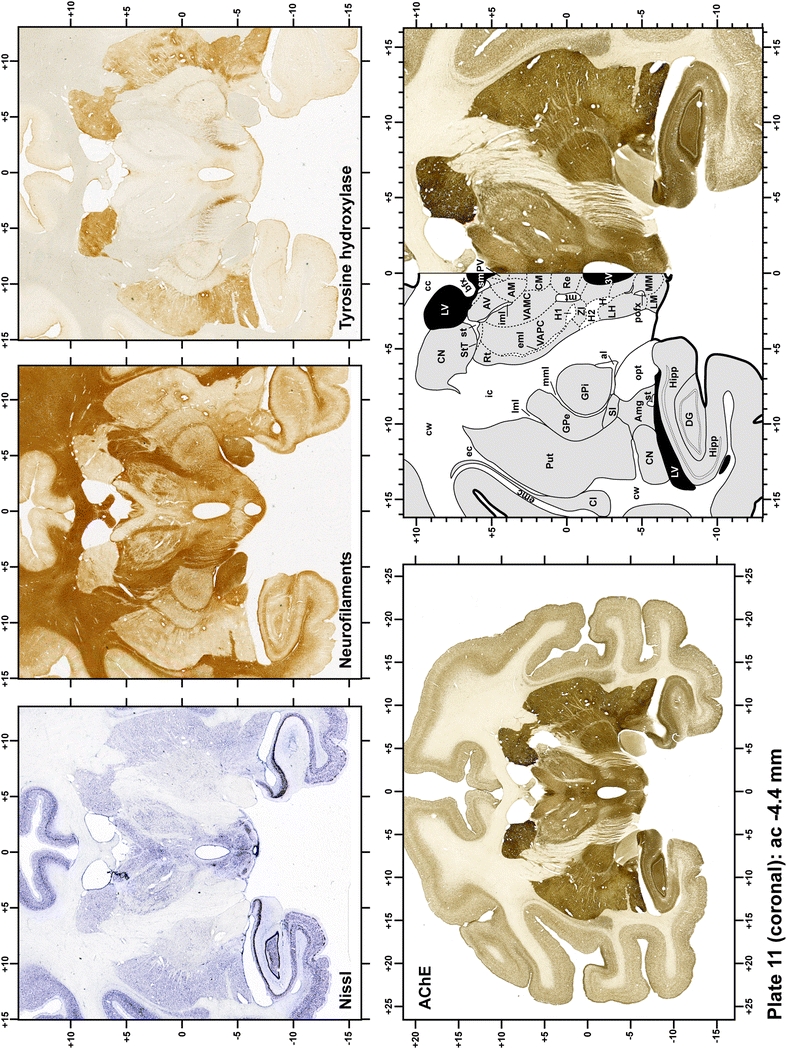
Plate 12.
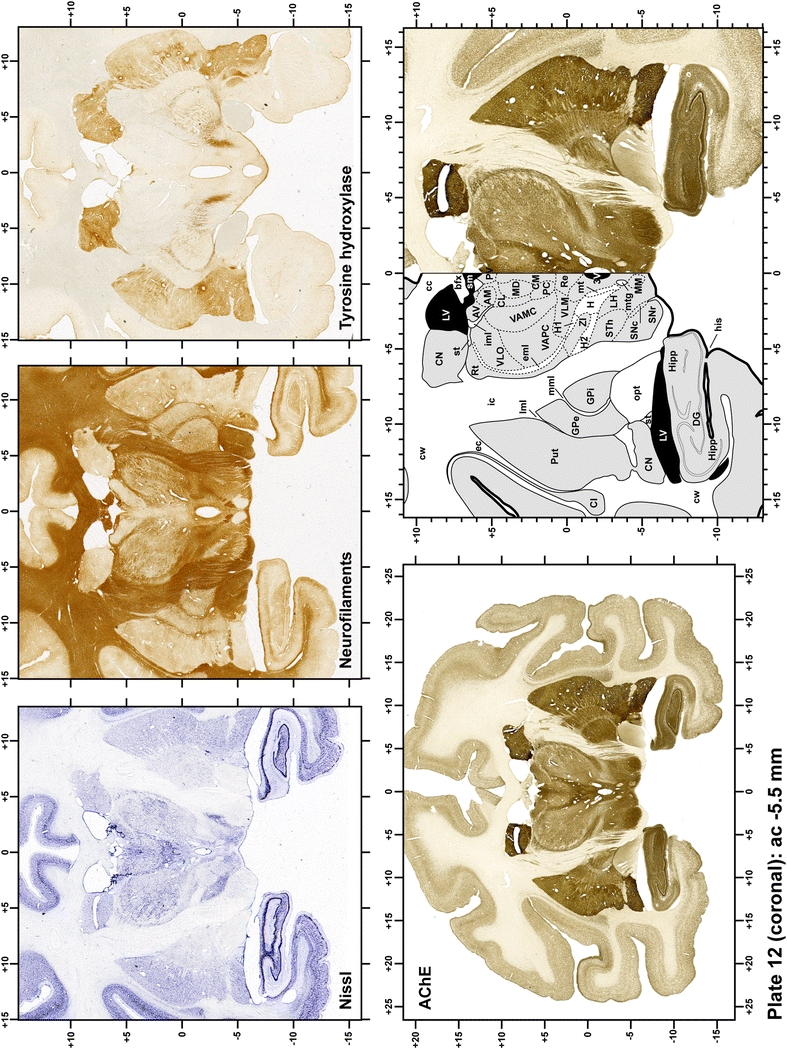
Plate 13.
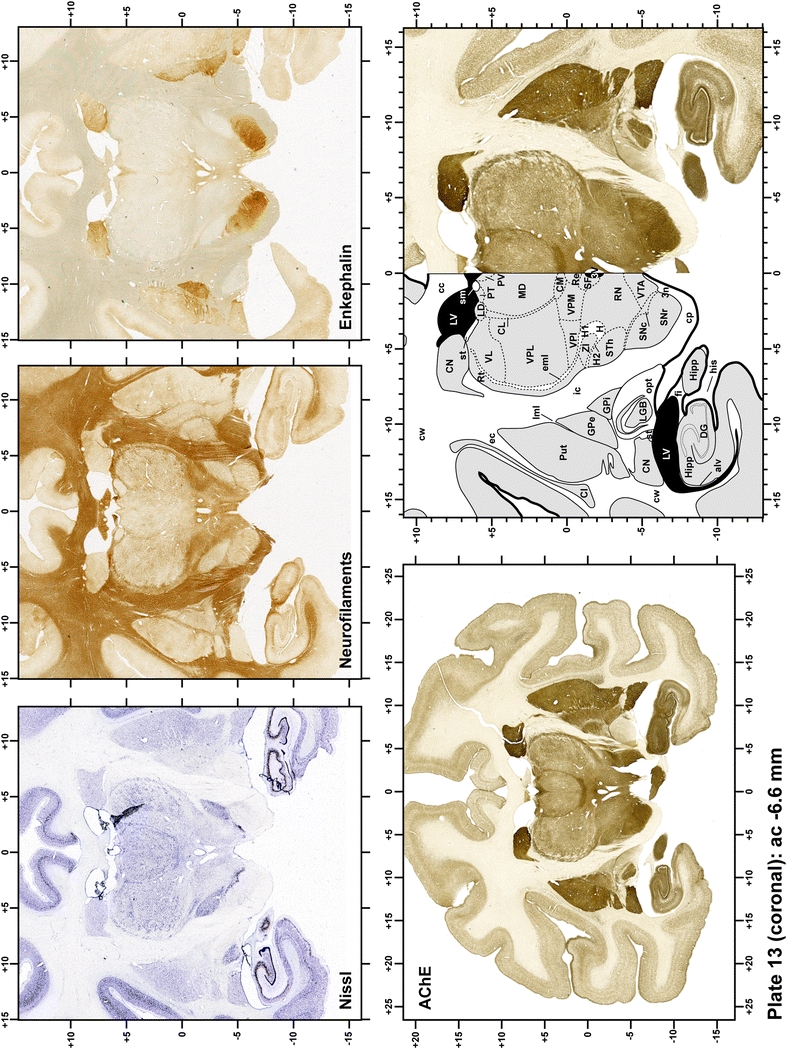
Plate 14.
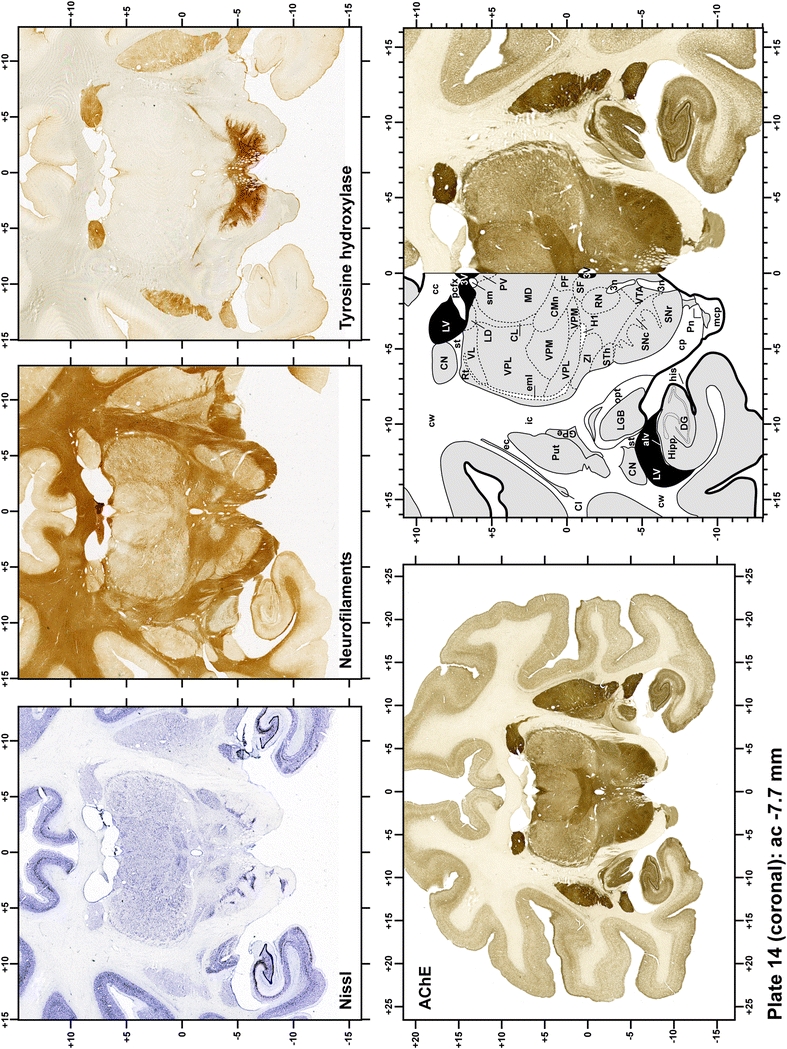
Plate 15.
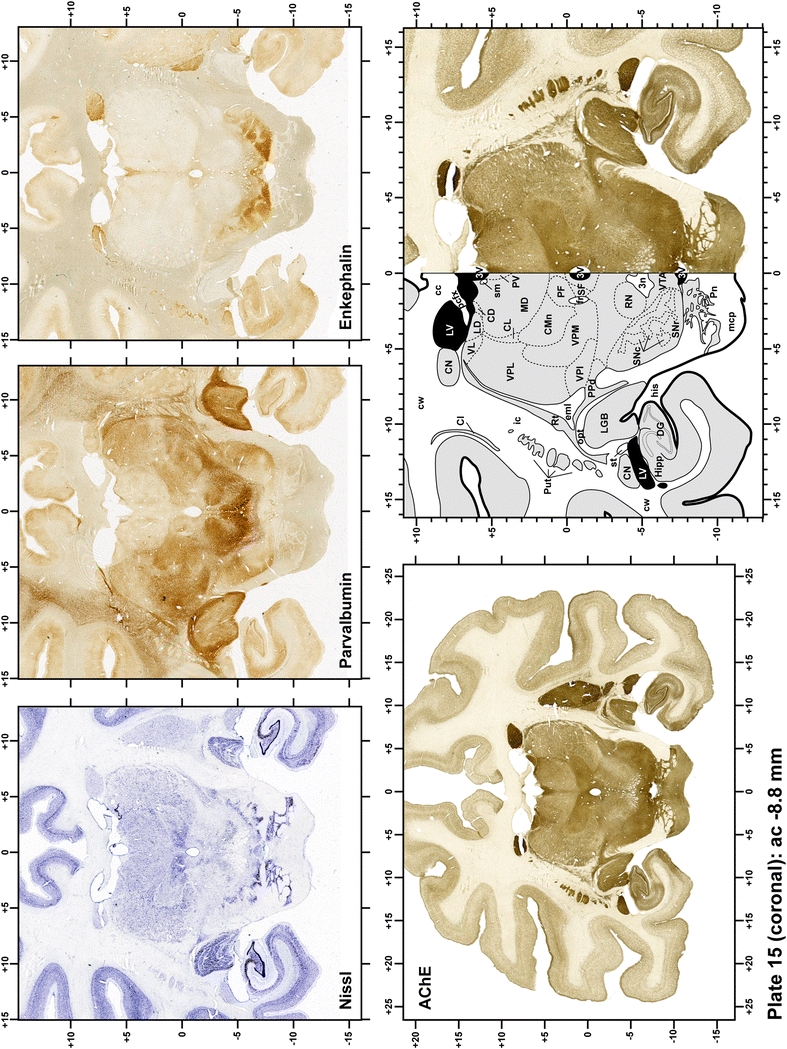
Plate 16.
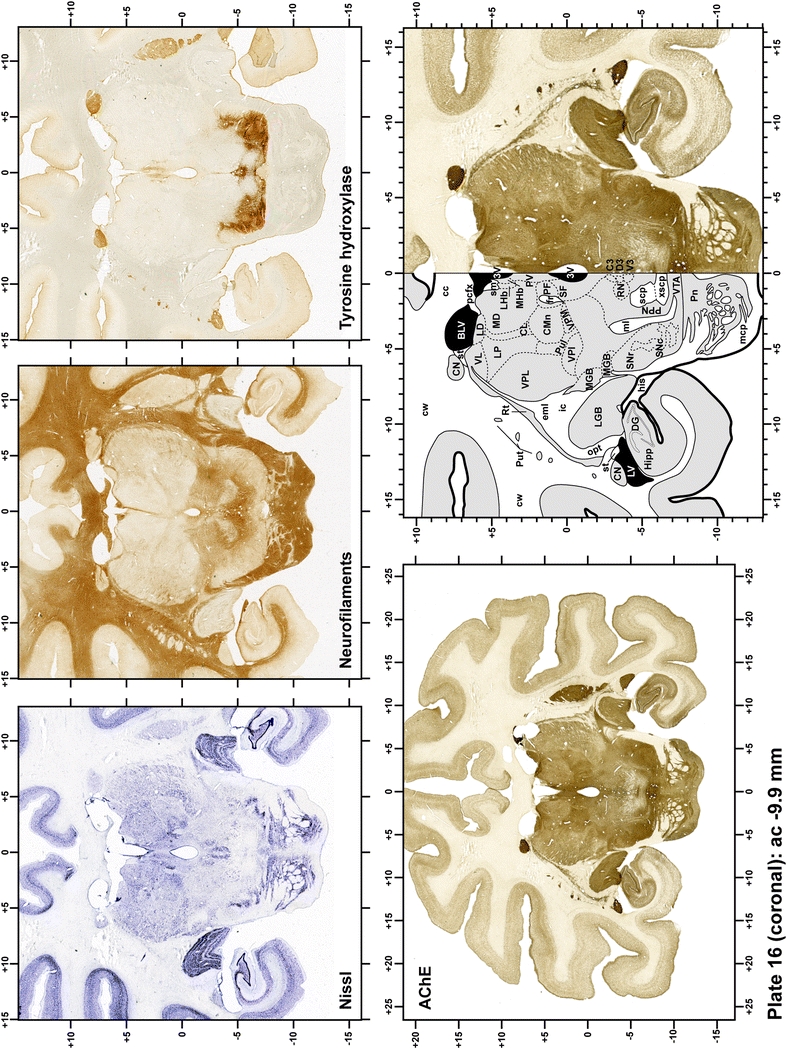
Plate 17.
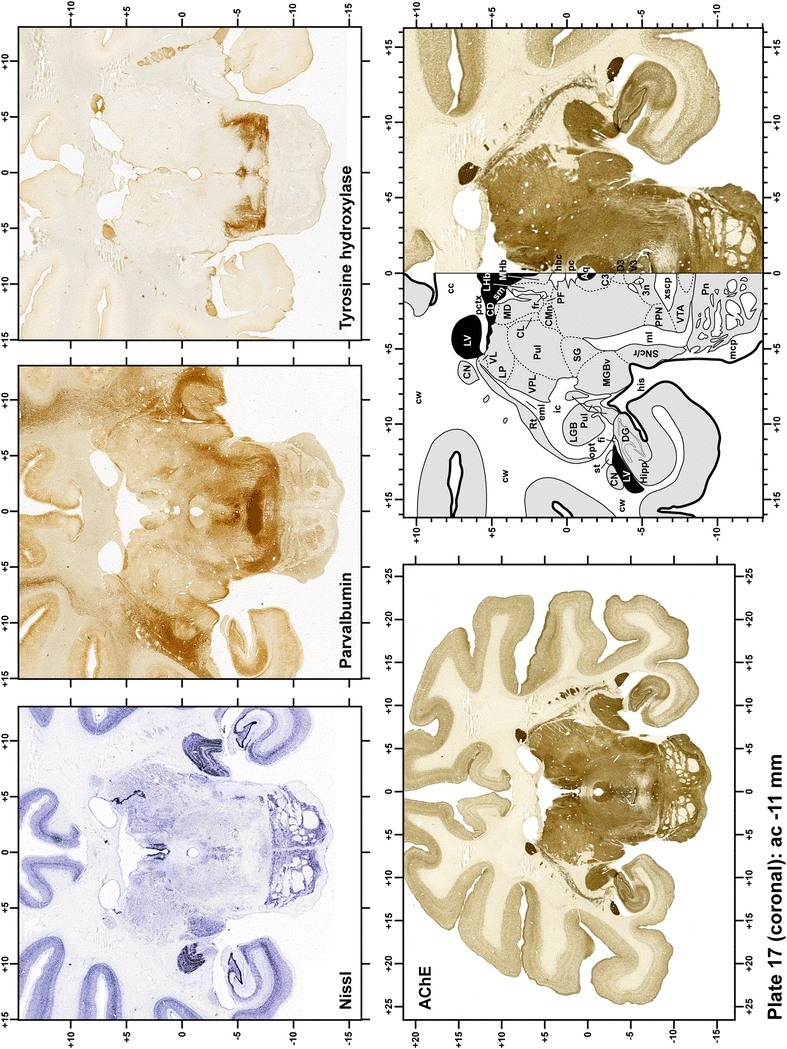
Plate 18.
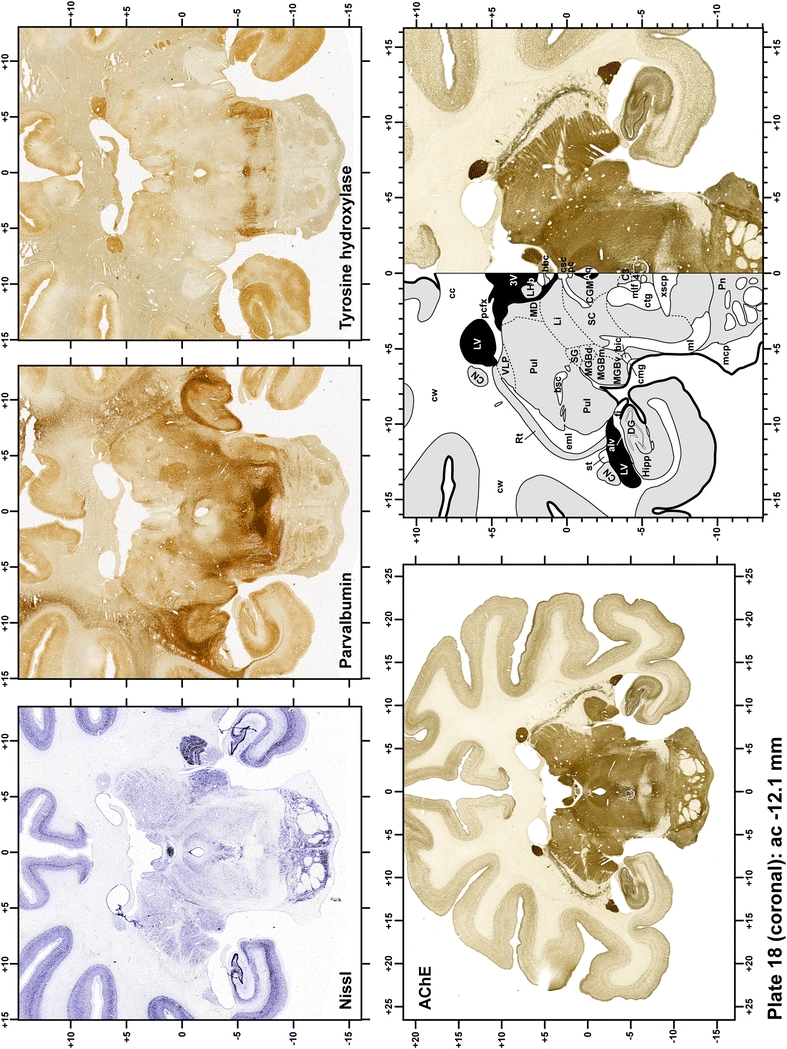
Plate 19.
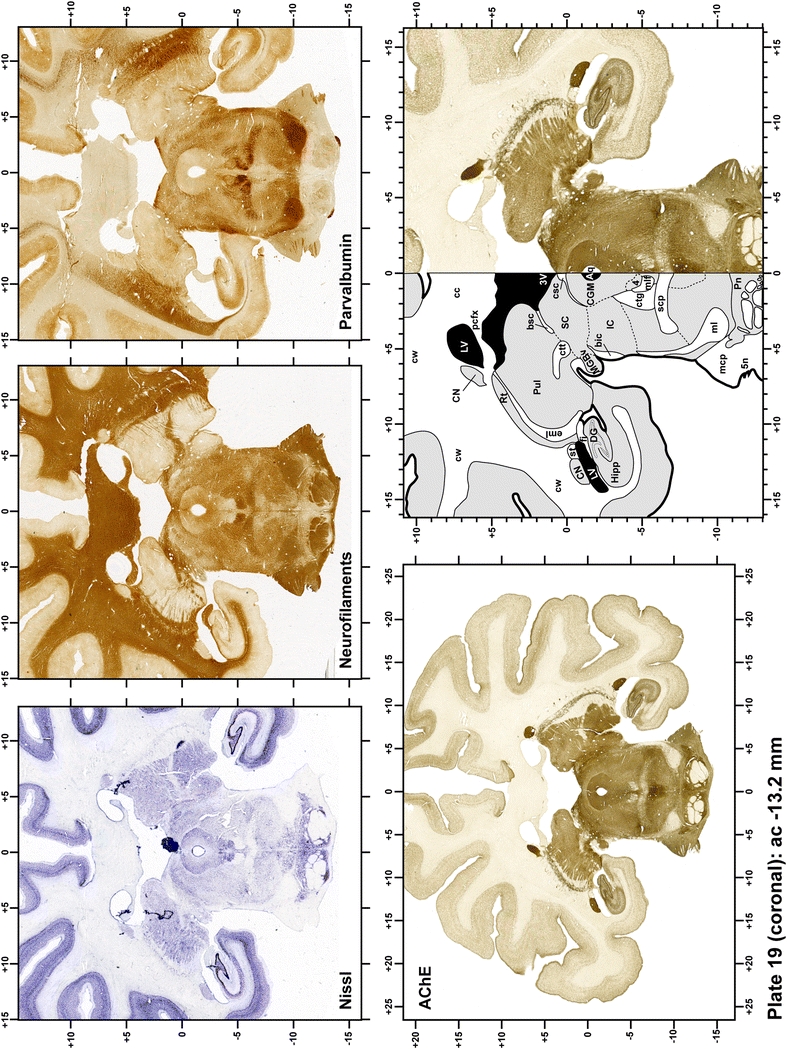
Plate 20.
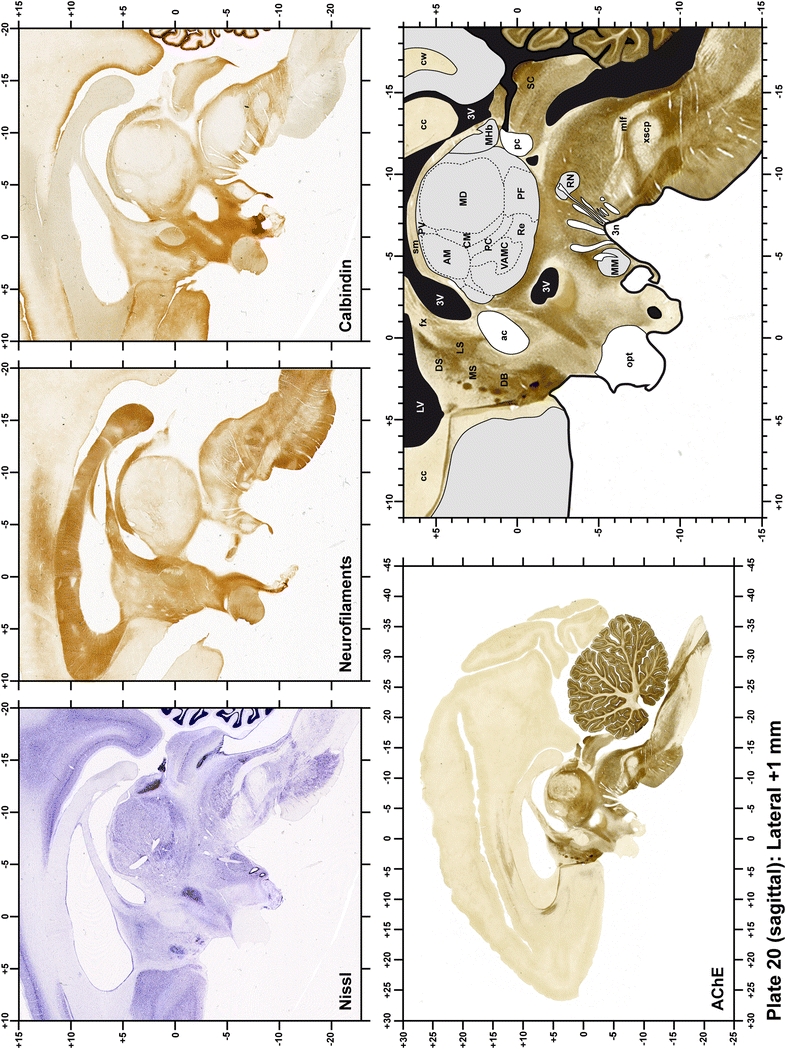
Plate 21.
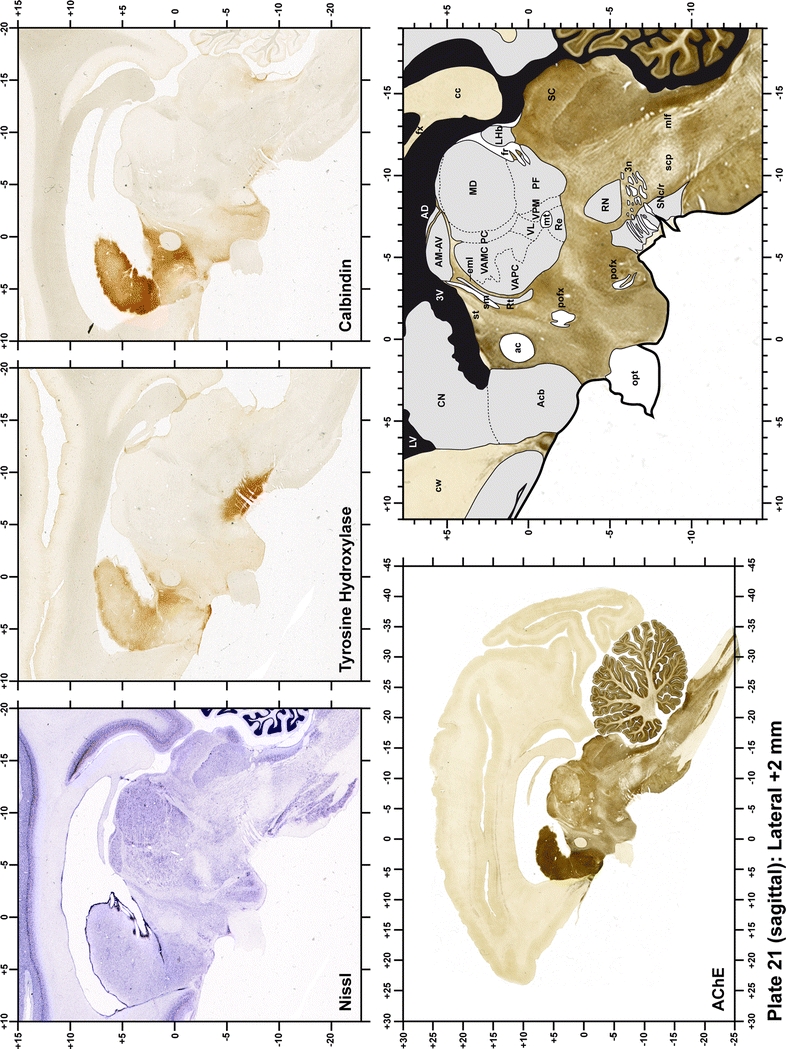
Plate 22.
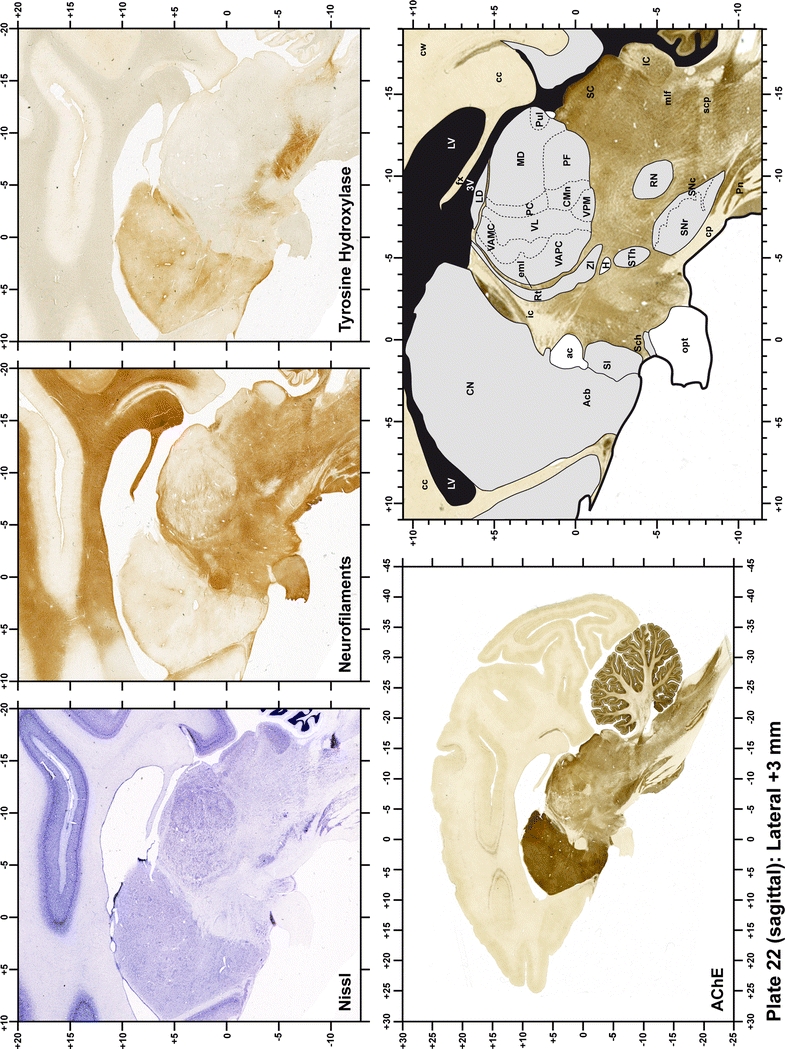
Plate 23.
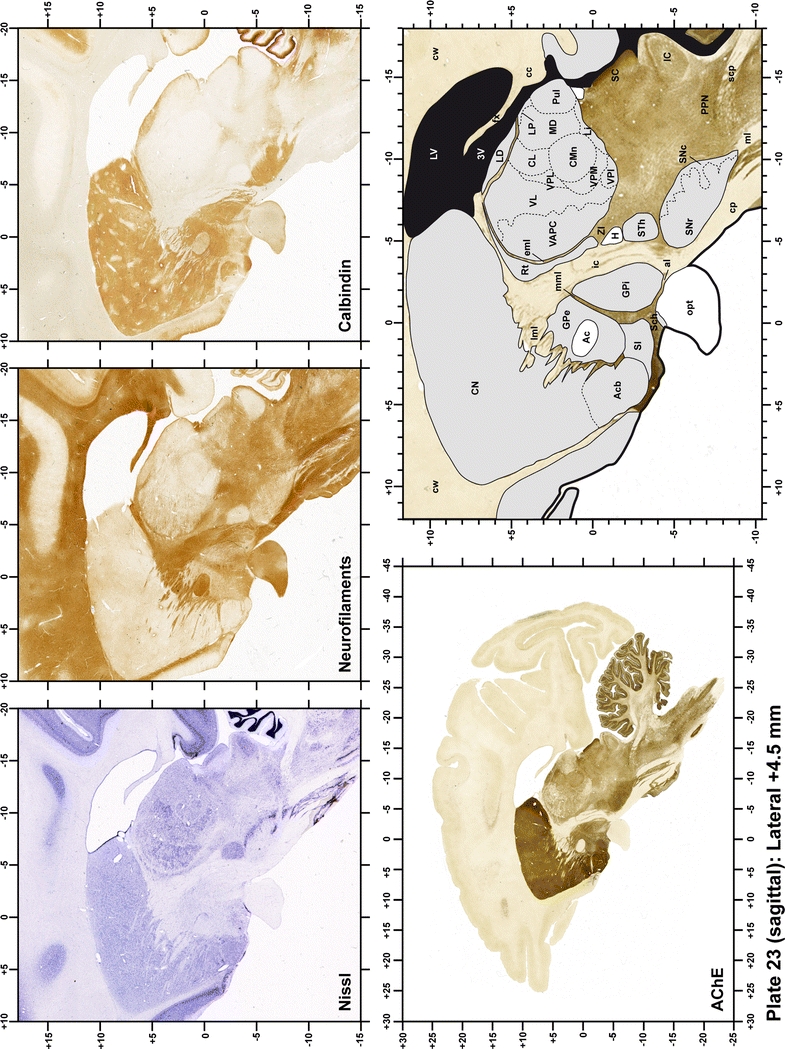
Plate 24.
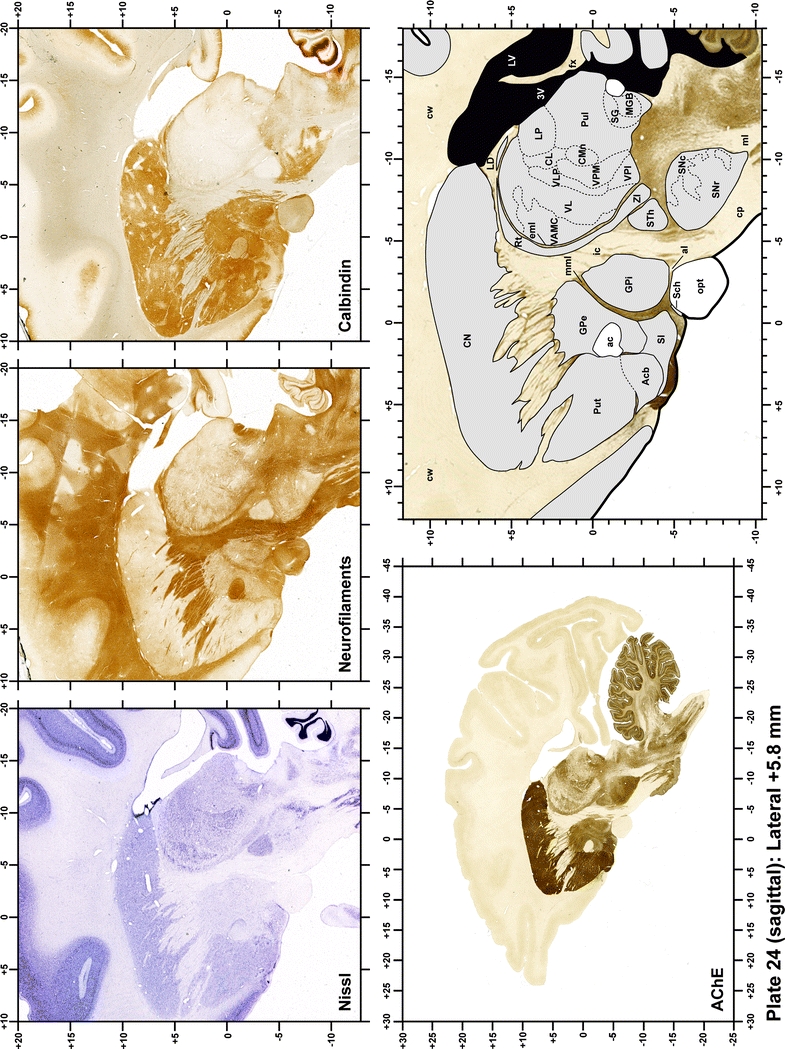
Plate 25.
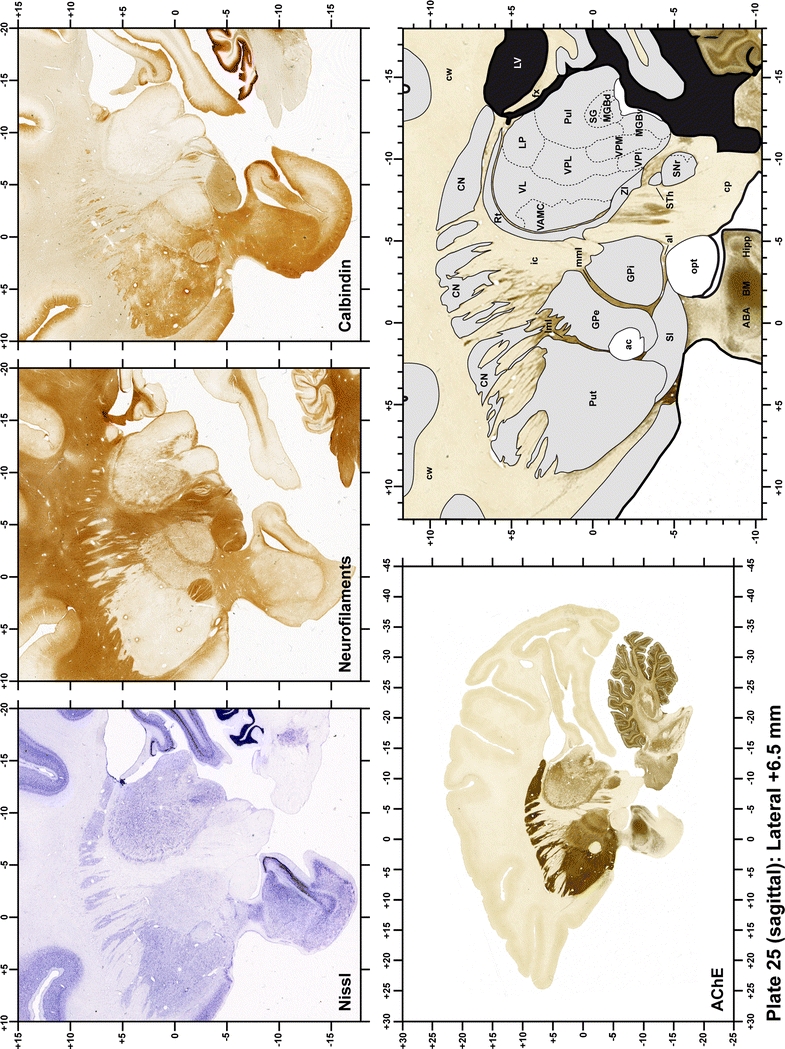
Plate 26.
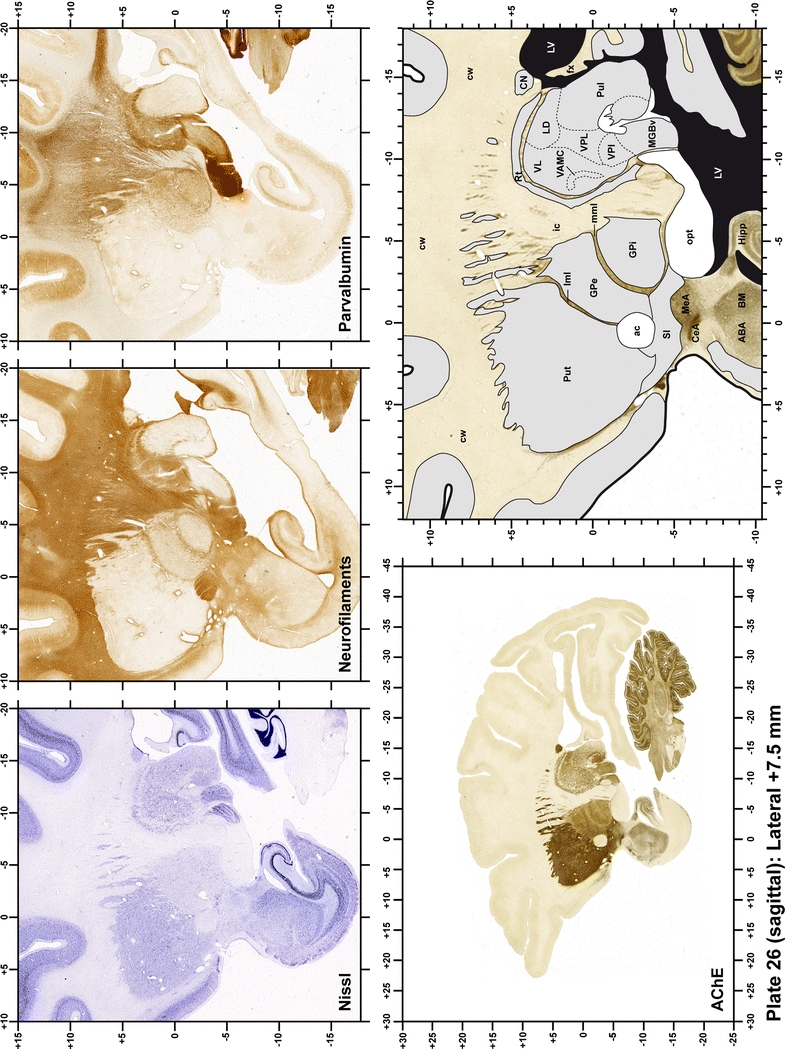
Plate 27.
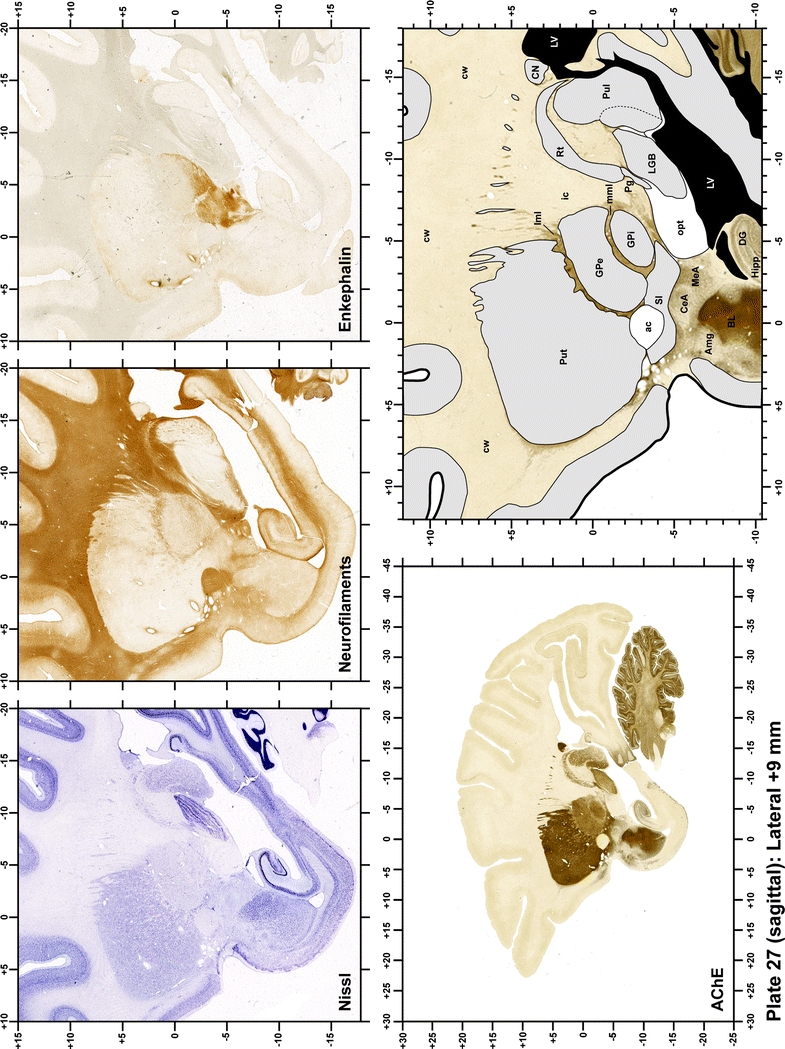
Plate 28.
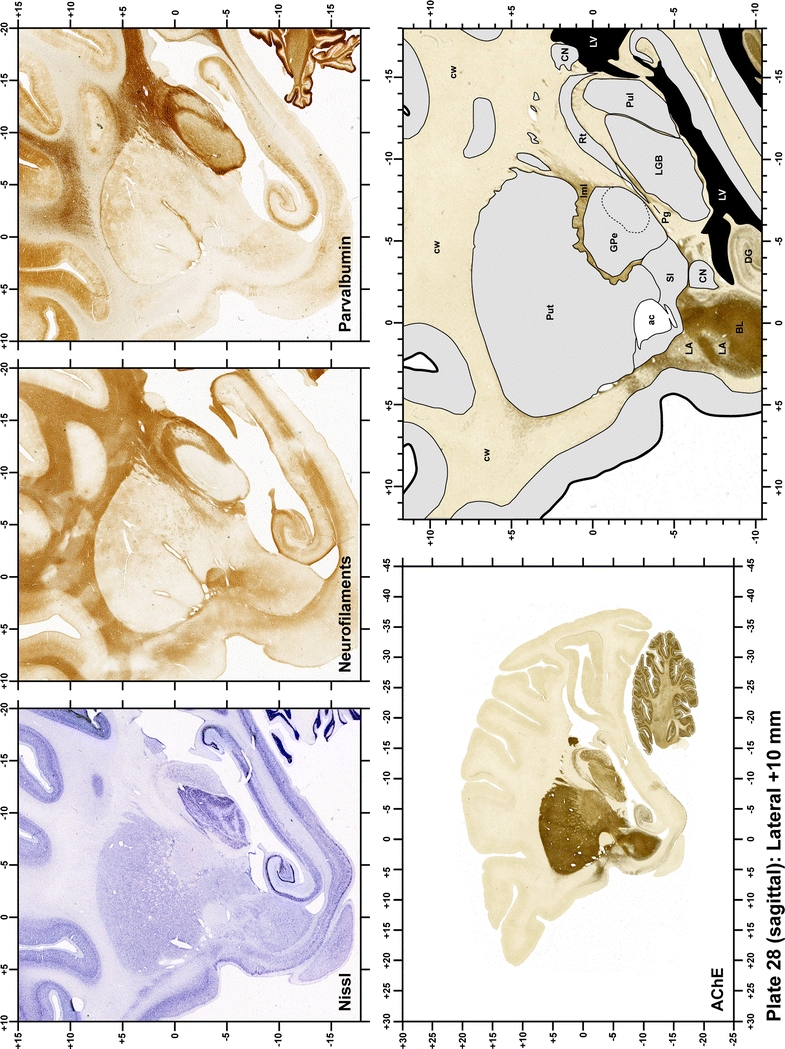
Plate 29.
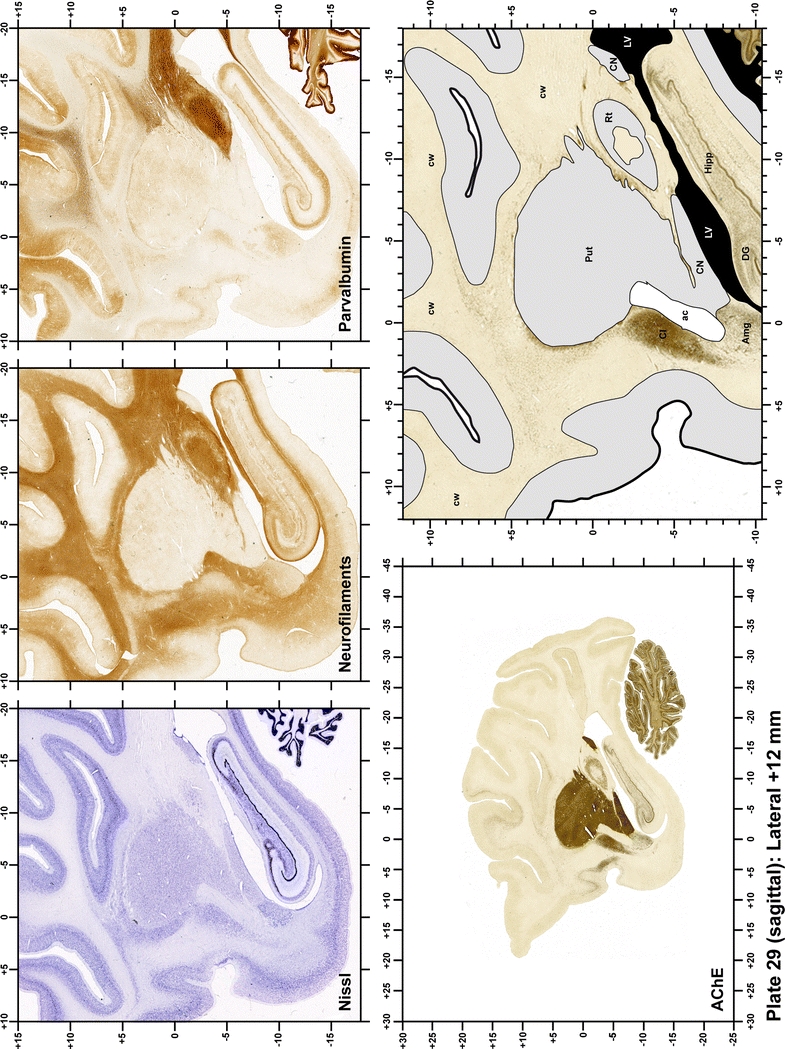
Plate 30.
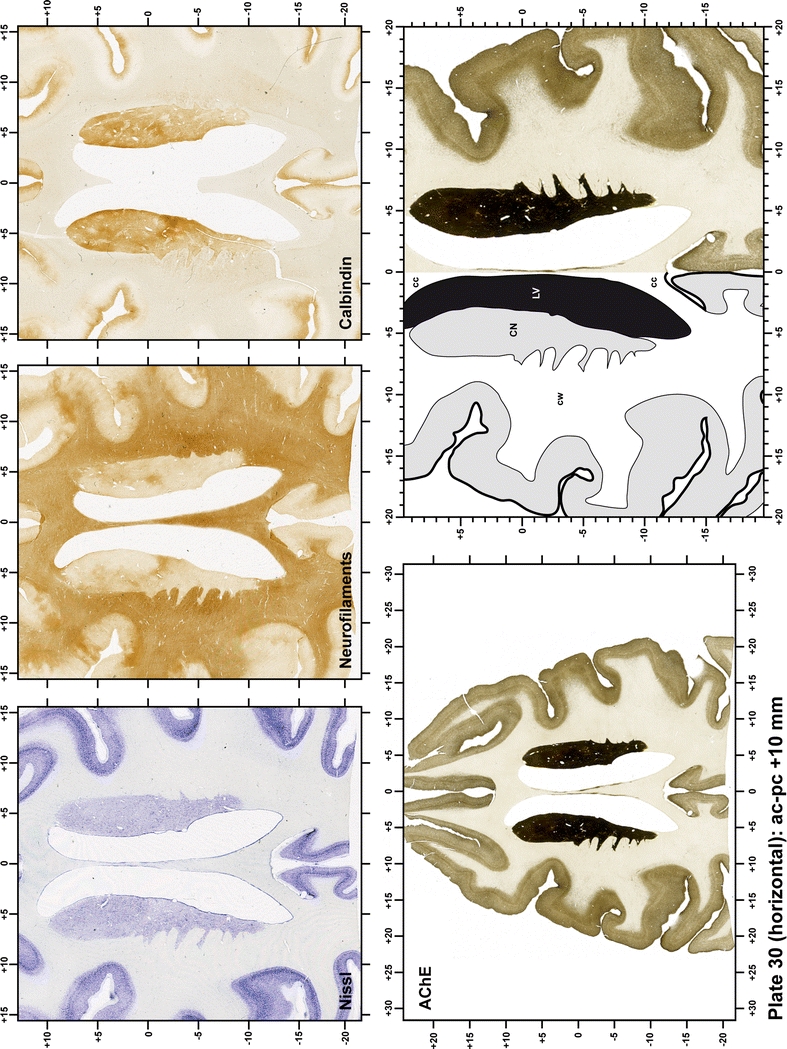
Plate 31.
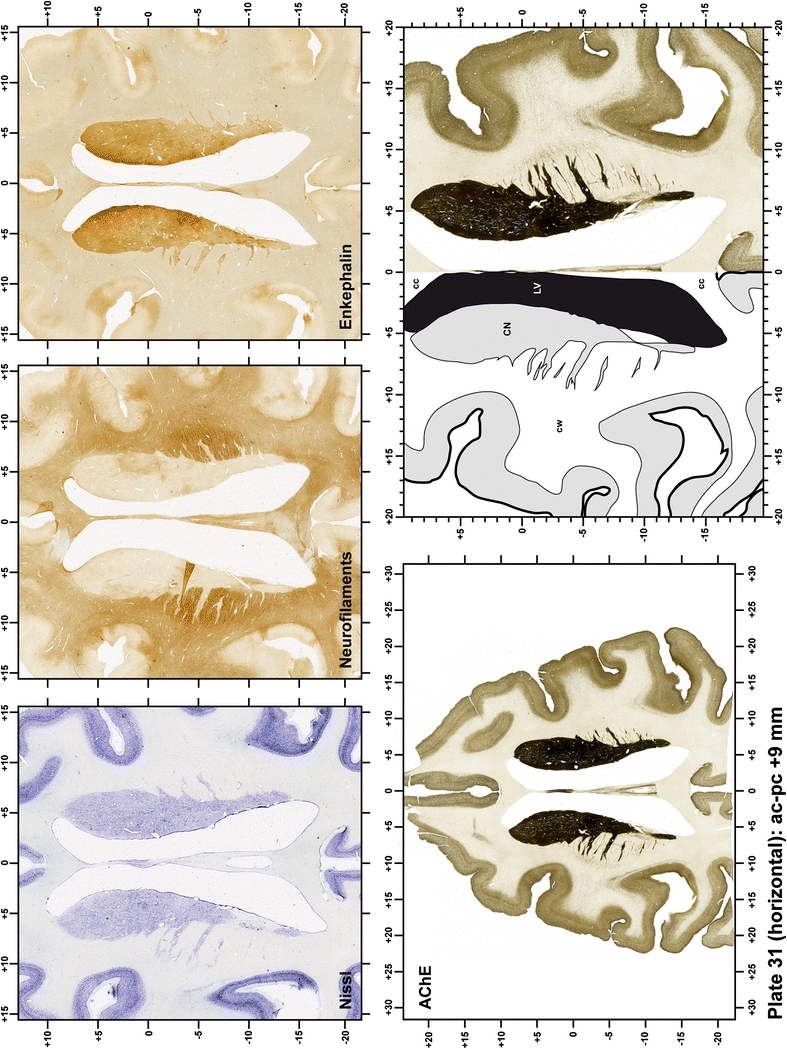
Plate 32.
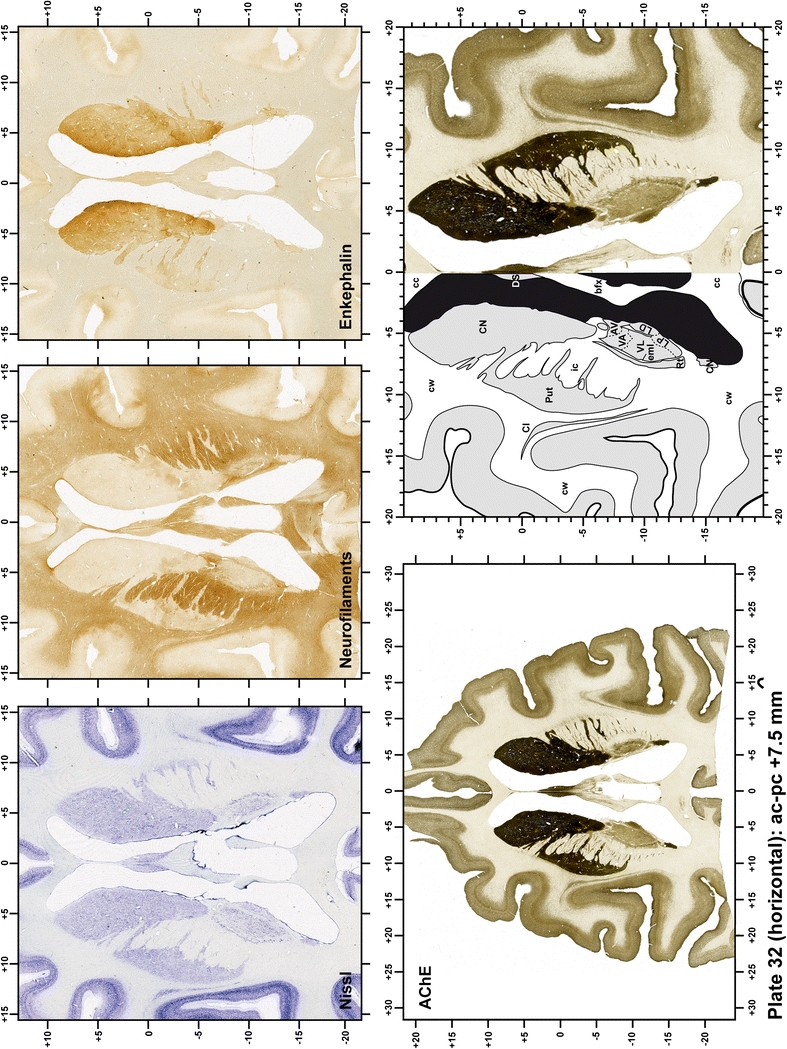
Plate 33.
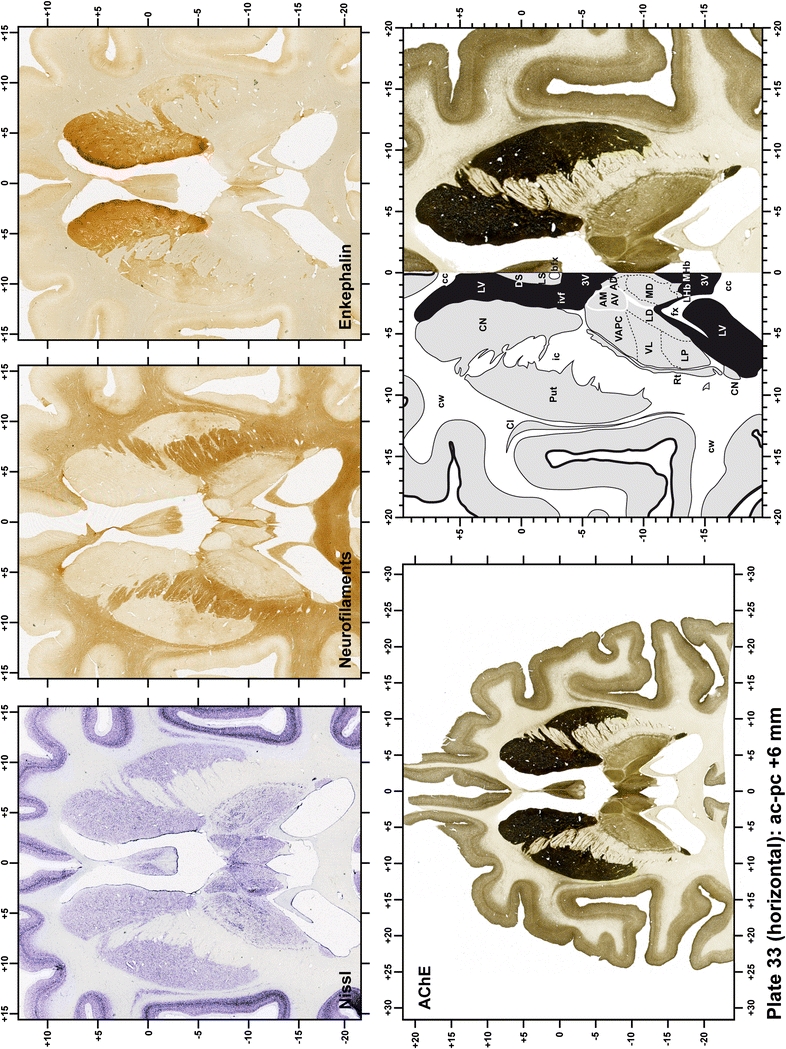
Plate 34.
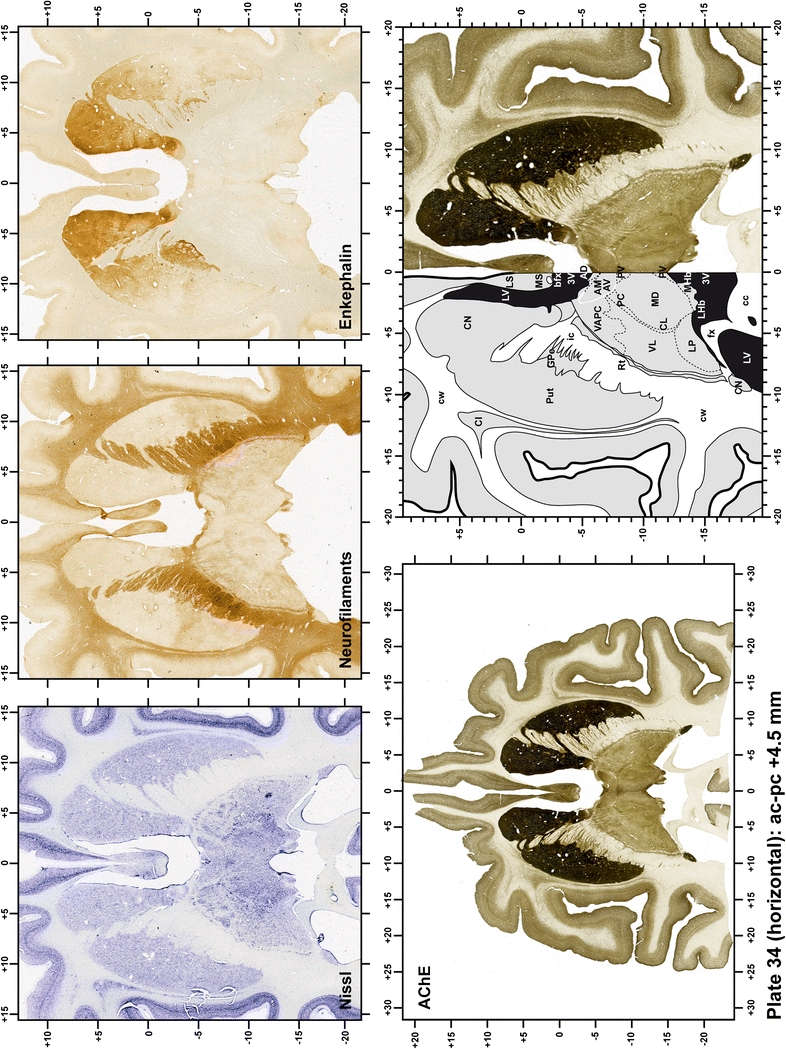
Plate 35.
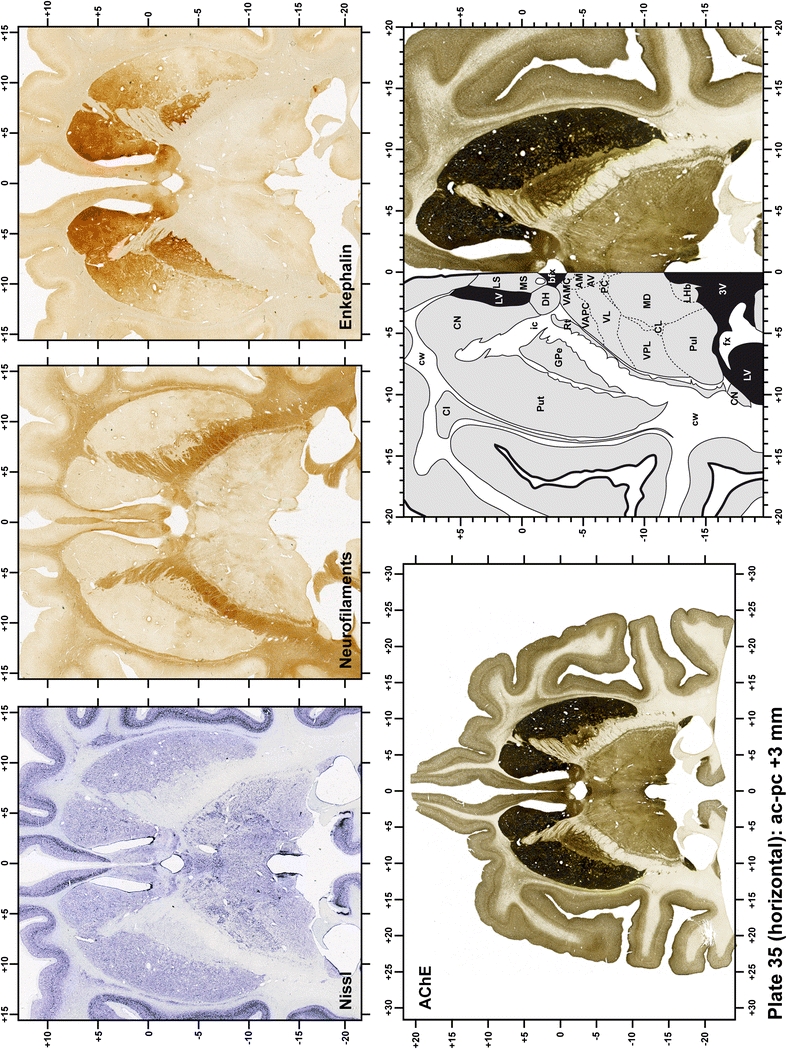
Plate 36.
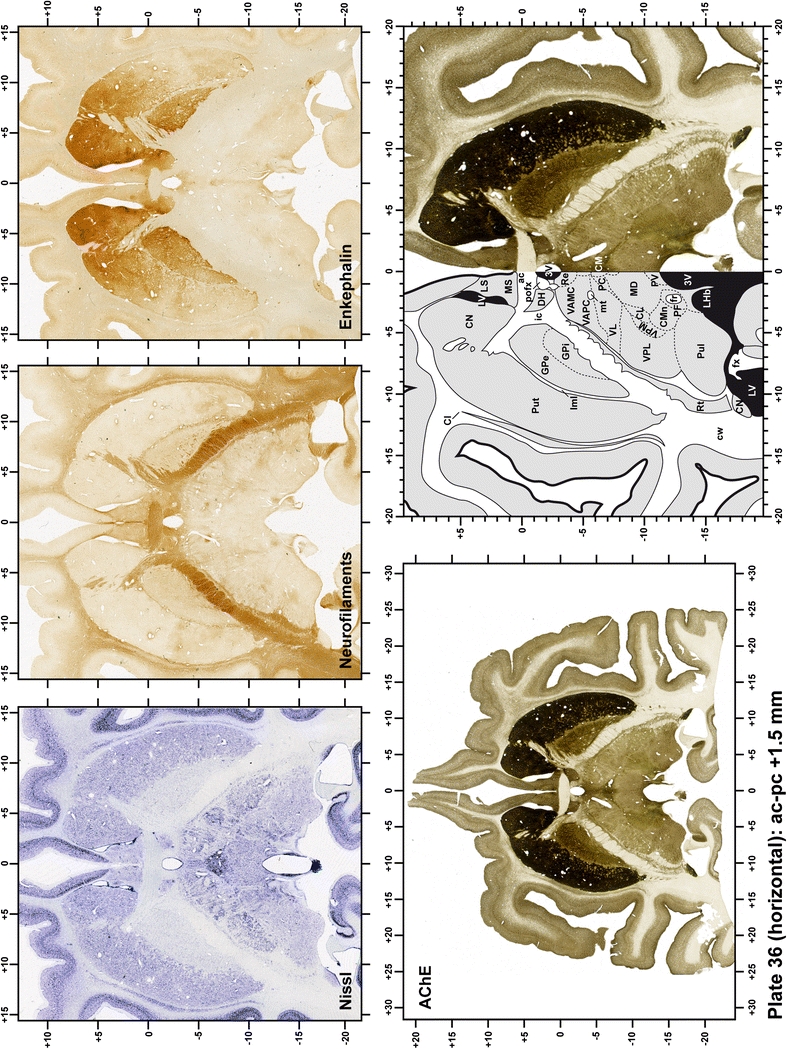
Plate 37.
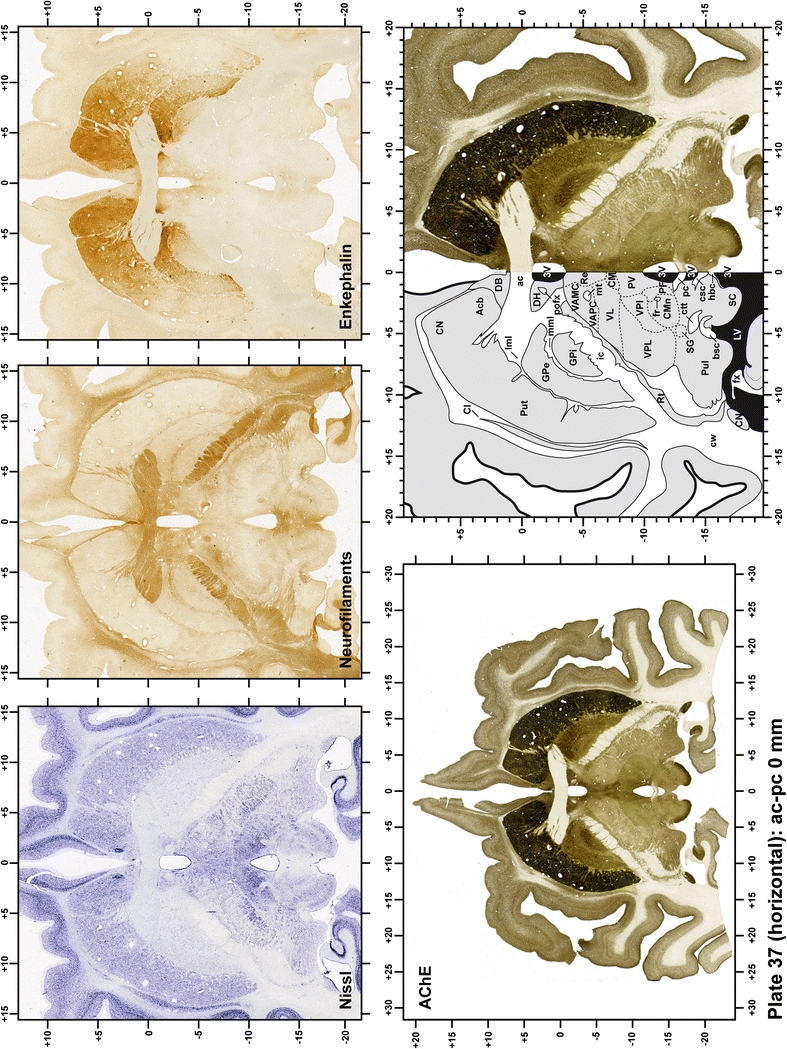
Plate 38.
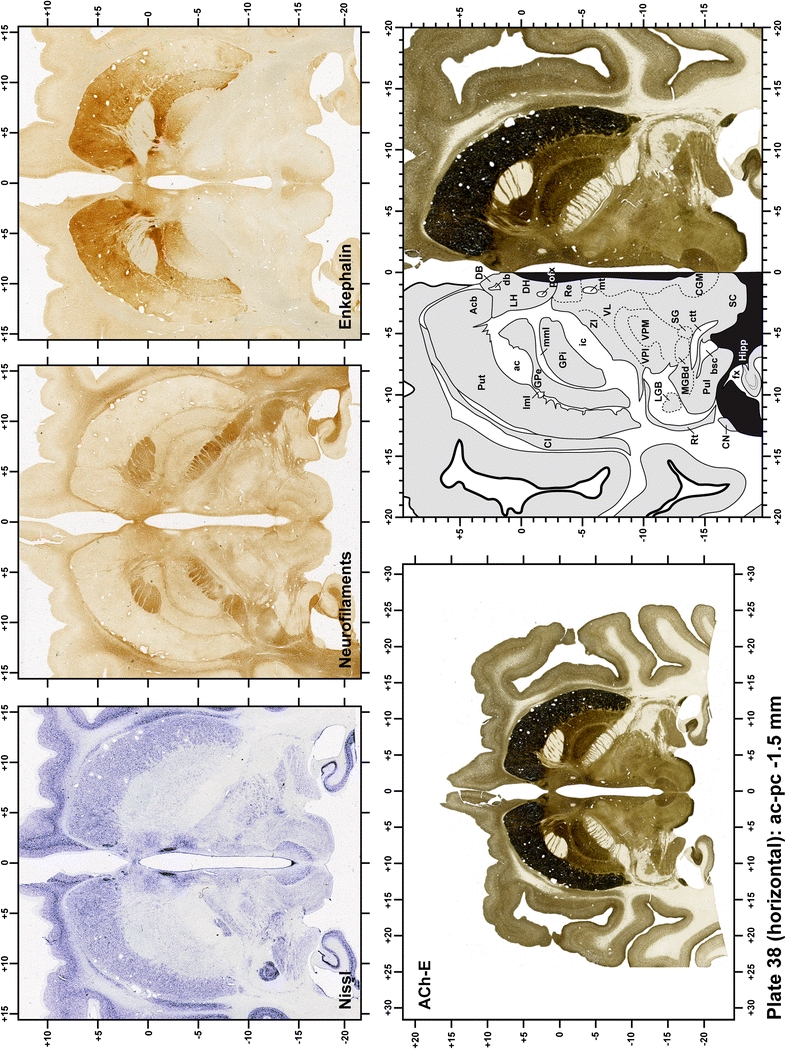
Plate 39.
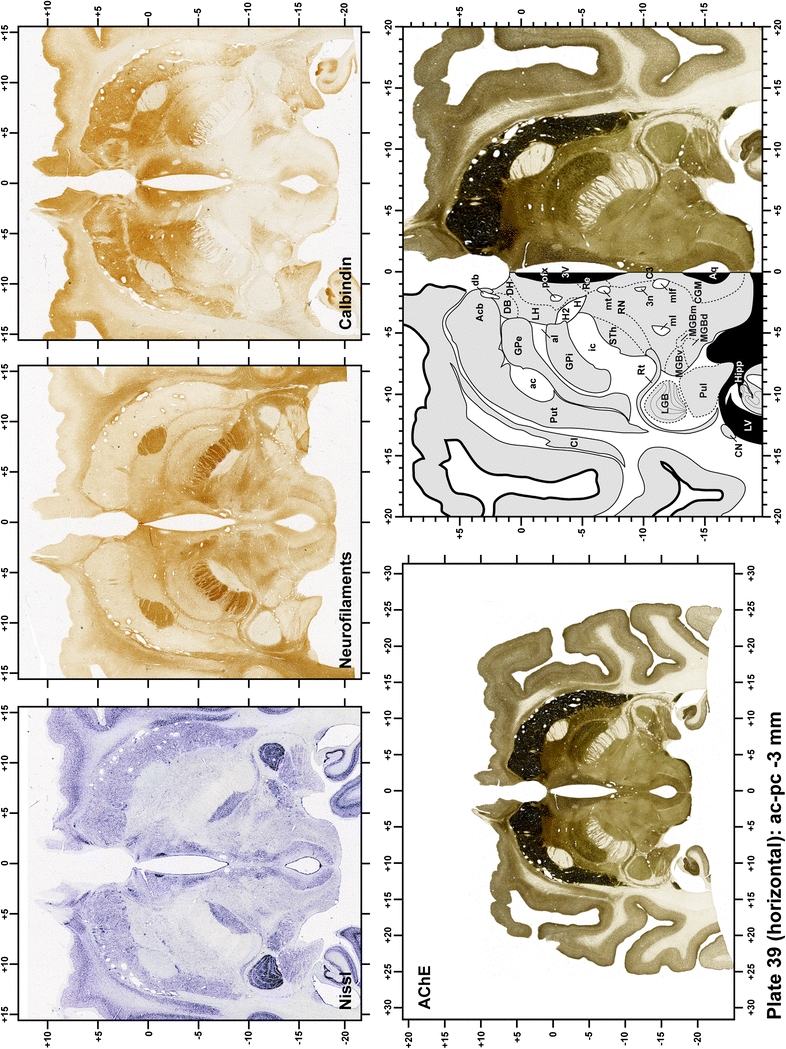
Plate 40.
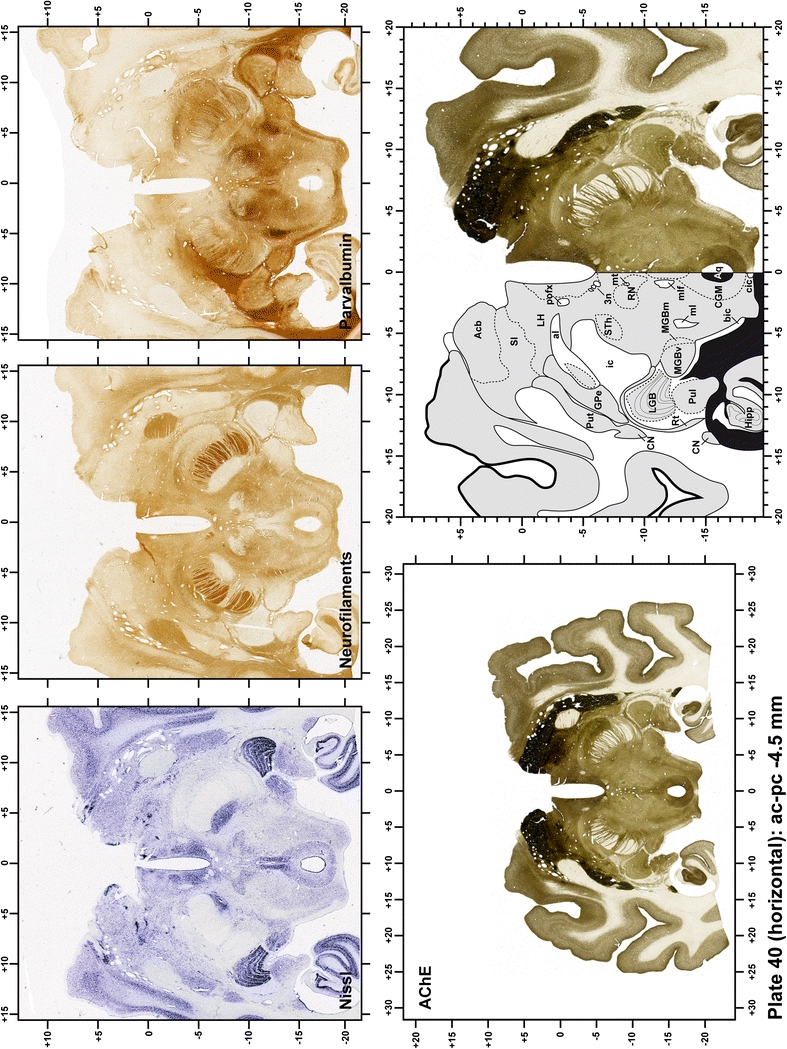
Plate 41.
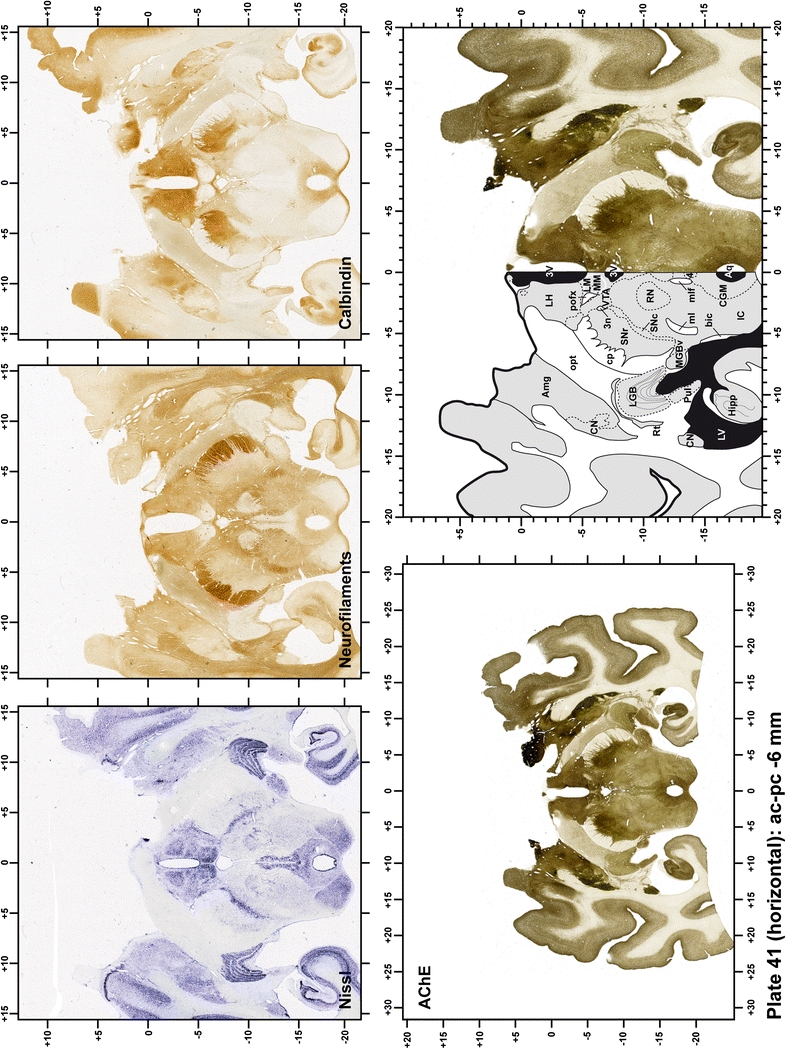
Plate 42.
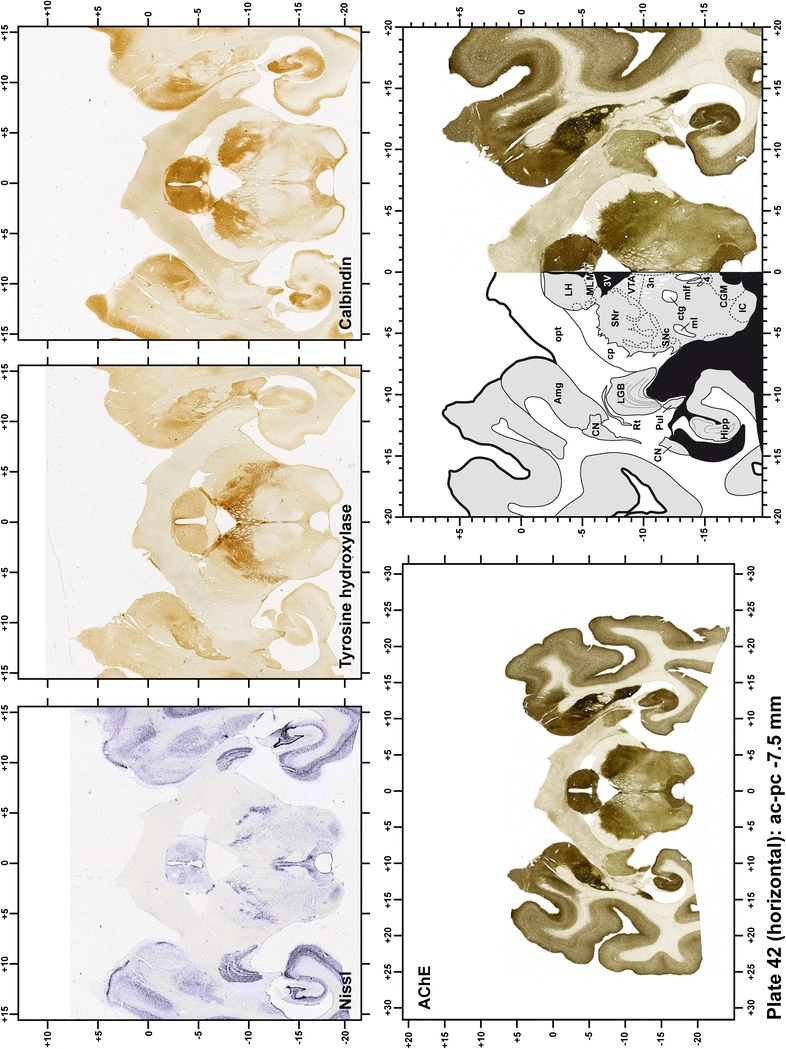
Plate 43.
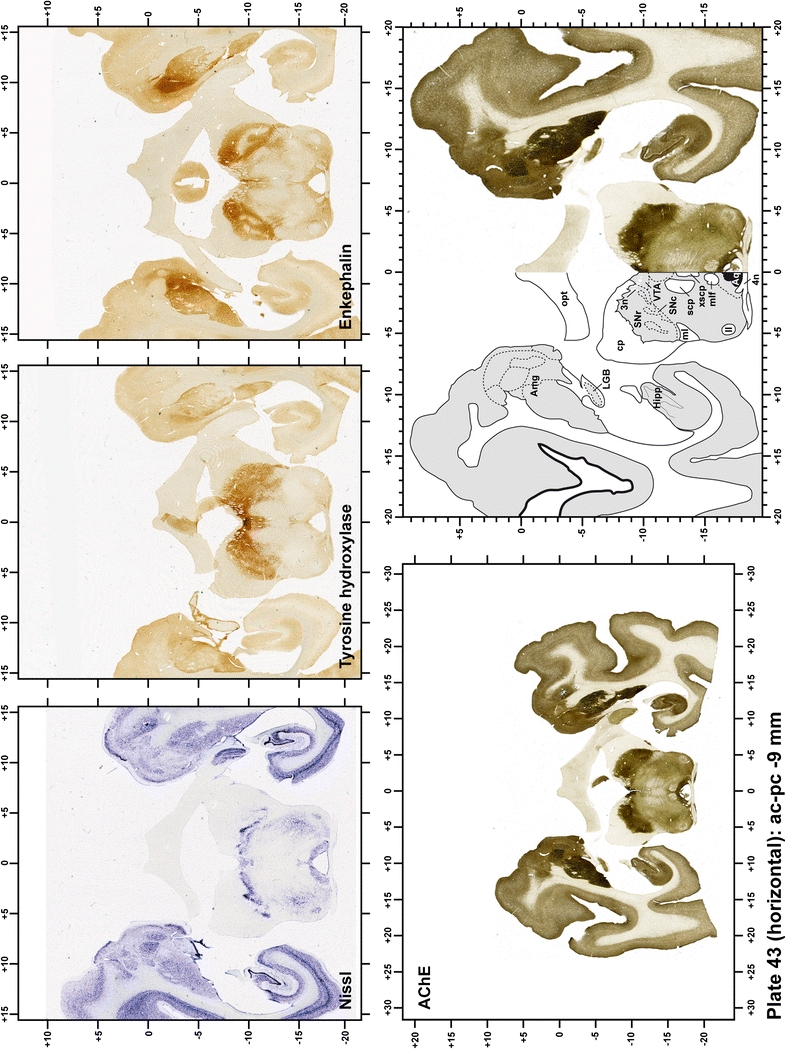
Each plate is made up of five images: all plates include a low-power photomicrograph of the entire brain section stained for AChE, as well as an adjacent brain section stained with the Nissl method, two more equivalent sections, stained immunohistochemically to reveal two of the following markers: enkephalin, tyrosine hydroxylase, calbindin, neurofilaments and parvalbumin and, finally, brain segmentation is provided in a cartoon created from the AChE stained section, at higher magnification. The detection of the enzyme tyrosine hydroxylase represents an indirect correlate for the dopaminergic system, and it is one of the most frequently used stains in the basal ganglia field. Furthermore, the immunohistochemical detection of enkephalin is a useful method for the accurate delimitation of structures like the substantia nigra pars reticulata, the striatum as well as the external and internal segments of the globus pallidus (GPe and GPi, respectively). Indeed, the boundaries of the infracommissural extension of the GPe (often called the ventral pallidum) are clearly appreciated when using enkephalin as a neuronal marker (as illustrated in Plate 7). The same applies to the immunohistochemical detection of calbindin. Indeed, the striatal patch/matrix compartments are easily observed following calbindin staining, even at low magnification (for example, see Plates 23, 24 and 25). Moreover, the immunohistochemical detection of neurofilaments has proven to be instrumental in the development of this atlas. Myelinated fiber tracts became clearly distinguishable by using this stain, thus providing a complementary view of nuclear boundaries when compared with Nissl and AChE stains. Even small fiber tracts such as the mamillothalamic tract could be located accurately by using neurofilament staining (Plates 36, 37, 38, 39 and 40). It is worth noting that the mamillothalamic tract represents an important landmark in basal ganglia stereotaxy since this tract is easily recognizable in a T2-weighted MRI scan in humans. When located halfway between the anterior and posterior commissures, the mamillothalamic tract marks the best dorsoventral coordinate for approaching the subthalamic nucleus (Plate 39). Finally, the immunohistochemical detection of parvalbumin has been used mainly for the parcellation of a number of structures throughout the midbrain. These include, among others, fiber tracts such as the medial lemniscus, the superior cerebellar peduncle and the medial longitudinal fasciculus.
When using this atlas, it is worth bearing in mind that the brain maps were created using three different monkeys, each one with a different length of the ac–pc line (11.55 mm for coronal plates, 12 mm for sagittal sections and 13 mm in the horizontal plane). Differences in ac–pc length result in slight discrepancy in relation to the point-to-point correlation for a given coordinate across different planes (enclosed maps have their own ac–pc length in each illustrated plane). Nevertheless, we consider the obtained accuracy as adequate, as illustrated in Figs. 2 and 3, in which several examples of coordinates for the GPi and STh were provided, both corrected and uncorrected to facilitate comparisons.
Fig. 2.
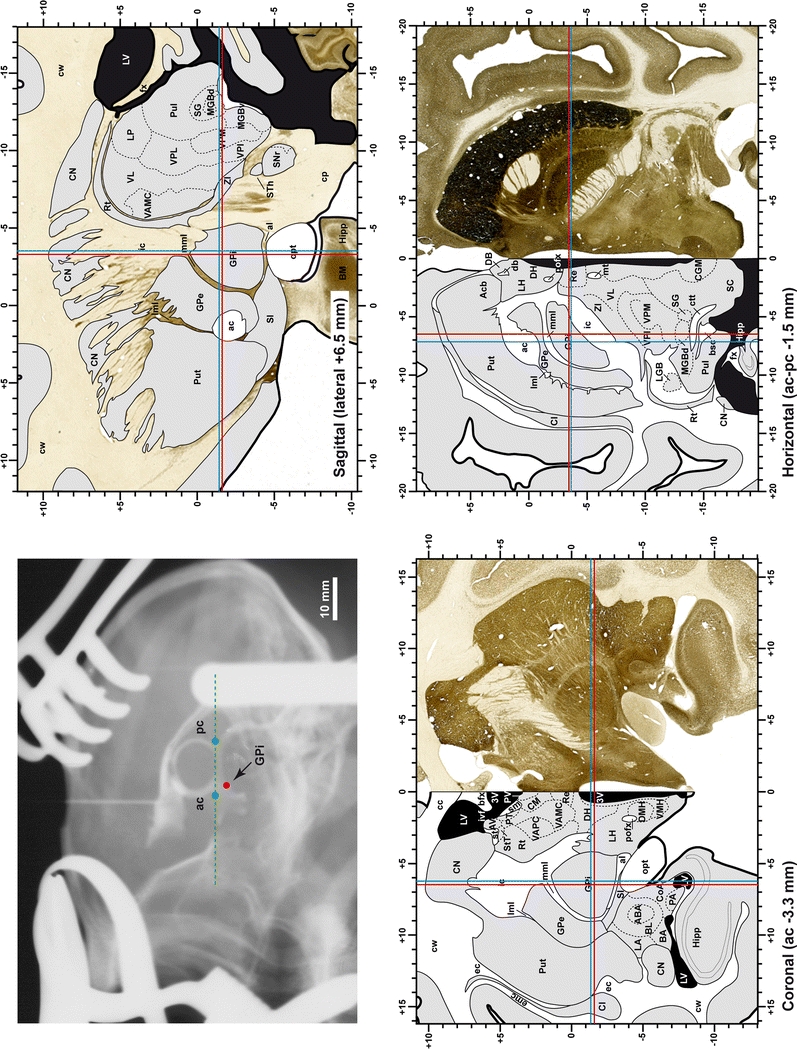
Coordinates for targeting the GPi in the three planes of sectioning. Since the present atlas is based on 3 different monkeys, each one with a different ac–pc length, subtle differences in stereotaxic coordinates could be noticed when moving across different planes. However, the accuracy obtained is adequate when trying to approach the GPi nucleus, as illustrated here when using either the uncorrected (red lines) or corrected (blue lines) coordinates
Fig. 3.
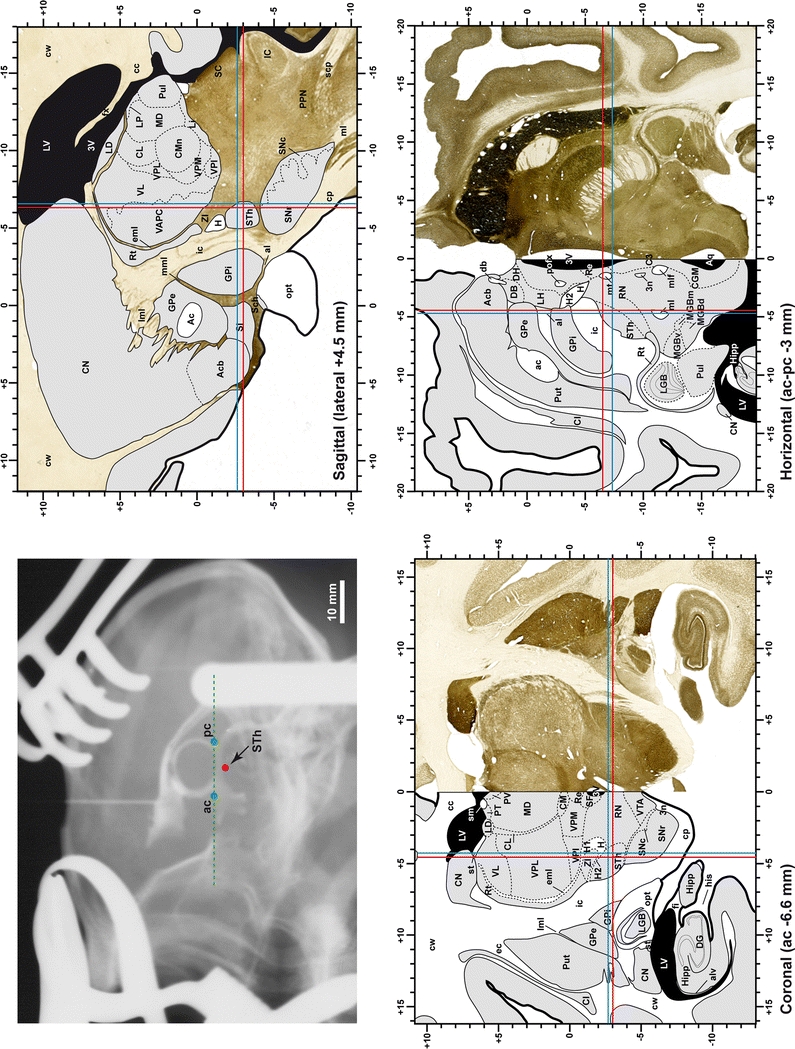
Coordinates for targeting the STH in the three planes of sectioning. Similarly to the GPi (see Fig. 2), the accuracy obtained is also adequate when trying to approach the STh nucleus, as illustrated here when using either the uncorrected (red lines) or corrected (blue lines) coordinates
Discussion
Coronal, sagittal and horizontal template maps of the basal ganglia and thalamus are provided here within a milimetric stereotaxic space of reference based on the ac–pc line. Although emphasis was placed on constructing the atlas as a tool to be used during ventriculography-assisted stereotaxic surgery, this atlas is also useful for MRI-guided surgeries. Brain cartography has been conducted in the non-human primate M. fascicularis (also known as crab-eating monkey, cynomolgus monkey, monkey of Java and Macaca Irus) since this monkey represents the most relevant animal model of Parkinson’s disease.
Nomenclature and abbreviations
In designing a stereotaxic brain atlas, selecting the best nomenclature to be used always represents a difficult and controversial choice, an issue especially important to the parcellation of the thalamus. Such a choice is made even more difficult when trying to conciliate the different views of neurosurgeons and experimental neuroanatomists. Neurosurgeons often rely on Hassler’s nomenclature (1959) of the human thalamus included within the stereotaxic atlas of Schaltebrand and Wahren (1977), the latter still representing the gold standard in human stereotaxy. Although human brain cartography obviously relies solely on cytoarchitectural stains, a number of tract-tracing techniques have been used in monkeys to generate more precise thalamic parcellation (Ilinsky and Kultas-Ilinsky 1987; Percheron et al. 1996). However, a number of problems arise when trying to upgrade data gathered from monkey connectivity to the human thalamus. Although attempts have been made to achieve this (Maachi and Jones 1997), it has been difficult to reach and agreement on this issue. Furthermore, a number of discrepancies concerning the parcellation of the motor thalamus in monkeys are observed among neuroanatomists (Olszewski 1952; Szabo and Cowan 1984; Percheron et al. 1996; Ilinsky and Kultas-Ilinsky 1987, 2002; Martin and Bowden 1996, 1997; Saleem and Logothetis 2007). We clearly recognize the added value of tract-tracing studies in defining better the thalamic-recipient areas of pallidal, nigral and cerebellar afferents and therefore we have adopted, whenever possible, the nomenclature of Ilinsky and Kultas-Ilinsky (1987, 2002) when dealing with segmentation of thalamic nuclei.
Another issue closely related to nomenclature is the type and style of the chosen abbreviations. On the one hand, one can appreciate the efforts made by Paxinos and colleagues to use identical abbreviations for the same structure across species, including chicken, mouse, rat, monkey and human brains (Paxinos and Huang 1995; Paxinos and Watson 2006; Puelles et al. 2007; Franklin and Paxinos 2007; Mai et al. 2008; Paxinos et al. 2009). Such a method allows for consistent inter-species comparisons and ensures that a given brain structure is only represented by one single abbreviation. This is very useful when trying to avoid common mistakes made when two unrelated structures are often abbreviated the same way. For example, using Paxinos’ nomenclature and abbreviations, it is clear that the central medial thalamic nuclei (abbreviated CM) is a midline thalamic nucleus totally unrelated to the centromedian thalamic nucleus (abbreviated CMn), an intralaminar nuclei that belongs to the so-called centromedian-parafascicular complex. On the other hand, we must recognize the added value of the so-called NeuroNames Brain Hierarchy of the non-human primate, initially issued by Bowden and Martin (1995), later used in the stereotaxic atlas published by Martin and Bowden (1996, 1997). NeuroNames is a comprehensive index of brain structures standardized in such a way that it enables the precise placement of a given brain structure within a hierarchical context. Since a hierarchical index based on Paxinos’ nomenclature and abbreviations was not available when preparations for this atlas commenced, we decided to use NeuroNames whenever possible. Furthermore, it is also worth acknowledging that the atlas of M. fascicularis published by Martin and Bowden (1996, 1997) represents our primary reference in monkey stereotaxy, since it was created using the ac–pc line as the bicommissural space of reference.
In addition to these issues, throughout the preparation of this atlas we kept in mind at all times that the primary audience of this atlas will probably be basal ganglia researchers. Consequently, a number of structures have been named and abbreviated according to what is most commonly used in the field. For instance, this applies to the external and internal segments of the globus pallidus (abbreviated here as GPe and GPi, respectively). The abbreviations of GPe and GPi are by far more commonly used in the field rather than GPl (globus pallidus, lateral part) and GPM (globus pallidus, medial part), the latter two terms used by Martin and Bowden (1996, 1997) as well as by Ilinsky and Kultas-Ilinsky (2002). The abbreviations EGP (external globus pallidus) and IGP (internal globus pallidus) are used by Paxinos et al. (2009) and could lead to some confusion since these are only used by a minority of basal ganglia researchers working with non-human primates.
Comparison with other atlases of the monkey brain
Years ago, the existence of export restrictions from India to US curtailed the availability of rhesus monkeys (Macaca mulatta), thus sustaining the increasing usage of M. fascicularis (mainly from Malaysian and Chinese origins) for replacement purposes in the field of neurological research (Szabo and Cowan 1984; Dubach et al. 1985). Although by this time one atlas based on external landmarks was already available for M. fascicularis (Shanta et al. 1968), the increased use of this non-human primate together with the need to improve stereotaxic accuracy paved the way for the emergence of the Szabo and Cowan atlas of M. fascicularis (1984). The backbone of these two formerly available atlases was represented by the method used by Horsley and Clarke (1908) that estimates the location of internal brain nuclei based on external cranial references. Later on, the use of ventriculography to delineate the ac–pc line in monkey surgery (in the same way as conducted in humans by this time) was introduced by several groups (Percheron and Lacourly 1973, Féger et al. 1975, Ilinsky and Kultas-Ilinsky 1982), and therefore, the availability of a stereotaxic atlas based on internal landmarks and the ac–pc line became an urgent need (Dubach et al. 1985). Such a need has been fully satisfied by Martin and Bowden (1997), the first to introduce fully-segmented coronal brain maps based on the ac–pc bicommissural space of reference for ventriculography-assisted stereotaxic surgery. Besides these atlases based on M. fascicularis, it is also worth noting that several modern atlases are available for M. mulatta, one from Paxinos et al. (2009), one from Ilinsky and Kultas-Ilinsky (2002, based on sagittal sections) and another from Saleem and Logothetis (2007), the latter also including horizontal (axial) sections.
Although some of these atlases do approach the surgical ideal, all have their own strengths and weaknesses. The atlas presented here also has its own advantages and limitations. Some of the main caveats are inherent limitations introduced by the way in which the atlas was conceived and later produced. For instance, the atlas is based on three different primates, each one with a different length of the ac–pc line. Secondly, brain segmentation is far from being completed and focuses primarily on the basal ganglia and thalamus. Thirdly, tissue shrinkage was not corrected and since the atlas is made from free-floating sections, there is a slight decrease in accuracy when moving far away from the midline. Different staining procedures could lead to slight differences in tissue shrinkage (that has not been corrected here). In this regard it is worth noting that tissue cryoprotection was performed using the method outlined by Rosene et al. (1986), a procedure that facilitates obtaining frozen sections from large brain specimens without freezing artifact. When compared to other commonly used cryoprotective solutions such as 30% of sucrose, tissue shrinkage is minimized by the use of glycerin/DMSO-aqueous solutions. Fourthly, the way in which the stereotaxic zero point is defined is another issue with a direct impact on the final surgical accuracy. Here, the center of the anterior commissure at the midline is the origin of the stereotaxic space of reference. This theoretical zero point is in fact represented by a commissure with a thickness of approximately 2 mm in any axis (rostrocaudal, dorsoventral and mediolateral axes) and, thus, this thickness contributes to some surgical constraints. Accordingly, one might expect a potential, minimal, bias of 1 mm in any direction for a given coordinate, thus resulting in the appearance of mistargeting issues that particularly holds true when approaching small brain structures lying within the 1 mm range. Finally, although extreme care has been taken during the alignment of the sections, small differences cannot be ruled out since there are inherent differences depending on the way in which the sections were mounted on gelatin-coated slides by our technical personnel. In summary, the best accuracy is always provided for structures more closely located to the midline, whereas accuracy is reduced when dealing with more laterally-located structures. This particularly holds true for cortical sulci and gyri, and this is the main reason why the different areas of the cerebral cortex remained unsegmented here.
Concluding remarks
Neuroimage-assisted stereotaxic surgery in monkeys is becoming increasingly popular. Targeting deep brain structures is a demanding procedure in which surgical success mostly relies on the researcher’s own expertise. By providing stereotaxic coordinates for a number of brain structures in the three main planes of orientation, surgical accuracy could be improved. Subsequently, the number of animals required to complete a given study is minimized, further ensuring the most efficient use of such a precious experimental animal.
Acknowledgments
Expert technical assistance was received at all times from our technicians Ms. Elvira Roda and Ms. Ainhoa Moreno. Supported by the Spanish Government (Ministerios de Salud y de Ciencia e Innovación; grants No. FIS 01/0237, BFI2003-02033, BFU2006-06744, BFU2009-08351and SAF2008-03118-E), CiberNed (grant No. CB06/05/0006), Government of Navarra (Departamento de Salud; Beca “Ortiz de Landázuri”), and by the UTE project/Foundation for Applied Medical Research.
Open Access
This article is distributed under the terms of the Creative Commons Attribution Noncommercial License which permits any noncommercial use, distribution, and reproduction in any medium, provided the original author(s) and source are credited.
Abbreviations
- 3n
Oculomotor nerve fibers
- 3V
Third ventricle
- 4
Trochlear nucleus
- 4n
Trochlear nerve
- 5n
Trigeminal nerve
- ABA
Accessory basal amygdaloid nucleus
- ac
Anterior commissure
- Acb
Nucleus accumbens
- AD
Anterodorsal nucleus
- al
Ansa lenticularis
- alv
Alveus
- AM
Anteromedian nucleus
- Amg
Amygdaloid complex
- APS
Anterior perforated substance
- Aq
Aqueduct
- AV
Anteroventral nucleus
- BA
Basal amygdaloid nucleus
- bfx
Body of fornix
- bic
Brachium of inferior colliculus
- BL
Basolateral amygdaloid nucleus
- BM
Basomedial amygdaloid nucleus
- bsc
Brachium of superior colliculus
- C3
Central oculomotor nucleus
- cc
Corpus callosum
- CD
Central dorsal nucleus
- CeA
Central amygdaloid nucleus
- CGM
Central gray matter
- cic
Commissure inferior colliculus
- Cl
Claustrum
- CL
Central lateral nucleus
- CM
Central medial nucleus
- CMn
Centromedian nucleus
- cmg
Capsule of medial geniculate body
- CN
Caudate nucleus
- CoA
Cortical amygdaloid nucleus
- cp
Cerebral peduncle
- csc
Commissure of superior colliculus
- ctg
Central tegmental tract
- ctt
Corticotectal tract
- cw
Cerebral white matter
- D3
Dorsal oculomotor nucleus
- db
Diagonal band
- DB
Nucleus of diagonal band
- DG
Dentate gyrus
- DH
Dorsal hypothalamic area
- DMH
Dorsomedial hypothalamic nucleus
- DS
Dorsal septal nuclei
- ec
External capsule
- emc
Extreme capsule
- eml
External medullary lamina
- fi
Fimbria
- fr
Fasciculus retroflexus
- GPe
Globus pallidus, external division
- GPi
Globus pallidus, internal division
- H
Field H (of Forel)
- H1
Field H1 (of Forel)
- H2
Field H2 (of Forel)
- hbc
Habenular commissure
- Hipp
Hippocampus
- his
Hippocampal sulcus
- ic
Internal capsule
- IC
Inferior colliculus
- iml
Internal medullary lamina
- ivf
Intraventricular foramen (of Monro)
- LA
Lateral amygdaloid nucleus
- LD
Laterodorsal nucleus
- LGB
Lateral geniculate body
- LHb
Lateral habenula
- LH
Lateral hypothalamic area
- Li
Nucleus limitans
- ll
Lateral lemniscus
- LM
Lateral mammillary nucleus
- lml
Lateral medullary lamina
- LP
Lateral posterior nucleus
- LS
Lateral septal nuclei
- LV
Lateral ventricle
- mcp
Middle cerebellar peduncle
- MD
Mediodorsal nucleus
- MeA
Medial amygdaloid nucleus
- MGB
Medial geniculate body
- MGBd
Medial geniculate body, dorsal division
- MGBm
Medial geniculate body, medial division
- MGBv
Medial geniculate body, ventral division
- MHb
Medial habenula
- ml
Medial lemniscus
- mlf
Medial longitudinal fasciculus
- MM
Medial mammillary nucleus
- mml
Medial medullary lamina
- MS
Medial septal nucleus
- mt
Mammillothalamic tract
- mtg
Mammillotegmental fasciculus
- olf
Olfactory tract
- opt
Optic tract
- PA
Periamygdaloid area
- pc
Posterior commissure
- PC
Paracentral nucleus
- pcfx
Posterior column of fornix
- PF
Parafascicular nucleus
- Pg
Pregeniculate nucleus
- PH
Posterior hypothalamic area
- Pn
Pontine nuclei
- pofx
Postcommissural fornix
- PPd
Peripeduncular nucleus
- PT
Paratenial nucleus
- Put
Putamen
- Pul
Pulvinar
- PV
Paraventricular thalamic nucleus
- Re
Reuniens nucleus
- RN
Red nucleus
- Rt
Reticular nucleus
- S
Subiculum
- SC
Superior colliculus
- Sch
Suprachiasmatic nucleus
- scp
Superior cerebellar peduncle
- SF
Subparafascicular nucleus
- SG
Suprageniculate nucleus
- SI
Substantia innominata
- sm
Stria medullaris
- SNc
Substantia nigra pars compacta
- SNr
Substantia nigra pars reticulata
- spt
Septum pellucidum
- st
Stria terminalis
- STh
Subthalamic nucleus (of Luys)
- StT
Nucleus of stria terminalis
- V3
Ventral oculomotor nucleus
- VA
Ventral anterior nucleus
- VAMC
Ventral anterior nucleus, magnocellularis
- VAPC
Ventral anterior nucleus, parvicellularis
- VL
Ventral lateral nucleus
- VLM
Ventral lateral nucleus, medial part
- VLO
Ventral lateral nucleus, oral part
- VMH
Ventromedial hypothalamic nucleus
- VPI
Ventral posteroinferior nucleus
- VPL
Ventral posterolateral nucleus
- VPM
Ventral posteromedial nucleus
- VTA
Ventral tegmental area
- xscp
Decussation superior cerebellar peduncle
- ZI
Zona incerta
References
- Bowden DM, Martin RF. NeuroNames brain hierarchy. Neuroimage. 1995;2:63–83. doi: 10.1006/nimg.1995.1009. [DOI] [PubMed] [Google Scholar]
- Dubach MF, Tongen VC, Bowden DM. Techniques for improving stereotaxic accuracy in Macaca fascicularis. J Neurosci Meth. 1985;13:163–169. doi: 10.1016/0165-0270(85)90029-9. [DOI] [PubMed] [Google Scholar]
- Féger J, Ohye C, Gallouin F, Albe-Fessard D. Stereotaxic technique for stimulation and recording in nonanesthetized monkeys: application to the determination of connections between caudate nucleus and substantia nigra. In: Advances in neurology. New York: Raven Press; 1975. pp. 35–45. [PubMed] [Google Scholar]
- François C, Yelnik J, Percheron G. A stereotaxic atlas of the basal ganglia in macaques. Brain Res Bull. 1996;41:151–158. doi: 10.1016/0361-9230(96)00161-x. [DOI] [PubMed] [Google Scholar]
- Franklin K, Paxinos G. The mouse brain in stereotaxic coordinates, 3rd edn. San Diego: Academic Press; 2007. [Google Scholar]
- Geneser-Jensen FA, Blackstad TW. Distribution of acetyl cholinesterase in the hippocampal region of the guinea pig. I. Entorhinal area, parasubiculum, and presubiculum. Z Zellforsch Mikrosk Anat. 1971;114:460–481. doi: 10.1007/BF00325634. [DOI] [PubMed] [Google Scholar]
- Graybiel AM, Ragsdale CW. Histochemically distinct compartments in the striatum of human, monkey and cat demonstrated by acetylcholinesterase staining. Proc Natl Acad Sci. 1978;75:5723–5726. doi: 10.1073/pnas.75.11.5723. [DOI] [PMC free article] [PubMed] [Google Scholar]
- Hassler R (1959) Anatomy of the thalamus. In: Schaltenbrand G, Baily P (eds) Introduction to stereotaxis with an atlas of the human brain, Thieme, Stuttgart, pp 230–290
- Horsley V, Clarke RH. The structure and functions of the cerebellum examined by a new method. Brain. 1908;31:54–124. [Google Scholar]
- Ilinsky IA, Kultas-Ilinsky K. Stereotaxic surgery in the Rhesus monkey (Macaca mulatta) utilizing intracerebral landmarks. Appl Neurophysiol. 1982;45:563–572. doi: 10.1159/000101664. [DOI] [PubMed] [Google Scholar]
- Ilinsky IA, Kultas-Ilinsky K. Sagittal cytoarchitectonic maps of the Macaca mulatta thalamus with a revised nomenclature of the motor-related nuclei validated by observations of their connectivity. J Comp Neurol. 1987;262:331–364. doi: 10.1002/cne.902620303. [DOI] [PubMed] [Google Scholar]
- Ilinsky IA, Kultas-Ilinsky K. Stereotactic atlas of the Macaca mulatta thalamus and adjacent basal ganglia nuclei. New York: Kluver Academic/Plenum Publishers; 2002. [Google Scholar]
- Krout KE, Jenkins JM, Loewy AD. High-resolution scanner for neuroanatomical analysis. J Neurosci Meth. 2002;113:37–40. doi: 10.1016/S0165-0270(01)00471-X. [DOI] [PubMed] [Google Scholar]
- Maachi G, Jones EG. Towards an agreement on terminology of nuclear and subnuclear divisions of the motor thalamus. J Neurosurg. 1997;86:670–685. doi: 10.3171/jns.1997.86.4.0670. [DOI] [PubMed] [Google Scholar]
- Mai JK, Paxinos G, Voss T. Atlas of the human brain, 3rd edn. San Diego: Academic Press; 2008. [Google Scholar]
- Martin RF, Bowden DM. A stereotaxic template atlas of the macaque brain for digital imaging and quantitative neuroanatomy. Neuroimage. 1996;4:119–150. doi: 10.1006/nimg.1996.0036. [DOI] [PubMed] [Google Scholar]
- Martin RF, Bowden DM. Template atlas of the primate brain. Seattle: University of Washington; 1997. [Google Scholar]
- Martin RF, Bowden DM. Primate brain maps: structure of the macaque brain. Amsterdam: Elsevier; 2000. [Google Scholar]
- Morel A. Stereotactic atlas of the human thalamus and basal ganglia. New York: Informa Healthcare; 2007. [Google Scholar]
- Olszewski J. The thalamus of Macaca mulatta. Basel: An atlas for use with stereotactic instruments. Karger; 1952. [Google Scholar]
- Paxinos G, Huang XF. Atlas of the human brainstem. San Diego: Academic Press; 1995. [Google Scholar]
- Paxinos G, Watson C. The rat brain in stereotaxic coordinates, 6th Edn. San Diego: Academic Press; 2006. [Google Scholar]
- Paxinos G, Huang XF, Petrides M, Toga AW. The rhesus monkey brain in stereotaxic coordinates, 2nd edn. San Diego: Academic Press; 2009. [Google Scholar]
- Percheron G, Lacourly N. L’imprecision de la stereotaxie thalamique utilisant les coordonnées craniennes de Horsley-Clarke chez le macaque. Exp Brain Res. 1973;18:355–373. doi: 10.1007/BF00239105. [DOI] [PubMed] [Google Scholar]
- Percheron G, François C, Talbi B, Yelnik J, Fénelon G. The primate motor thalamus. Brain Res Rew. 1996;22:93–181. [PubMed] [Google Scholar]
- Puelles L, Martínez-de-la-Torre M, Paxinos G, Watson C, Martínez S. The chick brain in stereotaxic coordinates. San Diego: Academic Press; 2007. [Google Scholar]
- Rosene DL, Roy NJ, Davis BJ. A cryoprotection method that facilitates cutting frozen sections of whole monkey brain for histological and histochemical processing without freezing artifact. J Histochem Cytochem. 1986;34:1301–1316. doi: 10.1177/34.10.3745909. [DOI] [PubMed] [Google Scholar]
- Saleem KS, Logothetis NK. A combined MRI and histology atlas of the rhesus monkey brain in stereotaxic coordinates. San Diego: Academic Press; 2007. [Google Scholar]
- Schaltebrand G, Wahren W. Atlas for stereotaxy of the human brain. Stuttgart: Thieme; 1977. [Google Scholar]
- Shanta TR, Manocha SL, Bourne GH. A stereotaxic atlas of the java monkey brain (Macaca irus) Basel: Karger; 1968. [Google Scholar]
- Szabo J, Cowan WM. A stereotaxic atlas of the brain of the cynomolgus monkey (Macaca fascicularis) J Comp Neurol. 1984;222:265–300. doi: 10.1002/cne.902220208. [DOI] [PubMed] [Google Scholar]
- Tailarach J, David M, Tournoux P, Coredor H, Kvasina T. Atlas d’anatomie stéréotaxique. Paris: Masson; 1957. [Google Scholar]