

Abstract
Species that exhibit geographically defined phenotypic variation traditionally have been divided into subspecies. Subspecies based on phenotypic features may not comprise monophyletic groups due to selection, gene flow, and/or convergent evolution. In many taxonomic groups the number of species once designated as widespread is dwindling rapidly, and many workers reject the concept of subspecies altogether. We tested whether currently recognized subspecies in the plain-bellied watersnake Nerodia erythrogaster are concordant with relationships based on mitochondrial markers, and whether it represents a single widespread species. The range of this taxon spans multiple potential biogeographic barriers (especially the Mississippi and Apalachicola Rivers) that correspond with lineage breaks in many species, including other snakes. We sequenced three mitochondrialgenes (NADH-II, Cyt-b, Cox-I) from 156 geo-referenced specimens and developed ecological niche models using Maxent and spatially-explicit climate data to examine historical and ecological factors affecting variation in N. erythrogaster across its range. Overall, we found little support for the recognized subspecies as either independent evolutionary lineages or geographically circumscribed units and conclude that although some genetic and niche differentiation has occurred, most populations assigned to N. erythrogaster appear to represent a single, widespread species. However, additional sampling and application of nuclear markers are necessary to clarify the status of the easternmost populations.
Keywords: Nerodia erythrogaster, Natricinae, Subspecies, Thamnophiinae, Watersnake, Phylogeography, Ecological niche modeling
Introduction
A major focus of evolutionary biology is how selective pressures and barriers to dispersal may lead to divergence and speciation. Incongruence between evolutionary relationships and morphological, life history, and other features can occur when these traits are under selection and reflect local adaptation rather than historical relationships (e.g., Bonett and Chippindale, 2004; Titus and Larson, 1996; Watts et al., 2004; Wiens and Penkrot, 2002; Wiens et al., 2003). Nonetheless, well-supported incongruence between phenotypic and genetic data may not be as common as often thought (e.g., Hillis and Wiens, 2000).
Wilson and Brown (1953) defined subspecies as “genetically distinct, geographically separate populations belonging to the same species and therefore interbreeding freely at the zones of contact.” Historically, taxonomists described subspecies according to geographically consistent morphological variation, assuming that the history of the species is accurately represented by such traits (Burbrink, 2001), a practice that Wilson and Brown (1953) cautioned against. Not surprisingly, discrepancies among morphologically defined subspecies and molecular-based assessments of relationships have been documented extensively (Burbrink et al., 2000; Doukakis et al., 1999; Haig et al., 2006; Walker et al., 1998).
Conversely, several geographically and morphologically distinct “subspecies” have been shown to be different species (Coykendall, 1977; Maijer, 1996; Pyron and Burbrink, 2009b; Raxworthy et al., 2007), and for decades many workers have argued against use of the subspecies as a valid taxonomic category or evolutionary unit (Frost and Hillis, 1990; Frost et al., 1992; Zink, 2004). Discussion of the conceptual basis and practical application of the subspecific designation is beyond the scope of this paper (see Smith et al., 1997 for further discussions). Here we present a comprehensive molecular analysis of the plain-bellied watersnake (Nerodia erythrogaster) and test whether it represents a widespread, geographically variable species or a complex of distinct evolutionary species lineages previously relegated to the status of subspecies.
Multiple subspecies of Nerodia erythrogaster (Forster, 1771) have been described using few morphological characters. This taxon ranges from the eastern United States (Fig. 1) into Mexico in the northeastern states of Coahuila, Nuevo Leon, Tamulipas, Durango, and Zacatecas; the type locality for the nominate subspecies Nerodia [formerly Natrix] e. erythrogaster is “near Parker’s Ferry, Edisto River Swamp, Charleston County, South Carolina-approximately 16 miles west of the city of Charleston” (see Conant, 1949). Currently, six subspecies are recognized (Fig. 1; see Gibbons and Dorcas, 2004 for taxonomic history) and are distinguished by a combination of geographic range, coloration and pattern, and to a very limited extent scale counts. Four of these (N. e. erythrogaster, flavigaster, neglecta, and transversa) occur in the contiguous United States, while N. e. alta and bogerti are restricted to Mexico. While the taxonomy of the species was debated for many years, Conant’s (1949) synopsis remains the currently accepted view. Conant subscribed to the concept of subspecies as fluid and interbreeding subunits of species that display substantial geographic consistency with respect to phenotypic variation. He recognized and described two of the subspecies as parapatrically distributed entities based primarily on coloration and pattern, but found little clear-cut differentiation and attributed much of the geographically overlapping morphological variation to intergradation. Although the life history and ecology of N. erythrogaster haas been well studied (see Gibbons and Dorcas [2004] and references therein), few molecular data are available to assess its evolutionary history.
Figure 1.
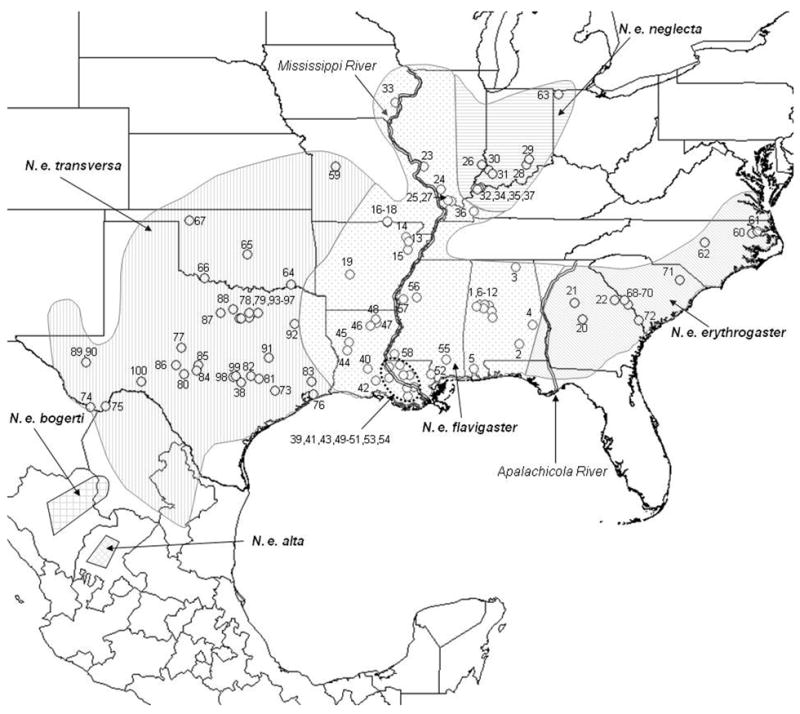
Map depicting species range, subspecies breaks, and collecting localities. Due to the spatial scale of the map, not all localities are discernable, although detailed information is available in Appendix I.
Several putative subspecies of snakes with similar distributions have been analyzed in a phylogenetic/phylogeographic context. Some of these, including the North American ratsnake, Elaphe obsoleta (Burbrink et al., 2000), the cornsnake, E. guttata (Burbrink, 2002), the black racer, Coluber constrictor (Burbrink et al., 2008), and the common kingsnake, Lampropeltis getula (Pyron and Burbrink, 2009a), were shown to contain monophyletic groups divided by the Mississippi and/or Apalachicola River. Others, such as cottonmouths, Agkistrodon piscivorus, copperheads, A. contortrix (Guiher and Burbrink, 2008), and ringneck snakes, Diadophis punctatus (Fontanella et al., 2008), showed no differentiation across these potential barriers. If distinct evolutionary lineages are identified or suspected to occur, it is also of interest to determine the extent of ecological differentiation among them. Ecological differentiation encompasses biotic (e.g., diet, intra- and interspecific interactions, etc.) and abiotic (e.g., temperature, precipitation, substrate, etc.) factors. Quantifying the extent of ecological divergence with respect to biotic factors in particular is difficult. However, measuring the extent of divergence in the ecological niche using georeferenced natural history collection (NHC) data and spatially-explicit climate data has become a widespread and useful way to assess divergence in response to abiotic factors. Niche differentiation has been demonstrated for many closely related taxa (e.g., Parra et al., 2004; Wiens et al., 2006) and may act as a reinforcement mechanism in zones of potential contact between lineages (Rissler and Apodaca, 2007). In addition, some authors (Graham et al., 2004; Raxworthy et al., 2007; Wiens et al., 2006) have argued that ecological differentiation can play an integral role in identification of distinct evolutionary lineages, and may even be an inherent feature of species themselves.
Here we 1) provide a comprehensive analysis of mitochondrial genetic variation in N. erythrogaster throughout its range and test for the existence of distinct evolutionary lineages; 2) assess validity of the currently recognized subspecies; 3) determine whether geographic genetic variation corresponds to that seen in other species or species groups with respect to potential biogeographic barriers (especially theMississippi and Apalachicola Rivers); and 4) test for ecological niche differentiation among lineages and/or recognized subspecies.
Methods
Specimens
Tissues were collected from scale clips (photographed and released specimens) or liver samples (euthanized specimens). All tissue samples, photographs, and specimens were deposited into either the University of Alabama Herpetology Collection or the University of Texas Amphibian and Reptile Diversity Research Center. Samples were also obtained through tissue loans from various museums and from private collections (see Acknowledgments). Outgroups taxa were Nerodia sipedon, N. taxispilota, N. cyclopion, N. rhombifer, Farancia abacura, and Thamnophis sirtalis whose sequences were downloaded from Genbank or obtained in this study. A total of 156 ingroup specimens (Appendix I) from 100 localities were used in this study (Fig. 1). All specimens were assigned to currently recognized subspecies based on collection locality (Gibbons and Dorcas, 2004) that was either geocoded or otherwise rigorously documented.
Sequencing
DNA was extracted using standard protocols (Qiagen Inc., Valencia, CA). Digestion times ranged from three hours for liver samples to 24 hours for scale clips. We obtained partial sequences of the mitochondrial cytochrome b (Cyt-b), nicotinamide adenine dinucleotide subunit II (NADH-II), and cytochrome oxidase I (Cox-I) genes and the nuclear proto-oncogene C-mos.
Cyt-b PCR conditions consisted of an initial denaturation at 94 C for 3 minutes followed by 35 cycles of 94 C for 15 seconds, 46 C for 30 seconds, and 72 C for 90 seconds and a final extension at 72 C for 7 minutes (forward primer: 5’ CCA GTA GGA CTA AAC ATT TCA ACC TCA ACC TGA TGA 3’; reverse primer: 5’ TGG TGT TTC TAC TGG TTT TGT GGC TGA GGC TGA TCA 3’). PCR protocols for NADH-II, Cox-I and C-mos were the same as for Cyt-b except the annealing temperature was 55.5 C for NADH-II (forward primer: 5’ CGC AAC AAA ATA CTA CCT CAC CC 3’; reverse primer: 5’ GAT TTT ATT GGT GTG AGT GTG GTG TG 3’), 52.0 C for Cox-I (forward primer:5’ TCA GCC ATA CTA CCT GTG TTC A 3’; reverse primer: 5’ TAG ACT TCT GGG TGG CCA AAG AAT CA 3’), and 53.2 C for C-mos (forward primer: 5’ CAT GGA CTG GGA TCA CTT ATG 3’; reverse primer: 5’ CCT TGG GTG TGA TTT TCT CAC CT 3’).
PCR samples were purified by gel extraction (Qiagen) or ExoSapIt (United States Biochemical) and either sent to Macrogen (Korea) for sequencing or sequenced on an Applied Biosystems 3130xl sequencer. All PCR products were sequenced for both strands. Forward and reverse sequences were compared in Sequencher 4.6 (Gene Codes Corporation) and the consensus sequences were aligned using ClustalW (Chenna et al., 2003; Larkin et al., 2007) in Macvector 9.0. Alignments were unambiguous with no gaps.
Phylogenetic Analyses
C-mos showed less than 0.5% pairwise divergence for 20 range-wide specimens and therefore was excluded from further phylogeographic analyses (although we are assessing its validity for follow-up studies of gene flow). Aligned sequences totaled 837 bases for Cyt-b, 665 bases for NADH-II, and 627 bases for Cox-I. Phylogenetic analyses were conducted using individual genes and all three genes combined. To determine the appropriate model of evolution under the Akaike Information Criterion (AIC) for each gene, an NJ starting tree was used in Modeltest 3.7 (Posada and Crandall, 1998). PAUP* 4.0 beta (Swofford, 1999) was used to run maximum likelihood (ML) analyses and TNT (Goloboff et al., 2008) was used in the maximum parsimony (MP) analyses. Both MP and ML analyses were run with random-taxon-addition sequences and TBR swapping with 10 repetitions. Modeltest 3.7 was rerun using the best ML tree as the starting tree to optimize the model of evolution. These parameters were used in a subsequent ML analysis and the new best tree score was compared to the previous best tree score. This process was repeated until the best tree likelihoods in sequential iterations were equal. Bootstrap support was conducted with 1000 pseudoreplicates for MP and ML analyses (conducted in Garli 0.942 [Zwickl, 2006]).
The best ML tree for each gene was used to determine the appropriate model of evolution for Bayesian analyses in MrModelTest 2 (Nylander, 2004). These parameters were input into MrBayes 3.1.2 (Huelsenbeck and Ronquist, 2001; Ronquist and Huelsenbeck, 2003) for 20,000,000 generations with four chains, two repetitions, four swaps per generation, sampling every 1,000 generations, and partitioned by codon position. Analyses were extended if the standard deviation of split frequencies was >0.05 and were allowed to stop early if the standard deviation of split frequencies was < 0.001. Convergence criteria were further checked in AWTY (Nylander et al., 2008). The first 2.5 to 5.0 million generations were discarded as burnin.
Total evidence (TE) analyses were run using MP and ML by concatenating the three genes and using the same methods as above. For the Bayesian TE analysis, genes were concatenated and analyzed partitioned by gene and codon position. A priori hypotheses (see below) were tested by running TE analyses in MrBayes 3.1.2 with topological constraints under the same conditions as above and compared using Bayes factors.
Statistical tests
To test whether subspecies (assigned based on specimen locality) are monophyletic, we constrained each subspecies as monophyletic in separate Bayesian analyses. Since two of the populations sampled are in close proximity to the N. e. erythrogaster / N. e. flavigaster boundary (Fig. 1; populations 2 and 4), we conducted four separate analyses where the two populations were assigned in all possible taxonomic combinations. Specifically, hypothesis one (e1) excluded both populations from the N. e. erythrogaster lineage, hypothesis two (e2) included both populations, hypothesis three (e3) excluded population 4 and included population 2, and hypothesis four (e4) excluded population 2 and included population 4. We also constrained N. e. neglecta and N. e transversa as monophyletic and tested the phylogeographic hypotheses by constraining populations east and west of the Mississippi and Apalachicola (same as hypothesis e1 above) rivers as monophyletic. The eight a priori hypotheses of monophyly were compared to the best TE tree using Bayes factors. We followed the methods of Kass and Raftery (1995) which have been implemented in multiple phylogenetic analyses (Brandley et al., 2005; Nylander et al., 2004; Palero et al., 2009). We considered H0 to be that the a priori hypotheses explain the data as well as the best tree while H1 assumed that constrained searches provide a poorer fit for the data. Bayes factors were calculated as twice the difference of -ln likelihood harmonic means between competing hypotheses using the harmonic mean output in MrBayes. We interpreted Bayes factor values <0 as evidence against H1, while positive values provide either little or no support for H1 (0-2), positive support for H1 (2-6), strong support for H1 (6-10), or very strong support for H1 (>10).
We also performed a principal coordinates analysis (PCoA) in GenAlEx v.6.1 using the Apalachicola River (similar to hypothesis e1 above) and Mississippi River as glneage boundaries, based on biogeographic breaks reported in snakes as well as several non-squamates (Soltis et al., 2006; Swenson and Howard, 2005). We specified codominant data and the PCoA was calculated under the standardized covariance settings. We then used discriminant analysis to quantify genetic divergence between subspecies by examining the correct assignment proportion during cross validation with the PCoA factors and comparing this to the Overall Chance Proportion (OCP). The OCP was computed as , where N is the total sample size, j identifies each group, J is the total number of groups, qj is prior probability of membership into group j, and nj is the sample size of group j (Huberty and Olejnik, 2006). We calculated the prior probability of membership in each as the overall group proportion. As a descriptive measure of classification accuracy, we followed the suggestion of Hair et al. (1998) that classification accuracy should be at least 25% greater than by chance and refer to this as the Minimal Classification Accuracy (MCA).
GenAlEx was used to test for isolation by distance (IBD) and DnaSP 3.52 was used to examine nucleotide diversity and to detect signatures of population expansion with Tajima’s D.
Ecological Niche Modeling Methods
Ecological niche models for well supported major mt lineages and the recognizedsubspecies were created using Maxent version 3.2.19 (Phillips et al., 2006) implementing 19 climatic layers downloaded from the WorldClim database (http://www.worldclim.org/) at 30 sec resolution. We used default settings (e.g., duplicate records removed; regularization multiplier=1; convergence threshold=0.00001; maximum iterations=500) and a 25% training percentage. The models were for the continental United States. To test whether major lineages or subspecies were associated with unique environmental niche space, we extracted the spatially-explicit climate data at each point locality (Appendix I) using DIVA version 5.2.0.2. Principal components analysis (PCA) on the covariance matrix was used to reduce the number of climatic variables and PCA axis scores (the ones needed to account for >90% of the variability) were then entered as the dependent variable in a multivariate analysis of variance (MANOVA) with major lineage or subspecies as the fixed factor. Normality and variance assumptions were checked by examining residuals. We then used discriminant analyses to quantify ecological divergence between major lineages and subspecies by examining the correct assignment proportion during cross validation with the PCoA factors and comparing this to the overall chance proportion (as described above). To assess whether genetic distance was positively correlated with environmental distance while controlling for geographic distance, we used partial Mantel tests in R-package 4.0 (Casgrain and Legendre, 2001). Significant results suggest that phylogenetic breaks are correlated with (or potentially caused by) environmental gradients. Genetic distances were calculated in Paup* 4.0 beta using the model of evolution determined by Modeltest 3.7 (Posada and Crandall, 1998) for the combined dataset and tree reported in Fig. 2. Ecological distances were based on Euclidean distances of the PCA factor scores.
Figure 2.
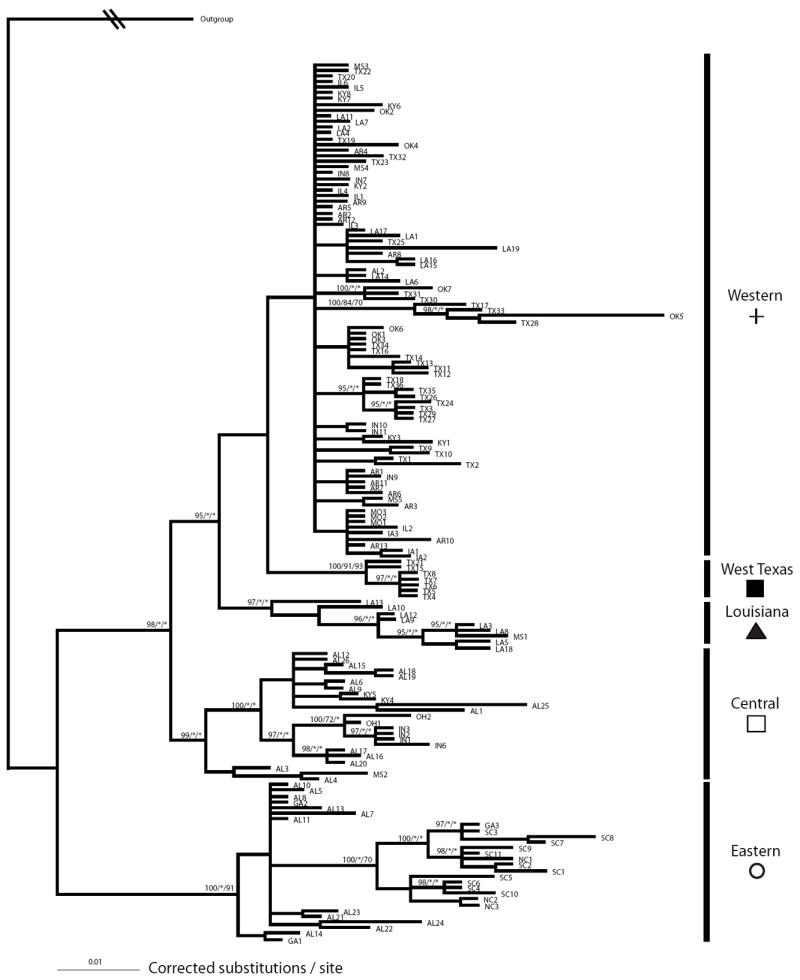
Bayesian phylogram produced using a total evidence approach with Cyt-b, NADH-II, and COX-I. Numbers above nodes correspond to the posterior probability / maximum likelihood bootstrap proportion (BP) / parsimony BP. Outgroups have been collapsed and their branch length shortened.
Species Concept
We use the Evolutionary Species Concept (Wiley, 1978, 1981) as our theoretical concept. Due to the use solely of mt characters, our operational concept defines species based on the concordance principles for species recognition (Avise and Ball, 1990); in this case, reciprocally monophyletic, geographically isolated lineages that exist in distinct ecological niche space.
Results
Analyses of individual genes yielded similar phylogenetic hypotheses, so only results of the total evidence analysis are reported. Two thousand one hundred and twenty nine base-pairs of combined data yielded 43 unique haplotypes and 177 variable sites, of which 98 were parsimony informative for the ingroup. The model of evolution (for likelihood searches) for all genes together was TIM + I + G: Base frequencies of A = .3244, C = .3172, G = .1103, T = .2480; substitution rate parameters A-C = 1.0000, A-G = 16.5537, A-T = 1.3404, C-G = 1.3404, C-T = 9.2494, G-T = 1.0000; proportion of invariable sites = 0.5866; gamma distribution shape parameter = 1.2360. The model chosen for each gene in the Bayesian analysis was GTR + I + G. MP analysis yielded 80 equally parsimonious trees with 946 steps. The best tree for ML had a −ln likelihood score of 7,986.55.
Bayesian and ML phylogenetic analyses yielded similar topologies, so only the Bayesian tree is shown (Fig. 2). There was little resolution in the MP consensus tree, even when a 50% majority rule was calculated. Support for most nodes was minimal, but five “major” mitochondrial (mt) lineages were significantly (>0.95 posterior probability and/or >0.70 bootstrap proportion) supported (Fig. 2). Only one of (Eastern mt clade) was substantially concordant with taxonomy based on geography (N. e. erythrogaster; Fig. 3). This mt clade also occurs primarily east of the Apalachicola River (all populations east of the Apalachicola belonged to this mt clade although “Eastern” haplotypes were identified up to almost 300 km west of the river as well). To determine if a monophyletic N. e. erythrogaster subspecies is much less likely than the unconstrained phylogeny, we computed the Bayes factors for each hypothesis described in the methods. All comparisons between a priori hypotheses and the recovered “best” tree resulted in Bayes factors greater than 45 (Table 1), signifying very strong evidence against any of the a priori hypotheses.
Figure 3.
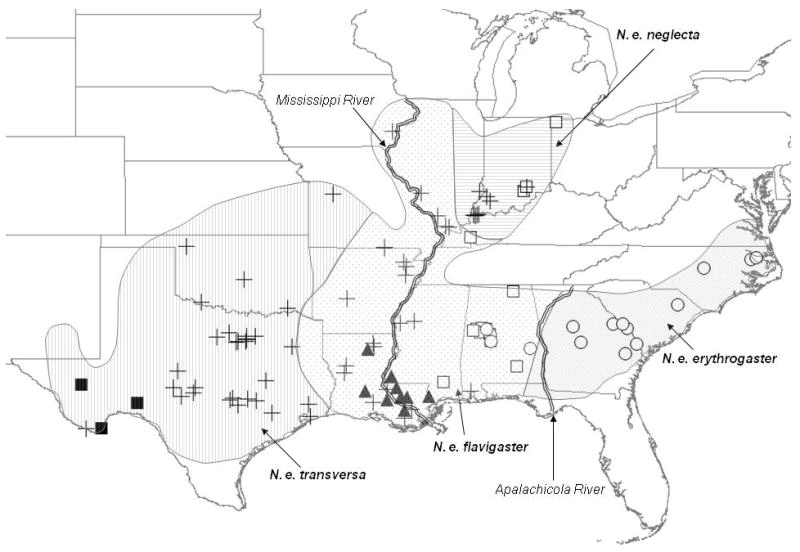
Map depicting species range, subspecies breaks, and major lineage for each sample. See Fig. 2 for symbol definitions.
Table 1.
Hypotheses of monophyly, their corresponding likelihood scores, and the Bayes factor associated with each a priori hypothesis compared to the best tree.
| Hypothesis | -ln likelihood harmonic mean | Bayes factor | Support against a priori hypothesis |
|---|---|---|---|
| e1 (Apalachicola River) | -8084.9 | 199.6 | Very strong |
| e2 | -8096.9 | 223.6 | Very strong |
| e3 | -8022.5 | 74.8 | Very strong |
| e4 | -8033.6 | 97.0 | Very strong |
| neglecta | -8007.8 | 45.4 | Very strong |
| transversa | -8179.7 | 389.2 | Very strong |
| flavigaster | -8166.9 | 363.6 | Very strong |
| Mississippi River | -8094.87 | 219.54 | Very strong |
| Best tree | -7985.1 | - | - |
There was significant isolation by distance across the species (r=0.3389, P = 0.05). We found signatures of population expansion when all specimens were analyzed together (Tajima’s D = -1.81763, P < 0.05), but none of the individual major mt lineages showed the same pattern (all P’s > 0.10). The principal coordinates analysis (PCoA), where individuals were grouped by subspecies using mt characters, recovered three separate groups (Fig. 4). Two of these are amalgamations of at least three recognized subspecies, but the third consists of only three haplotypes. When PCoA factors were used in the discriminant analysis with subspecies as the grouping factor, the analysis correctly assigned specimens to their putative subspecies 53.2% of the time (which is above the MCA of 41.2%), but the variation in accuracy of assignment across subspecies was large. For N. e. erythrogaster, 17/17 (100%) of specimens from within the defined range of the subspecies were assigned to the correct subspecies, whereas only 5/21 (26.3%) of N. e. neglecta, 23/72 (31.9%) of N. e. flavigaster, and 38/46 (86.9%) of N. e. transversa were correctly assigned.
Figure 4.
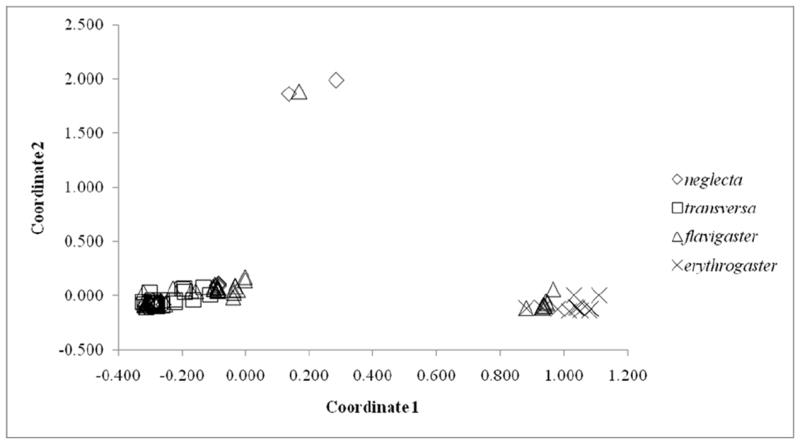
PCoA results with geographically defined subspecies as the grouping factor.
Ecological niche models (ENMs) of the five major mt lineages and subspecies showed a high degree of over-prediction for the ENM outside of the known range of each (not shown). The PCA also showed little separation among the tested groups; i.e., the major mt lineages and subspecies each demonstrated substantial overlap in their multivariate distributions (Fig. 5). The first component loaded heavily on precipitation variables (driest quarter, wettest quarter, seasonality) as well as annual temperature range; the second component loaded heavily on annual mean temperature, mean temperature of the coldest quarter, and temperature seasonality (Fig. 5). However, the environmental conditions varied significantly across the mt lineages (Wilks’ Lambda=0.20989, d.f.=16,452, P<0.05), and the discriminant analysis correctly assigned specimens to their group 66.0% of the time (MCA=48.7%). Environmental conditions also varied significantly across subspecies (Wilks’ Lambda=0.11622, d.f.=12,391, P<0.05) and discriminant analysis correctly assigned specimens to groups 78.2% of the time (MCA is 41.2%). The partial Mantel test showed no significant relationship between genetic and environmental divergence (r=0.0467, P=0.162), suggesting that genetic divergence was not driven by sharp transitions across environmental gradients. Due to the low level of ecological differentiation as evidence by the overlap of mt lineages high level of sympatry, we present only the bioclimatic model results for the Eastern and “non-Eastern” mt lineages (Fig. 6).
Figure 5.
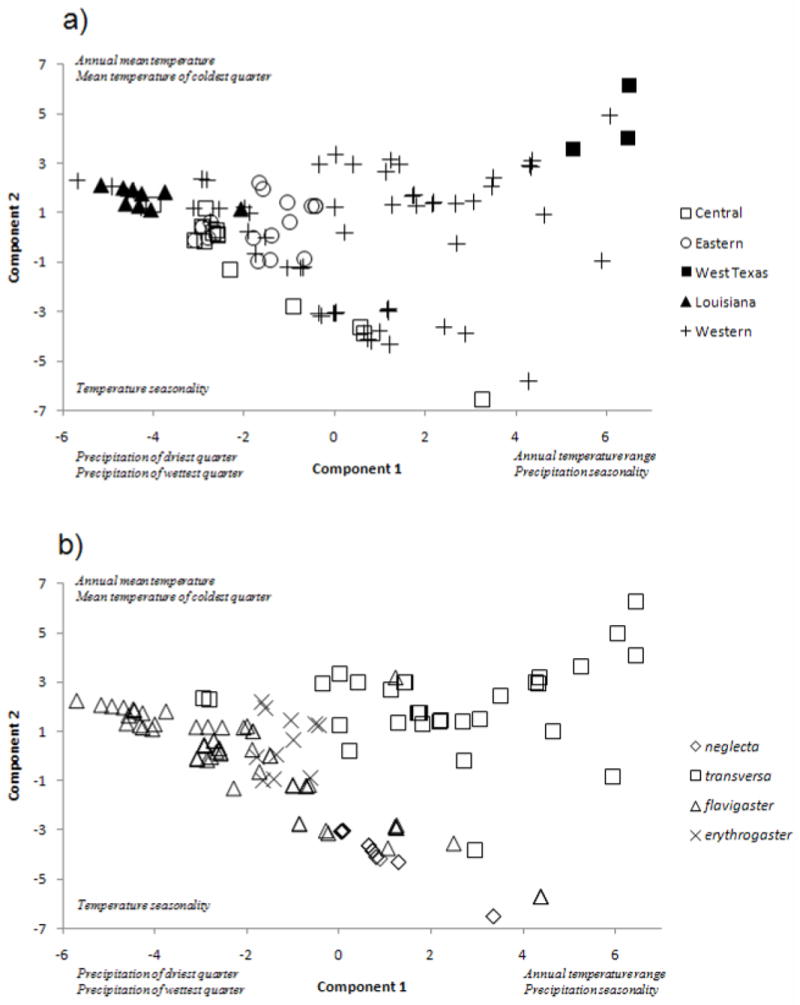
Scatterplot of first two principal components from the bioclimatic data with grouping based on a) major lineage and b) taxonomy.
Figure 6.
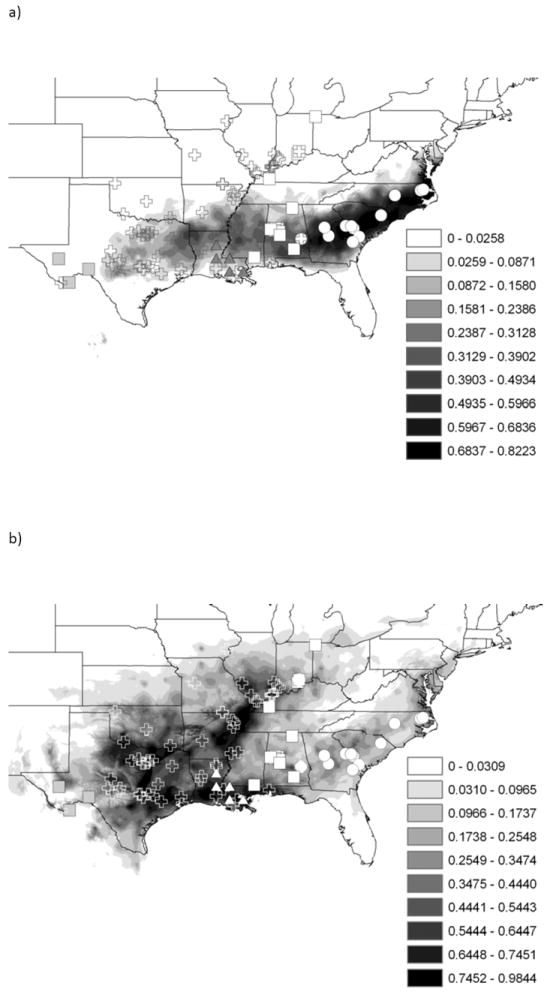
Ecological niche models for the a) Eastern lineage and b) non-eastern lineage using 19 WorldClim data layers. Locality points are detailed with major lineage identification symbols, defined in Fig. 2.
Discussion
Subspecies traditionally have been classified based on meristic and mensural morphological characters (Wilson and Brown, 1953), together with geographic distribution. While such variation across a species is certainly of interest (e.g., it may reflect local adaptation, phenotypic plasticity, genotype by environment interactions, etc), it can be misleading with respect to evolutionary relationships (e.g., Mulcahy, 2008; Pyron and Burbrink, 2009b). We reconstructed the evolutionary history of Nerodia erythrogaster using mtDNA, tested whether genetic variation is concordant with the current taxonomy and/or potential biogeographic barriers, and determined whether ecological niche differentiation exists across the geographic range. Our results indicate that N. erythrogaster comprises five major mt lineages, all of which are partially to almost completely sympatric with at least one other lineage. All a priori hypotheses, both taxonomic and biogeographic, were strongly disfavored when compared to the molecular-based tree. Putative subspecies were not only polyphyletic, but they also showed little genetic divergence from one another. Finally, we found that the major mt lineages identified showed minimal ecological differentiation.
To recover the phylogenetic/phylogeographic history of the species, we used partial sequences from three mitochondrial genes. Given that these genes are linked, it would have been desirable to include nuclear genes (Zink and Barrowclough, 2008); however, C-mos showed extremely low levels of variation. However, we are investigating use of other nuclear data (e.g., AFLPs and microsatellites) for tests of hypotheses regarding gene flow. Because analyses of individual mt genes yielded very similar trees, we combined the mt genes in a total evidence analysis. We identified five mt lineages, each with significant support (Fig. 2) and overlapping ranges (Fig. 3). Only one major lineage, the “Eastern,” was largely concordant with any of the a priori biogeographic or taxonomic hypotheses, but Bayes factors strongly supported the unconstrained phylogenetic tree compared to the a priori hypotheses. Bayes factors provide a useful alternative to the classic null hypothesis test (Shimodaira-Hasegawa[S-H], Swofford-Olsen-Waddell-Hillis [SOWH], etc) where instead of testing a null, support for differing, meaningful hypotheses is calculated directly (Kass and Raftery, 1995). This allowed us to compare five a priori hypotheses directly to the tree recovered. The PCoA of the total evidence mt dataset with taxonomic grouping identified three separate groups (Fig. 4), two of which are made up of at least three of the four subspecies. It is important to note that in our phylogenetically-based tests of the validity of the subspecies, the constraints were based on previous delimitation of the ranges of the subspecies. Thus, it is possible that geographically overlapping haplotype groups could reflect zones of contact between distinct organismal lineages, inherently causing rejection of the hypothesis that independent lineages exist. This seems very unlikely for most of the recognized subspecies given the extensive geographic overlap among haplotype groups, even in microsympatry (Fig. 3). However, we detected only “Eastern” haplotypes from the entire region east of the Apalachicola River. This situation warrants further investigation (especially increased sampling across Mississippi, Alabama, and Georgia) and it would be preliminary to assume continuous gene flow between the (geographically) eastern and central/western populations.
Discriminant analyses performed adequately at predicting subspecies during cross validation overall, signifying a limited amount of genetic partitioning among subspecies. Furthermore, the highest levels of accuracy in assignment correspond to populations at the western and eastern ends of the range, consistent with separation of haplotypes (perhaps due to climatic history; see below), followed by re-establishment of gene flow and consequent overlap in geographically intermediate regions. Marshall et al. (2009), who focused on microsatellite variation in N. e. neglecta, found moderate differentiation among the regions sampled and surmised that the differentiation among populations is due to the quality of terrestrial dispersal corridors. However, no assessments of broad-scale genetic structure have been conducted using nuclear genes, although we have initiated such work.
We tested for ecological differentiation among major mt lineages using environmental information. Although there were statistically significant differences among groups defined both mitochondrially and based on subspecies designation, due to the large degree of over-prediction, there was no clear indication that any of the groups were in unique environmental niche space (Fig. 5). We also tested for ecological differentiation of specimens assigned to subspecies based on locality. Due to the lack of congruence between mt lineages and taxonomy (subspecies) based on geography (which is supposed to be based on phenotype, see below for discussion), if such differences were recovered, this could provide support for the phenotypic differences being attributable to environmental factors. We followed the boundaries defined by Gibbons and Dorcas (2004) while assigning all representative specimens from Alabama to N. e. flavigaster (all other assignments were unambiguous based on recognized geographic ranges of the subspecies). The results were very similar to those of the analysis where groups were defined by major mt lineages as opposed to subspecies; statistically significant differentiation with a large amount of over-prediction (i.e. areas of high-probability prediction outside of the naturally occurring range) of all lineages (Fig. 5). Because the taxon occurs across such a large range encompassing diverse ecological conditions, there are many ecological variables that could be important for which we or could not include (e.g., diet, water pH, salinity, soil composition, etc), and therefore ecological differentiation remains possible. However, neither the major mt lineages nor the subspecies (Fig. 5) appear to be uniquely associated with variation in the environmental factors considered in this study, whereas such associations are common in other reptiles and amphibians (Graham et al., 2004; Raxworthy et al., 2007; Wiens et al., 2006)
The apparent lack of geographically separated lineages across such a wide-ranging species is surprising, even given the caveats regarding status of the easternmost populations. Studies of many diverse taxa in North America have revealed strongly supported geographically distinct lineages (Griffin and Barrett, 2004; Heilveil and Berlocher, 2006; Joly and Bruneau, 2004; Roe et al., 2001). This is not always the case, though. Examples of wide ranging North American species with low genetic differentiation include the diamondback watersnake Nerodia rhombifer (Matthew Brandley, pers. com.), the eastern narrow-mouthed toad Gastrophryne carolinensis (Makowsky et al., 2009), Blanchard’s cricket frog Acris blanchardi (Gamble et al., 2008), the snapping turtle Chelydra serpentina (Walker et al., 1998), and many boreal mammals (Arbogast and Kenagy, 2001). Nerodia is a relatively young genus, with most fossils placed in the Pleistocene and Pliocene, and the oldest fossil approximately 13 million years old (see Gibbons and Dorcas, 2004; and references within). Phylogenetic studies of North American natricines suggest rapid diversification and speciation following the origin of the group; thus, the age of N. erythrogaster presumably is close to the age of the genus (Alfaro and Arnold, 2001; Lawson, 1987), although rigorous analyses of divergence times have not been conducted. Climate shifts since the speciation of N. erythrogaster, especially the most recent glacial maximum, likely have caused alternating periods of isolation and admixture (Fontanella et al., 2008), possibly leading to the overlap in mt lineages and ecological over-prediction we observed.
While many criteria for species delimitation exist, we looked for reciprocal monophyly as well as ecological differentiation of geographically isolated lineages to satisfy the concordance principles for species recognition (Avise and Ball, 1990). Wiens and Penkrot (2002) designed a “decision key” with respect to identification of species in morphologically variable groups for which molecular-based estimates of relationships are available. Bond and Stockman (Bond and Stockman, 2008; see also references within) proposed a related method that emphasizes adaptive divergence among molecular-based lineages as a test of species status, essentially applying the cohesion species criterion of Templeton (1989; 2001). Although we did identify well-supported mt lineages, most were widespread or at least overlapped geographically with others. While this could reflect incomplete lineage sorting, other evidence from morphology and niche modeling also suggests that there are no clear-cut breaks with respect to coloration/pattern, habitat use, or environmental tolerance.
Based on the above, we find little support for splitting N. erythrogaster into multiple species under almost any species concept, although further investigation of the distinctiveness of the Eastern mt lineage (which includes the type locality) is warranted. In addition, based on Wilson and Brown’s (1953) definition, none of the subspecies is valid as either a conceptual or practical entity unless we accept the possibility of multiple very broad zones of intergradations (see below). This conclusion might be interpreted as refutation of the basis for federal protection of the northern populations of the currently recognized subspecies N e. erythrogaster. However, protection of these populations is based on geographic isolation and vulnerability, and not necessarily genetic distinctiveness (Pruitt and Szymanski, 1997).
The Eastern mt lineage has the strongest phylogenetic support, and this may provide the basis for further research on speciation mechanisms. For example, what are the properties of the zone in which specimens with both red and yellow ventral coloration occur? We found a mixture of red, yellow, orange, and specimens exhibiting red anterior with yellow posterior ventral coloration for over 300 km west of the edge of the proposed contact zone between N. e. erythrogaster and N. e. flavigaster. This corresponds with Conant’s (1949) observations; he interpreted this as evidence for intergradation between N. e. erythrogaster and N. e. flavigaster. Based on the overlap of haplotypes observed geographically (Fig. 3), such intergradations must exist across a substantial proportion of the taxons range. We also found individuals with orange venters in South Carolina, although most members of the Eastern mt lineage located east of the Apalachicola River, for which we could determine coloration, displayed the (putatively) characteristic red pigmentation. Unfortunately, many tissues were from preserved specimens (in which pigmentation was faded), and we were unable to rigorously quantify ventral coloration. However, based on the many live individuals for which we could assess coloration by eye, there is no obvious relationship between red vs. yellow venter and mt haplotype in the zone from roughly the Apalachicola River to the Alabama/Mississippi border. Otherwise, we found no evidence of partially sympatric mt lineages exhibiting distinct color patterns. The quantification of gene flow across such areas would allow insight into the evolution of a starkly contrasting trait that is as yet unexplained. Further studies that incorporate precise color pigment measurement, nuclear markers and explicitly test whether color traits are environmentally controlled should help clarify whether the Eastern mt lineage represents a distinct species as well as elucidate why ventral coloration is so variable in the putative intergradation zone.
We investigated the evolutionary history of N. erythrogaster by using mtDNA to test whether genetic structure is concordant with the current subspecies taxonomy and/or potential biogeographic barriers. In addition, we used environmental niche modeling to assess whether there exists ecological differentiation among geographically defined subspecies and/or mt lineages. Using this combination of molecular and environmental evidence, we conclude that most of the recognized subspecies are part of a freely interbreeding, widespread species, with the possible exception of a split between the Eastern group and all others.
Supplementary Material
Table 2.
Discriminant function analysis results using mitochondrial sequence characters with geographically defined subspecies as the grouping factor. Overall, 83 (53.2 %) specimens were grouped correctly.
| True Subspecies | ||||
|---|---|---|---|---|
| Put into subspecies | erythrogaster | flavigaster | neglecta | transversa |
| erythrogaster | 17 | 11 | 0 | 0 |
| flavigaster | 0 | 23 | 2 | 1 |
| neglecta | 0 | 3 | 5 | 7 |
| transversa | 0 | 35 | 12 | 40 |
| Total # | 17 | 72 | 21 | 46 |
| # correct | 17 | 23 | 5 | 38 |
| Proportion | 1.00 | 0.319 | 0.263 | 0.869 |
Table 3.
Discriminant function analysis results using environmental data with recovered clades as the grouping factor. Overall, 103 (66.0 %) specimens were grouped correctly.
| True Group | |||||
|---|---|---|---|---|---|
| Put into clade | Central | Eastern | Louisiana | West Texas | Western |
| Central | 19 | 12 | 1 | 0 | 11 |
| Eastern | 2 | 11 | 3 | 0 | 0 |
| Louisiana | 0 | 0 | 0 | 6 | 9 |
| West Texas | 0 | 0 | 0 | 6 | 9 |
| Western | 2 | 0 | 0 | 1 | 62 |
| Total # | 23 | 27 | 9 | 7 | 90 |
| # correct | 19 | 11 | 5 | 6 | 62 |
| Proportion | 0.826 | 0.407 | 0.556 | 0.857 | 0.689 |
Table 4.
Discriminant function analysis results using environmental data with geographically defined subspecies as the grouping factor. Overall, 122 (78.2 %) specimens were grouped correctly.
| True Subspecies | ||||
|---|---|---|---|---|
| Put into subspecies | erythrogaster | flavigaster | neglecta | transversa |
| erythrogaster | 14 | 10 | 0 | 3 |
| flavigaster | 3 | 47 | 0 | 0 |
| neglecta | 0 | 14 | 21 | 3 |
| transversa | 0 | 1 | 0 | 40 |
| Total # | 17 | 72 | 21 | 46 |
| # correct | 14 | 47 | 21 | 40 |
| Proportion | 0.824 | 0.653 | 1.00 | 0.869 |
Acknowledgments
For field and lab help, we would like to thank C. Makowsky, the late W. Holznagel, B. Kingsbury and IPFW, S. Trauth and his students, M. Sandel, J. Bagley, J. Wooten, P. Moler, M. Brandley, C. Cox, M. Welker, Corey Roelke, Al. Braswell, M. Nordgren, C. Franklin, M. Watson, S. Boback, W. Gibbons and his students. The Museum of Vertebrate Zoology at Berkeley, the North Carolina State Museum, the University of Kansas Natural History Museum, and the Louisiana Museum of Natural History at Louisiana State University all provided invaluable specimens. Funding was graciously provided by the Birmingham Audubon Society (RM), the Beta Phi Chapter of Phi Sigma at UTA (RM), the National Science Foundation DEB-0414033 (LJR), and The University of Alabama (LJR). Specimens were collected from the wild under IACUC permit #06-281-1.
References
- Alfaro ME, Arnold SJ. Molecular systematics and evolution of Regina and the thamnophiine snakes. Mol Phylogen Evol. 2001;21:408–423. doi: 10.1006/mpev.2001.1024. [DOI] [PubMed] [Google Scholar]
- Arbogast BS, Kenagy GJ. Comparative phylogeography as an integrative approach to historical biogeography. J Biogeogr. 2001;28:819–825. [Google Scholar]
- Avise JC, Ball RM. Principles of genealogical concordance in species concepts and biological taxonomy. Oxford University Press; Oxford: 1990. [Google Scholar]
- Bond JE, Stockman AK. An Integrative Method for Delimiting Cohesion Species: Finding the Population-Species Interface in a Group of Californian Trapdoor Spiders with Extreme Genetic Divergence and Geographic Structuring. Syst Biol. 2008;57:628–646. doi: 10.1080/10635150802302443. [DOI] [PubMed] [Google Scholar]
- Bonett RM, Chippindale PT. Speciation, phylogeography, and evolution of life history and morphology in plethodontid salamanders of the Eurycea multiplicata complex. Mol Ecol. 2004;13:1189–1203. doi: 10.1111/j.1365-294X.2004.02130.x. [DOI] [PubMed] [Google Scholar]
- Brandley M, Schmitz A, Reeder T. Partitioned Bayesian analyses, partition choice, and the phylogenetic relationships of scincid lizards. Syst Biol. 2005;54:373–390. doi: 10.1080/10635150590946808. [DOI] [PubMed] [Google Scholar]
- Burbrink F. Systematics of the eastern ratsnake complex (Elaphe obsoleta) Herpetol Monogr. 2001;15:1–53. [Google Scholar]
- Burbrink FT. Phylogeographic analysis of the cornsnake (Elaphe guttata) complex inferred from maximum likelihood and Bayesian analyses. Mol Phylogen Evol. 2002;25:465–476. doi: 10.1016/s1055-7903(02)00306-8. [DOI] [PubMed] [Google Scholar]
- Burbrink FT, Fontanella F, Alexander Pyron R, Guiher TJ, Jimenez C. Phylogeography across a continent: The evolutionary and demographic history of the North American racer (Serpentes: Colubridae: Coluber constrictor) Mol Phylogen Evol. 2008;47:274–288. doi: 10.1016/j.ympev.2007.10.020. [DOI] [PubMed] [Google Scholar]
- Burbrink FT, Lawson R, Slowinski JB. Mitochondrial DNA phylogeography of the polytypic North American rat snake (Elaphe obsoleta): A critique of the subspecies concept. Evolution. 2000;54:2107–2118. doi: 10.1554/0014-3820(2000)054[2107:MDPOTP]2.0.CO;2. [DOI] [PubMed] [Google Scholar]
- Casgrain P, Legendre P. The R Package for multivariate and spatial analysis version 4.0d5 – User’s manual. Département de sciences biologiques, Université de Montreal; Montreal: 2001. URL: http://www.fas.umontreal.ca/BIOL/legendre/ [Google Scholar]
- Chenna R, Sugawara H, Koike T, Lopez R, Gibson TJ, Higgins DG, Thompson JD. Multiple sequence alignment with the Clustal series of programs. Nucleic Acids Res. 2003;31:3297–2500. doi: 10.1093/nar/gkg500. [DOI] [PMC free article] [PubMed] [Google Scholar]
- Conant R. Two new races of Natrix erythrogaster. Copeia. 1949;1:1–15. [Google Scholar]
- Coykendall AL. Proposal to elevate the subspeces of Streptococcus mutans to species status, based on their molecular composition. Int J Syst Bacteriol. 1977;27:26–30. [Google Scholar]
- Doukakis P, Birstein VJ, Ruban GI, DeSalle R. Molecular genetic analysis among subspecies of two Eurasian sturgeon species, Acipenser baerii and A. stellatus. Mol Ecol. 1999;8:S117–S127. doi: 10.1046/j.1365-294x.1999.00816.x. [DOI] [PubMed] [Google Scholar]
- Fontanella FM, Feldman CR, Siddall ME, Burbrink FT. Phylogeography of Diadophis punctatus: Extensive lineage diversity and repeated patterns of historical demography in a trans-continental snake. Mol Phylogen Evol. 2008;46:1049–1070. doi: 10.1016/j.ympev.2007.10.017. [DOI] [PubMed] [Google Scholar]
- Forster JR. In Bossu. Trvels through that part of North America formerly called Louisiana. 1771;1:364. [Google Scholar]
- Frost DR, Hillis DM. Species in concept and practice: herpetological applications. Herpetologica. 1990;46:87–104. [Google Scholar]
- Frost DR, Kluge AG, Hillis DH. Species in contemporary herpetology: Comments on phylogenetic inference and taxonomy. Herpetological Review. 1992;23:46–54. [Google Scholar]
- Gamble T, Berendzen PB, Bradley Shaffer H, Starkey DE, Simons AM. Species limits and phylogeography of North American cricket frogs (Acris: Hylidae) Mol Phylogen Evol. 2008;48:112–125. doi: 10.1016/j.ympev.2008.03.015. [DOI] [PubMed] [Google Scholar]
- Gibbons J, Dorcas M. North American Watersnakes: A Natural History. Oklahoma Press; Norman: 2004. [Google Scholar]
- Goloboff PA, Farris JS, Nixon KC. TNT, a free program for phylogenetic analysis. Cladistics. 2008;24:774–786. [Google Scholar]
- Graham C, Ron S, Santos J, Schneider C, Moritz C. Integrating phylogenetics and environmental niche models to explore speciation mechanisms in dendrobatid frogs. Evolution. 2004;58:1781–1793. doi: 10.1111/j.0014-3820.2004.tb00461.x. [DOI] [PubMed] [Google Scholar]
- Griffin SR, Barrett SCH. Post-glacial history of Trillium grandiflorum (Melanthiaceae) in eastern North America: Inferences from phylogeography. Am J Bot. 2004;91:465–473. doi: 10.3732/ajb.91.3.465. [DOI] [PubMed] [Google Scholar]
- Guiher TJ, Burbrink FT. Demographic and phylogeographic histories of two venomous North American snakes of the genus Agkistrodon. Mol Phylogen Evol. 2008;48:543–553. doi: 10.1016/j.ympev.2008.04.008. [DOI] [PubMed] [Google Scholar]
- Haig SM, Beever EA, Chambers SM, Draheim HM, Dugger BD, Dunham S, Elliott-Smith E, Fontaine JB, Kesler DC, Knaus BJ, Lopes IF, Loschl P, Mullins TD, Sheffield LM. Taxonomic considerations in listing subspecies under the U.S. Endangered Species Act. Conserv Biol. 2006;20:1584–1594. doi: 10.1111/j.1523-1739.2006.00530.x. [DOI] [PubMed] [Google Scholar]
- Hair JF, Anderson RE, Tatham RL, Black WC. Multivariate Data Analysis. Prentice-Hall; Saddle River, NJ: 1998. [Google Scholar]
- Heilveil JS, Berlocher SH. Phylogeography of the postglacial range expansion in Nigronia serricornis Say (Megaloptera: Coryldalidae) Mol Ecol. 2006;15:1627–1641. doi: 10.1111/j.1365-294X.2006.02876.x. [DOI] [PubMed] [Google Scholar]
- Hillis DM, Wiens JJ. Molecular versus morphological systematics: Conflicts, atrifacts, and misconceptions. In: Wiens JJ, editor. Phylogenetic analysis of morphological data. Smithsonian Institution Press; Washington, D.C: 2000. [Google Scholar]
- Huberty CJ, Olejnik S. Applied MANOVA and Discriminant Analysis. John Wiley & Sons; Hoboken, New Jersey: 2006. [Google Scholar]
- Huelsenbeck J, Ronquist F. MRBAYES: Bayesian inference of phylogeny. Bioinformatics. 2001;17:754–755. doi: 10.1093/bioinformatics/17.8.754. [DOI] [PubMed] [Google Scholar]
- Joly S, Bruneau A. Evolution of triploidy in Apios americana (Leguminosae) revealed be geneological analysis of the histone H3-D gene. Evolution. 2004;58:284–295. [PubMed] [Google Scholar]
- Kass RE, Raftery AE. Bayes Factors. J Am Stat Assoc. 1995;90:773–795. [Google Scholar]
- Larkin MA, Blackshields G, Brown NP, Chenna R, McGettigan PA, McWilliam H, Valentin F, Wallace IM, Wilm A, Lopez R, Thompson JD, Gibson TJ, Higgins DG. Clustal W and Clustal X version 2.0. Bioinformatics. 2007;23:2947–2948. doi: 10.1093/bioinformatics/btm404. [DOI] [PubMed] [Google Scholar]
- Lawson R. Molecular studies of thamnophiine snakes: 1. The phylogeny of the genus Nerodia. J Herpetol. 1987;21:140–157. [Google Scholar]
- Maijer S. Distinctive song of highland form maculicollis of the red-winged tinamou (Rhynchotus rufescens): evidence for species rank 1996 [Google Scholar]
- Makowsky R, Chesser J, Rissler L. A striking lack of genetic diversity across the wide-ranging amphibian Gastrophryne carolinensis (Anura: Microhylidae) Genetica. 2009;135:169–183. doi: 10.1007/s10709-008-9267-5. [DOI] [PubMed] [Google Scholar]
- Marshall JC, Kingsbury BA, Minchella DJ. Microsatellite variation, population structure, and bottlenecks in the threatened copperbelly water snake. Conserv Genet. 2009;10:465–476. [Google Scholar]
- Mulcahy DG. Phylogeography and species boundaries of the western North American Nightsnake (Hypsiglena torquata): Revisiting the subspecies concept. Mol Phylogen Evol. 2008;46:1095–1115. doi: 10.1016/j.ympev.2007.12.012. [DOI] [PubMed] [Google Scholar]
- Nylander J. MrModeltest (Program distributed by the author) Evolutionary Biology Centre, Uppsala University; 2004. [Google Scholar]
- Nylander JA, Ronquist F, Huelsenbeck JP, Nieves-Aldrey JL. Bayesian phylogenetic analysis of combined data. Syst Biol. 2004;53:47–67. doi: 10.1080/10635150490264699. [DOI] [PubMed] [Google Scholar]
- Nylander JA, Wilgenbusch JC, Warren DL, Swofford DL. AWTY (are we there yet?): a system for graphical exploration of MCMC convergence in Bayesian phylogenetics. Bioinformatics. 2008;24:581–583. doi: 10.1093/bioinformatics/btm388. [DOI] [PubMed] [Google Scholar]
- Palero F, Crandall KA, Abelló P, Macpherson E, Pascual M. Phylogenetic relationships between spiny, slipper and coral lobsters (Crustacea, Decapoda, Achelata) Mol Phylogen Evol. 2009;50:152–162. doi: 10.1016/j.ympev.2008.10.003. [DOI] [PubMed] [Google Scholar]
- Parra J, Graham C, Freile J. Evaluating alternative data sets for ecological niche models of birds in the Andes. Ecography. 2004;27:350–360. [Google Scholar]
- Phillips SJ, Anderson RP, Schapire RE. Maximum entropy modeling of species geographic distribution. Ecol Model. 2006;190 [Google Scholar]
- Posada D, Crandall K. Modeltest: Testing the model of DNA substitution. Bioinformatics. 1998;14:817–818. doi: 10.1093/bioinformatics/14.9.817. [DOI] [PubMed] [Google Scholar]
- Pruitt S, Szymanski J. Endangered and threatened wildlife and plants; determination of threatened status for the northern population of the coperbelly watersnake. Fed Regist. 1997;62:4183–4193. [Google Scholar]
- Pyron RA, Burbrink FT. Lineage diversification in a widespread species: roles for niche divergence and conservatism in the common kingsnake, Lampropeltis getula. Mol Ecol. 2009a;18:3443–3457. doi: 10.1111/j.1365-294X.2009.04292.x. [DOI] [PubMed] [Google Scholar]
- Pyron RA, Burbrink FT. Systematics of the Common Kingsnake (Lampropeltis getula; Serpentes: Colubridae) and the burden of heritage in taxonomy. Zootaxa. 2009b;2241:22–32. [Google Scholar]
- Raxworthy C, Ingram C, Rabibisoa N, Pearson R. Applications of Ecological Niche Modeling for species delimitation: A review and empirical evaluation using day geckos (Phelsuma) from madagascar. Syst Biol. 2007;56:907–923. doi: 10.1080/10635150701775111. [DOI] [PubMed] [Google Scholar]
- Rissler LJ, Apodaca JJ. Ecological niche models and phylogeography. Syst Biol. 2007;56:924–942. doi: 10.1080/10635150701703063. [DOI] [PubMed] [Google Scholar]
- Roe KJ, Hatfield PD, Lydeard C. Phylogeographic analysis of the threatened and endangered superconglutinate-producing mussels of the genus Lampsilis (Bivalva: Unionidae) Mol Ecol. 2001;10:2225–2234. doi: 10.1046/j.1365-294x.2001.01361.x. [DOI] [PubMed] [Google Scholar]
- Ronquist F, Huelsenbeck J. MRBAYES 3: Bayesian phylogenetic inference under mixed models. Bioinformatics. 2003;19:1572–1574. doi: 10.1093/bioinformatics/btg180. [DOI] [PubMed] [Google Scholar]
- Smith HM, Chiszar D, Montanucci RR. Subspecies and classification. Herpetological Review. 1997;28:13–16. [Google Scholar]
- Soltis DE, Morris AB, McLachlan JS, Manos PS, Soltis PS. Comparative phylogeography of unglaciated eastern North America. Mol Ecol. 2006;15:4261–4293. doi: 10.1111/j.1365-294X.2006.03061.x. [DOI] [PubMed] [Google Scholar]
- Swenson N, Howard D. Clustering of contact zones, hybrid zones, and phylogeographic breaks in North America. Am Nat. 2005;166:581–591. doi: 10.1086/491688. [DOI] [PubMed] [Google Scholar]
- Swofford D. PAUP*: Phylogenetic analyses using parsimony (* and other methods) Sinauer Associates; Sunderland: 1999. [Google Scholar]
- Templeton AR. The meaning of species and speciation: a genetic perspective. In: Otte D, Endler JA, editors. Speciation and its Consequences. Sinauer Associates; Sunderland, MA: 1989. [Google Scholar]
- Templeton AR. Using phylogeographic analyses of gene trees to test species status and processes. Mol Ecol. 2001;10:779–791. doi: 10.1046/j.1365-294x.2001.01199.x. [DOI] [PubMed] [Google Scholar]
- Titus TA, Larson A. Molecular phylogenetics of desmognathine salamanders (Caudata: Plethodontidae): A reevlauation of evolution in ecology, life history, and morphology. Syst Biol. 1996;45:451–472. [Google Scholar]
- Walker D, Moler PE, Buhlmann KA, Avise JC. Phylogeographic uniformity in mitochondrial DNA of the snapping turtle (Chelydra serpentina) Anim Conserv. 1998;1:55–60. [Google Scholar]
- Watts RA, Palmer CA, Feldhoff RC, Feldhoff PW, Houck LD, Jones AG, Pfrender ME, Rollmann SM, Arnold SJ. Stabilizing selection on behavior and morphology masks positive selection on the signal in a salamander pheromone signaling complex. Mol Biol Evol. 2004;21:1032–1041. doi: 10.1093/molbev/msh093. [DOI] [PubMed] [Google Scholar]
- Wiens J, Penkrot T. Delimiting species using DNA and morphology variation and discordant species limits in spiny lizards (Sceloporus) Syst Biol. 2002;5:69–91. doi: 10.1080/106351502753475880. [DOI] [PubMed] [Google Scholar]
- Wiens JJ, Chippindale PT, Hillis DM. When are phylogenetic analyses misled by convergence? A case study in Texas Cave Salamanders. Syst Biol. 2003;52:501–514. doi: 10.1080/10635150390218222. [DOI] [PubMed] [Google Scholar]
- Wiens JJ, Graham CH, Moen DS, Smith SA, Reeder TW. Evolutionary and Ecological Causes of the Latitudinal Diversity Gradient in Hylid Frogs: Treefrog Trees Unearth the Roots of High Tropical Diversity. Am Nat. 2006;168:579–596. doi: 10.1086/507882. [DOI] [PubMed] [Google Scholar]
- Wiley E. The evolutionary species concept reconsidered. Systematic Zoology. 1978;27:17–26. [Google Scholar]
- Wiley E. Phylogenetics: The theory and practices of phylogenetic systematics. John Wiley and Sons; New York: 1981. [Google Scholar]
- Wilson EO, Brown WL. The subspecies concept and its taxonomic application. Systematic Zoology. 1953;2:97–111. [Google Scholar]
- Zink RM. The role of subspecies in obscuring avian biological diversity and misleading conservation policy. Proceedings of the Royal Society B: Biological Sciences. 2004 doi: 10.1098/rspb.2003.2617. [DOI] [PMC free article] [PubMed] [Google Scholar]
- Zink RM, Barrowclough GF. Mitochondrial DNA under siege in avian phylogeography. Mol Ecol. 2008;17:2107–2121. doi: 10.1111/j.1365-294X.2008.03737.x. [DOI] [PubMed] [Google Scholar]
- Zwickl DJ. Biological Sciences. University of Texas; Austin: 2006. Genetic algorithm approaches for the phylogenetic analysis of large biological sequence datasets under the maximum likelihood criterion. [Google Scholar]
Associated Data
This section collects any data citations, data availability statements, or supplementary materials included in this article.