Abstract
While the build-up of oxidized proteins within cells is believed to be toxic, there is currently no evidence linking protein carbonylation and cell death. In the present study, we show that incubation of nPC12 (neuron-like PC12) cells with 50 μM DEM (diethyl maleate) leads to a partial and transient depletion of glutathione (GSH). Concomitant with GSH disappearance there is increased accumulation of PCOs (protein carbonyls) and cell death (both by necrosis and apoptosis). Immunocytochemical studies also revealed a temporal/spatial relationship between carbonylation and cellular apoptosis. In addition, the extent of all three, PCO accumulation, protein aggregation and cell death, augments if oxidized proteins are not removed by proteasomal degradation. Furthermore, the effectiveness of the carbonyl scavengers hydralazine, histidine hydrazide and methoxylamine at preventing cell death identifies PCOs as the toxic species. Experiments using well-characterized apoptosis inhibitors place protein carbonylation downstream of the mitochondrial transition pore opening and upstream of caspase activation. While the study focused mostly on nPC12 cells, experiments in primary neuronal cultures yielded the same results. The findings are also not restricted to DEM-induced cell death, since a similar relationship between carbonylation and apoptosis was found in staurosporine- and buthionine sulfoximine-treated nPC12 cells. In sum, the above results show for the first time a causal relationship between carbonylation, protein aggregation and apoptosis of neurons undergoing oxidative damage. To the best of our knowledge, this is the first study to place direct (oxidative) protein carbonylation within the apoptotic pathway.
Keywords: apoptosis, cell death, glutathione depletion, proteasome, protein carbonylation, protein aggregation
Abbreviations: Ab, antibody; ACR, acrolein; AMC, 7-amino-4-methylcoumarin; BSO, buthionine sulfoximine; CNS, central nervous system; DTT, dithiothreitol; EPO, epoxomicin; DEM, diethyl maleate; DNP, 2,4-dinitrophenyl; DNPH, 2,4-dinitrophenylhydrazine; EAE, experimental autoimmune encephalomyelitis; GAP-43, growth-associated protein 43; 4-HNE, 4-hydroxynonenal; LDH, lactate dehydrogenase; mAb, monoclonal antibody; MDA, malondialdehyde; MPTP, mitochondrial permeability transition pore; NFH, neurofilament heavy chain; NGF, nerve growth factor; nPC12, neuron-like PC12; PCO, protein carbonyl; RCS, reactive carbonyl species; ROS, reactive oxygen species; TBARS, thiobarbituric acid-reactive substances; TUNEL, terminal deoxynucleotidyltransferase-mediated dUTP nick-end labelling; zVAD-fmk, benzyloxycarbonyl-Val-Ala-DL-Asp-fluoromethylketone
INTRODUCTION
Many neurological disorders are characterized by severe and/or prolonged oxidative stress conditions, which play a significant pathophysiological role (Reynolds et al., 2007; Jomova et al., 2010). The major outcome of oxidative stress is the irreversible damage of cell macromolecules by ROS (reactive oxygen species). Proteins are the major target for oxidants as a result of their abundance and their elevated reaction rate constants (Davies, 2005). Although the polypeptide backbone and the side chains of most amino acids are susceptible to oxidation, the non-enzymatic introduction of aldehyde or ketone functional groups to specific amino acid residues (also known as carbonylation) constitutes the most common oxidative alteration of proteins (Bizzozero, 2009). Accumulation of PCOs (protein carbonyls) does not only occur, but has also been implicated, in the aetiology and/or progression of several CNS (central nervous system) disorders, including Alzheimer's disease (Aksenov et al., 2001), Parkinson's disease (Floor and Wetzel, 1998), amyotrophic lateral sclerosis (Ferrante et al., 1997) and multiple sclerosis (Bizzozero et al., 2005).
Carbonylation is believed to have deleterious effects on both protein function and cell viability. However, while there is ample experimental evidence demonstrating that the presence of carbonyl groups leads to changes in protein structure and function (Fucci et al., 1983; Starke et al., 1987; Dalle-Donne et al., 2001), a direct relationship between protein carbonylation and cell death has not been conclusively established. The major problem lies in the difficulty of differentiating the effect(s) of carbonylation from that of other protein modifications that occur simultaneously under oxidativing stress conditions (e.g. oxidation of cysteine thiols and nitration of tyrosine residues). Nonetheless, a number of studies have recently surfaced suggesting a link between increased protein carbonylation and loss of cell viability. For instance, carbonylation of critical glycolytic enzymes in etopside-treated HL60 cells seems to decrease glucose utilization and cause cell death (England et al., 2004), while oxidation of several chaperones has been associated with apoptosis of irradiated HL60 human leukaemia cells (Magi et al., 2004). In addition, carbonylation may lead to the formation of large, protease-resistant protein aggregates, which are considered highly cytotoxic (Nyström, 2005; Maisonneuve et al., 2008).
Because of the potential cellular toxicity that results from the accumulation of carbonylated proteins, their intracellular levels are normally maintained at very low levels by proteolytic removal. Among the various cellular proteases, the 20S proteasome, via its chymotrypsin-like activity and in an ATP-independent manner, has been shown to be responsible for digesting oxidized proteins (Shringarpure et al., 2003; Divald and Powell, 2006). Indeed, failure of this proteolytic system, as happens in many neurodegenerative disorders, results in the build up of oxidized proteins that likely contribute to cellular dysfunction and tissue damage (Rinaudo and Piccinini, 2007).
In recent years, our laboratory has been investigating the mechanism of protein carbonylation and the metabolic/cellular impact of increased protein oxidation in inflammatory demyelinating disorders. We have found that PCOs accumulate in the CNS of patients with multiple sclerosis (Bizzozero et al., 2005) and of animals with EAE (experimental autoimmune encephalomyelitis; Smerjac and Bizzozero, 2008; Zheng and Bizzozero, 2010b). Recent immunohistochemical experiments in the spinal cord of EAE mice have demonstrated a positive correlation between carbonylation levels and neuronal/oligodendrocyte apoptosis (Dasgupta and Bizzozero, 2011). Based on these findings, we set up to investigate whether a relationship, causal or otherwise, exists between protein carbonylation and neuronal cell death in vitro. To this end, the concentration of GSH in NGF (nerve growth factor)-treated PC12 cells or primary neurons was reduced to levels similar to those found in the spinal cord of EAE animals. Under these oxidative stress conditions, immunocytochemical studies revealed for the first time a close temporal/spatial relationship between carbonylation and apoptosis. Experiments combining GSH depletion, proteasome inhibition and carbonyl scavenging demonstrated a direct link between protein damage in the form of carbonyls and loss of cell viability. To the best of our knowledge, this is the first study to place direct (oxidative) protein carbonylation within the apoptotic pathway.
MATERIAL AND METHODS
Neuronal cultures and drug treatments
Rat adrenal medullary pheochromocytoma (PC12) cells were cultured on poly-l-lysine-coated 6-well plates (BioCoat™; BD Biosciences) in RPMI 1640 media containing 10% serum (7.5% donor horse and 2.5% fetal calf serum; Sigma) and an antibiotic/antimycotic mixture (Invitrogen). Cells grown at 60–70% confluence were differentiated into a neuronal phenotype by incubation with 100 ng/ml of NGF (Sigma) for either 1 or 7 days. Primary neuronal cultures were established from cerebral cortices of C57BL/6 mice and grown for 7 days as described by Harms et al. (2010). Housing and handling of the animals as well as the euthanasia procedure were in strict accordance with the NIH Guide for the Care and Use of Laboratory Animals, and were approved by the Institutional Animal Care and Use Committee. Cells were treated with the GSH depletor DEM (diethyl maleate; Sigma) for 1–24 h. Control cells were left untreated after incubation with NGF. In some cases, DEM-treated cells were incubated with the proteasome inhibitors lactacystin (Enzo Life Sciences) and EPO (epoxomicin; Enzo Life Sciences) in the absence or presence of various compounds including trolox (Sigma), hydralazine (Sigma), methoxylamine (Sigma), z-histidine hydrazide (Peninsula Laboratories). Other drugs tested were the MPTP (mitochondrial permeability transition pore) inhibitor cyclosporin A (Calbiochem), the pan-caspase inhibitor zVAD-fmk (benzyloxycarbonyl-Val-Ala-DL-Asp-fluoromethylketone; Sigma), the apoptosis initiator staurosporine (Sigma) and the GSH depletor BSO (buthionine sulfoximine; Sigma). After incubation, cells were homogenized in PEN buffer (20 mM sodium phosphate, pH 7.5, 1 mM EDTA and 0.1 mM neocuproine) containing 2 mM 4,5-dihydroxy-1,3-benzenedisulfonic acid and 1 mM DTT (dithiothreitol). For GSH determination, cells were homogenized in PEN buffer without reducing agents and were processed immediately as described below. Protein homogenates were stored at −80°C until use. Protein concentration was assessed with the Bio-Rad DC™ protein assay (Bio-Rad Laboratories) using BSA as standard.
Determination of GSH and lipid-peroxidation products
GSH levels were determined using the enzymatic recycling method (Shaik and Mehvar, 2006). Briefly, proteins from cell homogenates were precipitated with 1% sulfosalicylic acid and removed by centrifugation at 10 000 g for 15 min. Aliquots of the supernatant were then incubated with 0.4 unit/ml glutathione reductase, 0.2 mM NADPH and 0.2 mM 5,5′-dithiobis-(2-nitrobenzoic acid) in 1 ml of 0.2 M sodium phosphate buffer, pH 7.5, containing 5 mM EDTA. The rate of appearance of the thionitrobenzoate anion was measured spectrophotometrically at 412 nm. [GSH] was calculated by interpolation on a curve constructed using increasing concentrations of GSSG (0.1–10 nmol).
Lipid peroxidation was estimated as the amount of TBARS (thiobarbituric acid-reactive substances; Ohkawa et al., 1979). Briefly, aliquots from the cell homogenates were suspended in 10% (w/v) trichloroacetic acid containing 1% (w/v) thiobarbituric and 0.05% (w/v) butylated hydroxytoluene. Samples were incubated for 20 min at 90°C. Aggregated material was removed by centrifugation at 10 000 g for 15 min and the absorbance of the supernatant was measured at 532 nm. The amount of TBARS was calculated using a standard curve prepared with 1,1,3,3-tetraethoxypropane.
Proteasome activity
The chymotrypsin-like activity of the 20S proteasome was determined in the cell homogenates using a fluorescence assay (Rodgers and Dean, 2003). Briefly, 50 μg protein was incubated for 2 h at 25°C with 50 μM AMC (7-amino-4-methylcoumarin)-labelled peptide Suc-Leu-Leu-Val-Tyr-AMC (Enzo Life Sciences) in the absence or presence of 10 μM β-clasto-lactacystin-lactone (Enzo Life Sciences). The proteasome activity was calculated as the difference in fluorescence intensity at 460 nm between the samples without and with inhibitor using λex of 380 nm.
Calpain activity
Calpain activity was also determined with a fluorescence assay using the substrate Suc-Leu-Leu-Val-Tyr-AMC. In this case, incubation was carried out in 25 mM Hepes buffer, pH 7.5, containing 100 mM KCl and 10 mM CaCl2, in the absence or presence of 10 μg of calpeptin (Hassen et al., 2006).
Western blot and oxyblot
Proteins (5 μg) were separated by SDS/PAGE on 10% gels and blotted on to PVDF membranes. Blots then were incubated overnight at 4°C with mAb (monoclonal antibody) or polyclonal Ab (antibody) against spectrin (mAb, 1:2000; Sigma), GAP-43 (growth-associated protein 43) (Ab, 1:2000, a gift from Dr Perrone-Bizzozero, Department of Neurosciences, School of Medicine, University of New Mexico, Albuquerque, NM, U.S.A.), γ-enolase (Ab, 1:2000; Sigma), active caspase 3 (mAb, 1:1000; Cell Signaling), 20S proteasome α-subunit (mAb, 1:2000; Enzo), 4-HNE (4-hydroxynonenal) (Ab, 1:1000; Abcam), MDA (malondialdehyde) (Ab, 1:1000; Abcam) and ACR (acrolein) (Ab, 1:1000; Abcam). Membranes were rinsed three times in PBS containing 0.05% Tween-20, and then incubated for 2 h with the appropriate HRP (horseradish peroxidase)-conjugated secondary Ab. Blots were developed by enhanced chemiluminescence using the Western Lightning ECL™ kit from Perkin-Elmer.
PCO groups were measured by oxyblot analysis as described earlier (Smerjac and Bizzozero, 2008). In brief, proteins (5 μg) were incubated with DNPH (2,4-dinitrophenylhydrazine) to form the DNP (2,4-dinitrophenyl) hydrazone derivatives. Proteins were separated by electrophoresis and blotted on to membranes as above. DNP-containing proteins were detected using rabbit anti-DNP antiserum (1:5000) and HRP-conjugated goat anti-rabbit IgG Ab (1:2000). Developed films were scanned in a Hewlett Packard Scanjet 4890 and the images were quantified using the NIH Image 1.63 imaging analysis program. The intensity of each lane on the film was normalized by the amount of Coomassie Blue staining in the corresponding lane.
Immunocytochemistry
Cells, cultured on 12 mm round poly-lysine coated coverslips (BD BioCoat™), were fixed with 4% (w/v) paraformaldehyde for 20 min. For carbonyl staining, fixed cells were incubated for 15 min with 1 mg/ml DNPH prepared in 1 M HCl to convert carbonyl groups into DNP-hydrazones. Cells were rinsed with PBS, blocked with 10% (v/v) normal goat serum and incubated overnight with rabbit anti-DNP Ab (1:1000; Sigma). After removing the primary Ab with 0.1% Triton X-100 in PBS, slides were incubated for 3 h with Alexa Fluor® 647 goat anti-rabbit Ab (1:100, Molecular Probes). Cells were rinsed twice with 0.1% Triton X-100 in PBS. For double immunofluorescence staining using Click-iT® TUNEL (terminal deoxynucleotidyltransferase-mediated dUTP nick-end labelling) Assay kit (Invitrogen), DNPH-treated specimens were incubated with terminal deoxynucleotidyl transferase and dNTPs conjugated to Alexa Fluor® 488 azide, rinsed twice with 0.1% Triton X-100 in PBS, once with PBS, and then mounted using DPX (di-N-butylphthalate in xylene). Images were captured with a Zeiss 200 m microscope (Carl Zeiss MicroImaging Inc.) equipped with a Hamamatsu C4742-95 digital camera (Hamamatsu Corp.). Necrotic cells were identified on the basis of morphological features such as swollen cell bodies with many holes, while apoptotic cells were identified by DNA fragmentation.
For NFH (neurofilament heavy chain) staining, fixed cells were incubated overnight with mouse anti-NFH Ab (mAb, 1:250; Sigma) followed by a 3 h incubation with Alexa Fluor® 488 rabbit anti-mouse Ab (Ab, 1:100; Molecular Probes).
Cell viability assays
For Trypan Blue exclusion assay, floating and adherent cells were diluted in PBS, stained with 0.4% Trypan Blue for 5 min, and counted in a Nebauer hemocytometer (Altman et al., 1993). Cell death was also determined by measuring LDH (lactate dehydrogenase) activity on a 10 μl aliquot from the cell supernatant using the LDH-cytotoxicity assay kit II (Abcam).
Protein aggregation assay
Assessment of protein aggregation was carried out as described by Maisonneuve et al. (2008) with minor modifications. Cell homogenates prepared in PEN buffer containing 1 mM DTT and 150 mM NaCl were centrifuged at 20 000 g for 30 min at 4°C. The pellets were then extracted with the same buffer containing 1% Triton X-100. Samples were kept on ice for 15 min and were centrifuged at 20 000 g for 30 min at 4°C. The final pellet, which contains some cytoskeleton structures but mostly aggregated proteins, was re-suspended in PEN buffer for protein determination.
Statistical analysis
Results were analysed for statistical significance with Student's t test using GraphPad Prism® program (GraphPad Software Incorporation).
RESULTS
A low dose of DEM causes partial and transient GSH depletion in neuronal cells
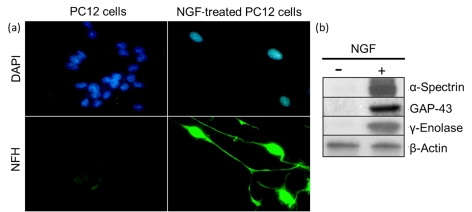
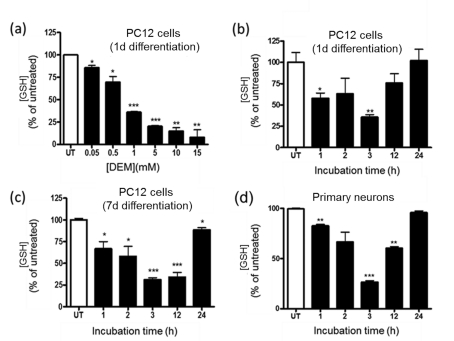
PC12 cells were differentiated into a neuronal phenotype by incubation with NGF for 24 h. These cells, which we termed nPC12 (neuron-like PC12), developed neurites that stained positive for NFH chain (Figure 1a) and expressed the neuron-specific markers α-spectrin, GAP-43 and γ-enolase (Figure 1b). Reduction of intracellular GSH levels was attained with DEM. This membrane-permeable electrophilic agent depletes intracellular GSH by directly conjugating with GSH through GST (glutathione transferase; formerly known as glutathione S-transferase; Buchmüller-Rouiller et al., 1995), leading to mitochondrial ROS production and oxidative stress (Bizzozero et al., 2006). As shown in Figure 2(a), DEM dose-dependently reduced the concentration of GSH in nPC12 cells. For this study, we chose a concentration of 50 μM DEM to achieve a reduction in GSH levels similar to that observed in the spinal cord of EAE mice (Dasgupta and Bizzozero, 2011). At 50 μM DEM, GSH levels decreased progressively, reaching the lowest values between 3 and 12 h of incubation. By 24 h, the concentration of GSH was back to normal (Figure 2b). Since the thioether linkage between GSH and DEM is metabolically stable, the recovery of GSH levels at longer incubation times is likely due to de novo synthesis of the tripeptide. Similar results were obtained in more differentiated cells such as PC12 cells treated with NGF for 7 days (Figure 2c) and primary cortical neurons (Figure 2d).
Figure 1. PC12 cells are differentiated into neuron-like cells upon treatment with NGF.
PC12 cells were incubated in the absence or presence of NGF for 24 h as described in Materials and methods section. (a) Representative immunofluorescence picture of untreated and NGF-treated cells. Nuclear [4′,6-diamidino-2-phenylindole (DAPI)] and NFH staining are shown in blue and green respectively. Note that, 12 h after NGF treatment, cells are no longer round and flat but show NFH-positive processes that are characteristic of neurons. (b) Western blots depicting the expression of the neuron-specific markers α-spectrin, GAP-43 and γ-enolase only in NGF-treated PC12 cells.
Figure 2. DEM induces GSH depletion in nPC12 cells and primary neurons.
(a) Effect of various concentrations of DEM on GSH levels in nPC12 cells at 15 min of incubation. (b–d) Time course of GSH depletion after addition of 50 μM DEM to PC12 cells differentiated for 1 or 7 days (d) with NGF and to primary neurons. Values represent the means±S.E.M of 4–9 experiments. Asterisks denote values that are significantly different from those obtained in untreated (UT) cells; *P<0.05, **P<0.01, ***P<0.001.
Protein carbonylation and GSH depletion are correlated in DEM-treated nPC12 cells
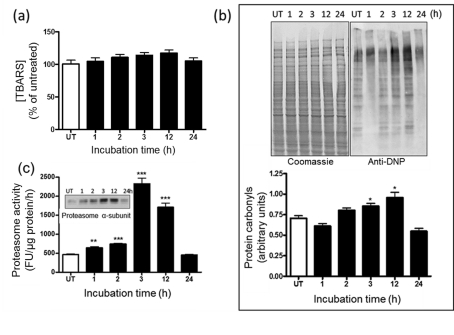
Lipid peroxidation and protein oxidation were evaluated by measuring TBARS and PCO levels respectively. As shown in Figure 3(a), TBARS levels do not change during the incubation of nPC12 cells with 50 μM DEM, although the mean values were higher at the peak of oxidative stress (3–12 h). In contrast, the amount of PCOs increased progressively from 2 to 12 h and then diminished significantly by 24 h of incubation (Figure 3b). Again, similar results were obtained in PC12 cells treated with NGF for 7 days and in primary cortical neurons (data not shown).
Figure 3. Protein carbonylation and proteasome expression in nPC12 cells increase upon GSH depletion.
(a) Levels of TBARS during the course of DEM-induced GSH depletion. (b) Representative oxyblot of total cell proteins during the course of DEM-induced GSH depletion (upper panel). Lane intensities were measured by scanning densitometry and were used to calculate protein carbonyl levels as described in the Materials and methods section (lower panel). (c) Proteasome chymotrypsin-like activity and proteasome α-subunit expression (inset) in DEM-treated nPC12 cells. Values represent the means±S.E.M. of four experiments. Asterisks denote values that are significantly different from those obtained in untreated (UT) cells; *P<0.05, **P<0.01, ***P<0.001.
PCOs are not eliminated by enzymatic reduction to the corresponding alcohols (Bizzozero, 2009). Instead, they are removed by degradation via the chymotrypsin-like activity of 20S proteasome (Ferrington et al., 2005). We found that this activity, measured with a fluorogenic peptide substrate, increases 3–4-fold at 3–12 h of incubation to decline thereafter (Figure 3c). Interestingly, the amount of 20S proteasome, as determined by the levels of the constitutive α-subunits, follows the same temporal pattern as that of proteasome activity (Figure 3c, inset). This suggests that oxidative stress causes up-regulation in proteasome expression most likely to remove the potentially toxic misfolded and oxidized proteins that build up in cells.
DEM treatment leads to apoptosis and necrosis of nPC12 cells
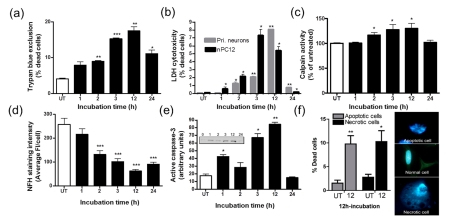
We next investigated if partial GSH depletion is toxic to nPC12 cells. As shown in Figure 4, the viability of DEM-treated nPC12 cells, as determined by the Trypan Blue exclusion test (Figure 4a) and the LDH cytotoxicity assay (Figure 4b), gradually decreases up to 12 h of incubation and by 24 h the proportion of dead cells decreases significantly. Similar temporal patterns of cell death were obtained for detached and adherent cell populations (data not shown), suggesting that dying cells do not automatically detach from the poly-lysine coated plates. Increased calpain activity, a marker of both apoptosis and necrosis (Guyton et al., 2005; Gao et al., 2007), is observed between 3 and 12 h and declines thereafter (Figure 4c). The increase in calpain activity is also evident from the reduction in the amount of NFH, one of its proteolytic targets, (Figure 4d) and from the retraction of neurites (not shown). Active caspase 3 expression, a marker of apoptosis (Namura et al., 1998), was measured by Western blotting using an Ab that detects the p17 subunit of this enzyme but not the full-length 32 kDa procaspase 3. As shown in Figure 4(e), active caspase 3 levels follow a temporal pattern identical with that of the other two cell-death markers, suggesting that apoptosis accounts for at least a fraction of the dead cells. Indeed, morphological analysis revealed that approximately half of the dead cells contain the extensive nuclear fragmentation typical of apoptotic cells (Figure 4f). There is, however, an equal amount of cells with swollen cytoplasm and intracellular vacuoles that are characteristic of necrosis.
Figure 4. Partial GSH depletion leads to apoptosis and necrosis of nPC12 cells.
Cells were incubated with 50 μM DEM for various periods of time as described in the Materials and methods section. (a) Cell death quantified using the Trypan Blue exclusion assay and (b) LDH release. (c) Temporal pattern of calpain activity, a marker of apoptosis and necrosis. (d) NFH immunostaining intensity. (e) Levels of active caspase 3 were determined by Western-blot analysis (inset). (f) Quantification of apoptotic and necrotic cell death after 12 h of DEM treatment using morphological analysis. Values represent the means±S.E.M. of four experiments. Asterisks denote values that are significantly different from those obtained in untreated (UT) cells; *P<0.05, **P<0.01, ***P<0.001.
Temporal/spatial correlation between protein carbonylation and apoptosis in GSH depleted nPC12 cells
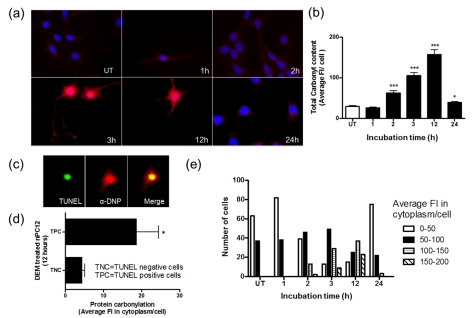
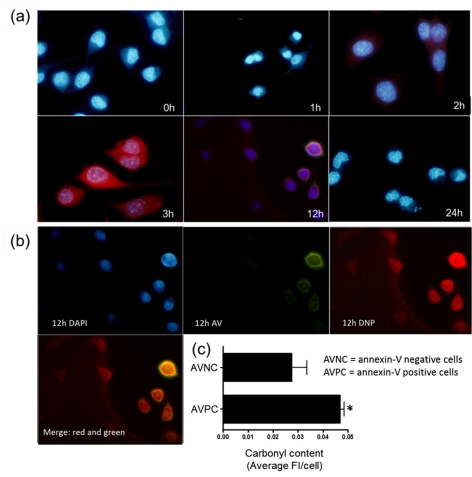
Since protein carbonylation and cell death shows a similar temporal pattern, we sought to investigate if there is a spatial relationship between these two parameters as well. To this end, DEM-treated cells were double stained with DNPH for PCOs and TUNEL or annexin V for apoptosis. Consistent with the results from oxyblot analysis (Figure 3), the average DNP staining intensity per cell reaches a maximum between 3 and 12 h after addition of DEM and declines thereafter (Figures 5a and 5b). As shown in Figure 5(c), apoptotic (TUNEL positive) cells stained intensely with DNPH. Since DNPH also stained the nuclei, likely due to its reactivity towards DNA oligonucleotides (Luo and Wehr, 2009), we quantified the fluorescence in the cytoplasm. As depicted in Figure 5(d), the fluorescence intensity in the cytoplasm of apoptotic cells is approximately four times higher than that of non-apoptotic cells. While there is a significant variation in DNP staining among the cells, it is clear that the proportion of cells with the highest cytoplasmic carbonyl content is elevated between 3 and 12 h (Figure 5e). The temporal/spatial positive relationship between apoptosis and protein oxidation was further demonstrated by extensive co-localization annexin V, a late marker of apoptosis, and DNP immunoreactivity (Figure 6).
Figure 5. Temporal and spatial correlation between carbonylation and apoptosis in DEM-treated nPC12 cells.
(a) Immunocytochemical detection of carbonyls in DEM-treated nPC12 cells at different time points. Carbonyls were detected with anti-DNP antibodies after derivatization with DNPH (red). TUNEL staining for apoptosis and 4′,6-diamidino-2-phenylindole (DAPI) staining for nuclei are shown in green and blue respectively. (b) Total carbonyl content of DEM-treated nPC12 cells determined by immunocytochemistry. Asterisks denote values that are significantly different from those obtained in untreated (UT) cells; *P<0.05, ***P<0.001. (c) Anti-DNP staining in the nucleus and cytoplasm of TUNEL positive cells. (d) PCO levels in the cytoplasm of TUNEL positive cells (TPC) and TUNEL negative cells (TNC) at 12 h of treatment with DEM. *P<0.05. (e) Average fluorescence intensity (Fl) in the cytoplasm of nPC12 cells increases between 3 and 12 h of incubation with DEM. Values represent the means±S.E.M. of 100–200 cells per experiment.
Figure 6. Annexin V-positive cells have high carbonyl content.
(a) Co-localization of carbonyls and annexin V in nPC12 cells during GSH depletion. Carbonyls were detected with anti-DNP antibodies after derivatization with DNPH (red). Annexin V staining for apoptosis and 4′,6-diamidino-2-phenylindole (DAPI) staining for nuclei are shown in green and blue respectively. (b) DAPI staining was subtracted from the picture corresponding to 12 h incubation with DEM to better show the co-localization of carbonyls and annexin V. (c) Carbonyl intensity in annexin V-positive cells (AVPC) and annexin V-negative cells (AVNC) at 12 h of treatment with DEM. Values represent the means±S.E.M. of 200 cells per experiment; *P<0.05.
Impaired removal of PCOs increases DEM-induced cell death
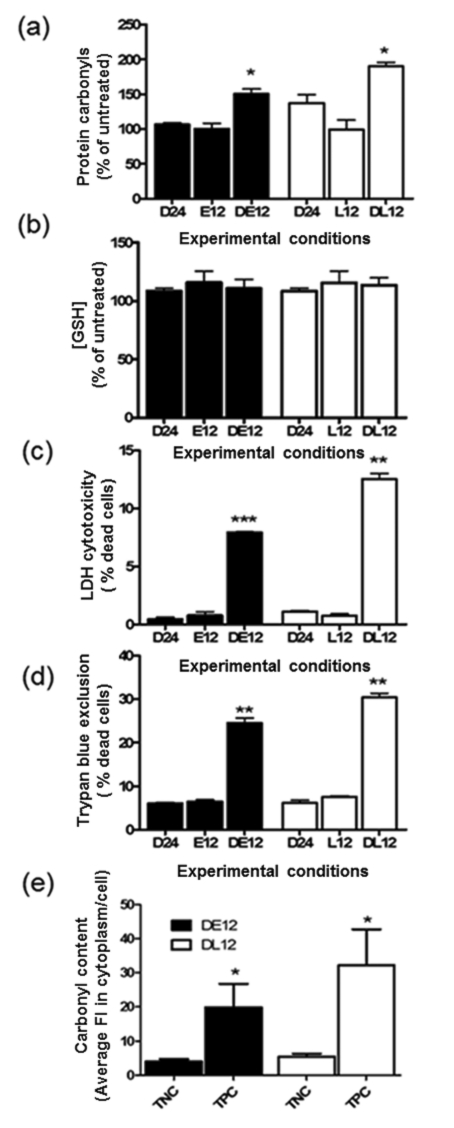
To determine whether accumulation of oxidized/misfolded proteins plays a role in cell death, we incubated DEM-treated cells with the proteasome inhibitors EPO and lactacystin. At a concentration of 1 μM, these drugs were found to reduce the chymotrypsin-like activity of the 20S proteasome by 90.6±13.7% (lactacystin) and 98.9±7.2% (EPO). Proteasome inhibitors were added to nPC12 cells 12 h after addition of DEM and incubation continued until 24 h. As depicted in Figure 7(a), cells incubated with the inhibitors have significantly higher PCO levels, indicating that in this system proteasomes are largely responsible for the degradation of most oxidized proteins. Levels of GSH in the EPO- and lactacystin-treated cells at 24 h of incubation are similar to that in untreated cells (Figure 7b). Under these conditions, we found a large increase in cell death as measured by LDH release (Figure 7c) and Trypan Blue exclusion assay (Figure 7d). A correlation between protein carbonylation and cell death was also observed by α-DNP/TUNEL double staining of proteasome inhibited DEM-treated cells (Figure 7e). These results further support our hypothesis of a strong relationship between protein damage and neuronal apoptosis. It is noteworthy that, in the absence of DEM, EPO and lactacystin do not cause cell death, suggesting that toxicity of the drug is probably due to its ability to inhibit the removal of oxidized proteins.
Figure 7. Impaired proteasomal activity augments protein carbonylation and apoptosis of DEM-treated nPC12 cells.
Cells were incubated with or without 50 μM DEM for 12 h, after which 1 μM EPO (DE12, E12) or 1 μM lactacystin (L12, DL12) was added to the medium and incubation continued for another 12 h. D24 corresponds to cells incubated with DEM for the entire 24 h period. (a) PCO levels determined by oxyblot. (b) Glutathione assayed by spectrophotometric analysis. (c, d) Cell death quantified using the Trypan Blue exclusion assay and LDH release. (e) PCO levels in the cytoplasm of TUNEL-positive cells (TPC) and TUNEL-negative cells (TNC) in DEM-treated cells incubated for 12 h with epoxomixin (DE12) or lactacystin (DL12). Values represent the means±S.E.M. of four experiments. Asterisks denote values that are significantly different from D24; *P<0.05, **P<0.01, ***P<0.001.
Carbonyl scavengers reduce cell death and protein aggregation in EPO-treated GSH-depleted cells
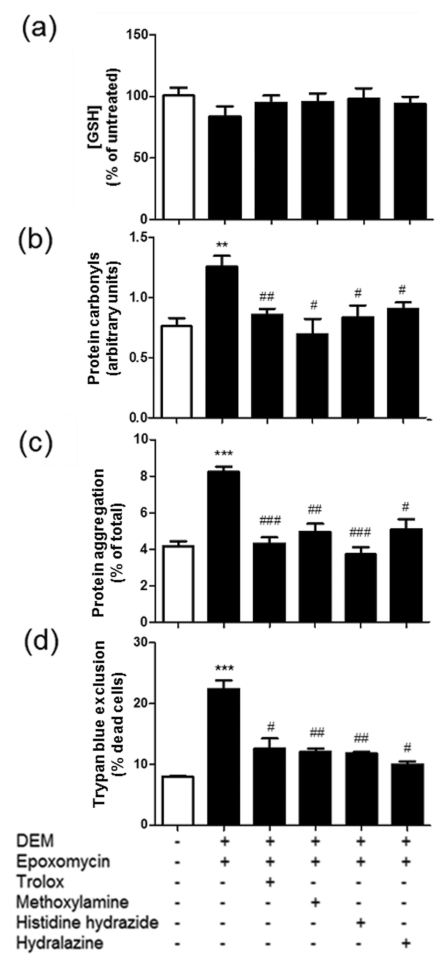
The role of protein carbonylation in cell death was further explored using the classical RCS (reactive carbonyl species) scavengers hydralazine, z-histidine hydrazide and methoxylamine. These compounds form Schiff bases with the carbonyl groups and, with the exception of hydralazine, they have no antioxidant properties (Zheng and Bizzozero, 2010a). In this series of experiments, the RCS scavengers were added together with EPO to cells that had been treated with DEM for 12 h and incubation continued for another 12 h. As shown in Figure 8, all three drugs reduced protein carbonylation, protein aggregation and cell death, indicating that (i) PCOs are indeed cytotoxic and (ii) protein aggregation is induced, directly or indirectly, by carbonylation. Preliminary Western blotting studies revealed that MDA-, ACR- and 4-HNE-protein adducts are not formed to any appreciable degree during incubation with DEM, suggesting that carbonylation takes place by direct oxidation of amino acid side chain residues rather than by attachment of RCS to the protein backbone (data not shown). The effectiveness of the vitamin E analogue trolox at preventing protein carbonylation and cell death, even when added 12 h after DEM, suggests that there is still significant oxidative stress during the recovery phase (Figure 8).
Figure 8. Addition of carbonyl scavengers to DEM/EPO-treated nPC12 cells prevents protein aggregation and cell death.
Cells were incubated with or without 50 μM DEM for 12 h, after which EPO (1 μM) along with various scavengers (500 μM) were added to the medium and incubation continued for another 12 h. (a) Glutathione levels assayed by spectrophotometric analysis. (b) PCO levels determined by oxyblot. (c) Protein aggregation measured by differential centrifugation. (d) Cell death quantified using the Trypan Blue exclusion assay. Values represent the means±S.E.M. of four experiments. Asterisks denote values that are significantly different (**P<0.01, ***P<0.001) from untreated cells. Hash symbols denote values that are significantly different (#P<0.05, ##P<0.01, ###P<0.001) from DEM/EPO-treated cells.
Differential effects of cyclosporin A and zVAD-fmk on cell death and protein carbonylation
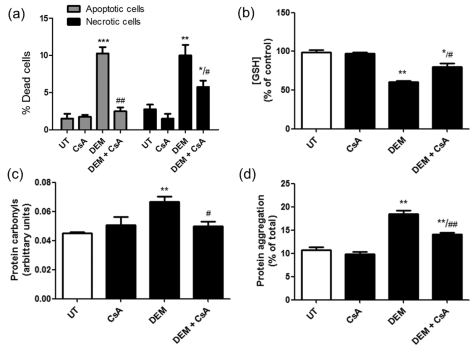
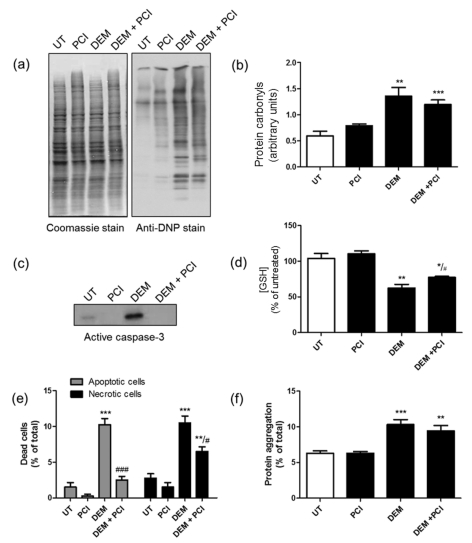
Finally, attempts were made to localize the site of protein oxidation within the apoptotic pathway. To this end, nPC12 cells were incubated with DEM and either the MPTP inhibitor cyclosporin A or the pan-caspase inhibitor zVAD-fmk. As shown in Figure 9, addition of 5 μM cyclosporin A prevents cell death, protein carbonylation and protein aggregation induced by GSH depletion. In contrast, pan-caspase inhibition reduces cell death but has no effect on protein carbonylation or aggregation (Figure 10). These findings suggest that protein oxidation/aggregation occurs after MPTP opening but before caspase activation.
Figure 9. Cyclosporin A prevents protein carbonylation, protein aggregation and cell death (both necrosis and apoptosis) induced by partial GSH depletion.
nPC12 cells were incubated for 12 h with 50 μM DEM in the absence or presence of 5 μM cyclosporin A (CsA), a classical MPTP inhibitor. (a) The proportion of necrotic and apoptotic cells determined by morphological analysis of 400 cells. (b) GSH levels measured by spectrophotometric analysis. (c) PCO levels measured by oxyblot. (d) Protein aggregation measured by differential centrifugation. Values represent the means±S.E.M. of three experiments. Asterisks denote values that are significantly different (*P<0.05, **P<0.01, ***P<0.001) from untreated cells. Hash symbols denote values that are significantly different (#P<0.05, ##P<0.01) from DEM-treated cells.
Figure 10. Pan-caspase inhibition reduces necrosis and apoptosis of nPC12 cells induced by partial GSH depletion without effecting protein carbonylation or aggregation.
nPC12 cells were incubated for 12 h with 50 μM DEM in the absence or presence of 10 μM zVAD-fmk, a classical pan-caspase inhibitor (PCI). (a) Representative oxyblot of total cell proteins. UT, untreated. Lane intensities were measured by scanning densitometry and were used to calculate PCO levels (b). (c) Western blot of total cell proteins developed with anti-caspase 3 Ab. (d) GSH levels measured by spectrophotometric analysis. (e) The proportion of necrotic and apoptotic cells determined by morphological analysis of 400 cells. (f) Protein aggregation measured by differential centrifugation. Values represent the means±S.E.M. of five experiments. Asterisks denote values that are significantly different (*P<0.05, **P<0.01 and ***P<0.001) from untreated cells. Hash symbols denote values that are significantly different (#P<0.05 and ##P<0.01) from DEM-treated cells.
DISCUSSION
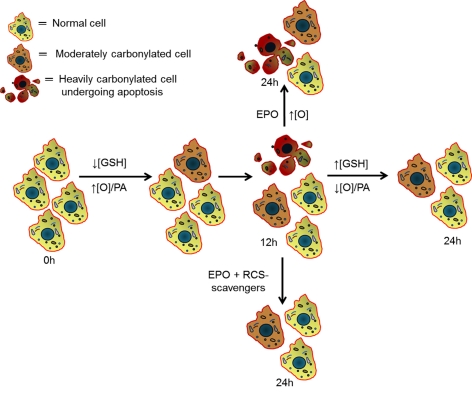
In the present study, we show that a moderate and transient depletion of GSH in nPC12 cells leads to increased accumulation of PCOs and cell death. Both the amount of PCOs and the proportion of dead cells diminish as GSH is biosynthetically replenished. However, cell death persists if oxidized proteins are not removed by the proteasome. These results suggest that the build-up of oxidized and/or misfolded proteins is responsible for the loss of cell viability in this system. Furthermore, the effectiveness of several RCS scavengers at preventing cell death suggests that PCOs are indeed the toxic species. Experiments using cyclosporin A and zVAD-fmk place protein carbonylation downstream of the MPTP opening and upstream of caspase activation. While the study focused on nPC12 cells, experiments using more differentiated PC12 cells and primary neuronal cultures yielded the same results, indicating that the above findings are not circumscribed to partially differentiated dopaminergic neurons. A schematic model summarizing our experimental findings is shown in Figure 11.
Figure 11. Schematic diagram that incorporates the major findings of this study.
Partial GSH depletion increases the production of mitochondrial ROS, which are responsible for the incorporation of carbonyl groups into proteins. The rise in proteasomal expression and activity that occurs during the first 12 h of incubation is not sufficient to overcome the increase in protein oxidation (indicated as ↑[O]/PA or increased oxidation/proteasome activity ratio), leading to the progressive accumulation of PCOs. Some cells accumulate more PCOs than others, perhaps reflecting variations in antioxidant defence mechanisms and/or in proteasome expression. When protein oxidation reaches a threshold value (3–12 h of incubation), it triggers apoptosis/necrosis. As incubation progresses, dead cells are removed from the system and the surviving cells slowly replenish their GSH to normal levels, leading to a ↓[O]/PA ratio, a decline in PCO accumulation and reduced cell death. Addition of EPO at the beginning of this period prevents the proteasome-mediated removal of damaged proteins causing a build-up of PCOs and loss of cell viability. These effects are prevented by several RCS scavengers, indicating that protein carbonylation is indeed toxic to cells.
DEM is commonly used to deplete both cytoplasmic and mitochondrial GSH and to cause oxidative stress and cell death (Freeman and Meredith, 1988). At millimolar concentrations, DEM is highly toxic and causes cell death mostly by necrosis (Nagai et al., 2002). Our study employed a much lower concentration (i.e. 50 μM) of DEM to achieve the partial GSH depletion detected in the spinal cord of EAE mice, where there is significant neuronal apoptosis (Dasgupta and Bizzozero, 2011). Under these conditions, ∼50% of the dead cells measured after 12 h of incubation with DEM displayed morphological features that are characteristic of apoptosis, with the rest being necrotic cells. A switch from apoptosis to necrosis in models with severe oxidative stress has been attributed to reduction in ATP levels below a threshold that is insufficient to support apoptosis, an energy-depended process (Eguchi et al., 1997). The mechanism linking GSH depletion and increased production of ROS by mitochondria has been studied extensively (Armstrong and Jones, 2002; Shen et al., 2005). It is generally accepted that a decline in the GSH/GSSG ratio leads to the opening of the MPTP by oxidation of a critical dithiol in the voltage-sensing region of this protein complex (Petronilli et al., 1994). When GSH falls below a certain level, permeability transition occurs, followed by a collapse in mitochondrial membrane potential. This event causes enhanced production of superoxide either from the rise in redox cycling of ubiquinone within Complex III (Chen et al., 2003) or from the reverse electron transport from succinate to NADH within Complex I (Lambert and Brand, 2004). Loss of cytochrome c from mitochondria, after permeability transition and swelling, can also augment the production of oxygen-free radicals by reducing the redox centres upstream of Complex IV (Votyakova and Reynolds, 2005). Our data are in agreement with this model since MPTP inhibition with cyclosporin A reduces protein oxidation and cell death (both apoptosis and necrosis). They also indicate that carbonylation occurs after MPTP opening and as the result of the ensuing high degree of oxidative stress. It should be emphasized that our findings are not restricted to DEM-induced cell death as a similar relationship between carbonylation and apoptosis was established in staurosporine- and BSO-treated nPC12 cells (Supplementary Figures S1 and S2 available at http://www.asnneuro.org/an/004/an004e084add.htm). It is also interesting that, by 24 h of incubation, the surviving cells are able to replenish the GSH pool completely. Recovery of GSH levels has also been observed in the brain of rats treated with DEM (Gupta et al., 2000) and in cultured astrocytes incubated with the DEM-analogue dimethyl fumarate (Lin et al., 2011), and it is generally ascribed to an antioxidant response that increases the amount of γ-glutamylcysteine synthetase, the rate-limiting enzyme of GSH biosynthesis (Lewerenz and Maher, 2011).
The incorporation of aldehyde and ketone functional groups into proteins takes place by direct and indirect mechanisms (Bizzozero, 2009). Direct protein carbonylation involves the metal ion-catalysed oxidation of threonine, lysine, arginine and proline residues to α-amino-β-oxobutyric acid, α-aminoadipic semialdehyde and glutamic semialdehyde respectively. In contrast, indirect carbonylation entails the reaction of the nucleophilic centres in cysteine, histidine or lysine residues with RCS, bifunctional carbonyl-containing molecules derived from the oxidation of lipids (e.g. 4-HNE, MDA and ACR) and carbohydrates (e.g. glyoxal and methylglyoxal) (Bizzozero, 2009). Our finding that the RCS scavengers hydralazine, methoxylamine and histidine hydrazide prevent the formation of PCOs initially suggested that carbonylation is occurring by an indirect mechanism. However, we were unable to detect RCS–protein adducts, implying that direct oxidation of amino acids residues is the most likely process and that the scavengers are able to form stable adducts with oxidized proteins. It is noteworthy that direct carbonylation appears to be also the major mechanism underlying the formation of carbonyls in the CNS of EAE mice (Zheng and Bizzozero, 2010b).
Carbonylated proteins in mitochondria and cytoplasm are digested by the Lon protease (Bota and Davies, 2002) and the 20S proteasome (Grune et al., 1997) respectively. While lactacystin can inhibit both of these proteolytic systems, EPO is highly specific for the proteasome (Kisselev and Goldberg, 2001). Thus, our findings suggest that cytoplasmic oxidized proteins are likely responsible for damage of nPC12 cells during GSH depletion. The 20S proteasome by itself plays a critical protective role during oxidative stress by digesting oxidized proteins via its chymotrypsin-like activity and without requirement for ubiquitin or energy (Shringarpure et al., 2003). Indeed, we have observed a rapid and large rise in proteasome expression and activity upon GSH depletion. This is in agreement with a recent study showing increased expression of 20S proteasome, immunoproteasome and the P28α/β regulatory particle upon incubation of murine embryonic fibroblasts with H2O2, which was interpreted as an oxidative stress adaptation mechanism designed to reduce the load of oxidized protein in the cell (Pickering et al., 2010). In our system, however, the elevation in proteasomal chymotrypsin-like activity was not sufficient to prevent the accumulation of PCOs that occurs during first 12 h of incubation with DEM, and addition of epoxomixin or lactacystin results in a further build-up of oxidized proteins. Interestingly, incubation of nPC12 cells with EPO or lactacystin alone (i.e. in the absence of DEM) does not lead to any appreciable increase in protein carbonylation, protein aggregation or cell death, indicating that basal protein oxidation in these neuron-like cells is quite low. In liver cells, however, proteasome inhibition causes increased carbonyl formation and protein aggregation, even in the absence of an obvious oxidative challenge (Demasi and Davies, 2003). This discrepancy could be attributed to differences in the cell type, the turnover rate of damaged proteins and the incubation conditions.
It has been shown that carbonylation causes inappropriate inter- and intra-protein cross-links as well as protein misfolding, which in turn results in the formation of high-molecular-mass aggregates (Grune et al., 1997; Mirzaei and Regnier, 2008). As these aggregates get larger, they precipitate, become resistant to proteolytic degradation and reduce cell viability (Nyström, 2005; Maisonneuve et al., 2008). The precise relationship between protein aggregate formation and apoptosis, or whether the aggregates are themselves cytotoxic, is unclear. However, it has been recently discovered that protein aggregates, as they form, sequester multiple pre-existent and newly synthesized proteins that have essential cellular functions and are critical for cell survival (Olzscha et al., 2011). Our results show that various carbonylation scavengers are able to prevent protein aggregation and cell death, suggesting that during GSH depletion oxidized proteins are critical for aggregate formation and cytotoxicity. In our system, protein aggregates clearly are not made of carbonylated proteins alone, since the cellular amount of carbonylated proteins is roughly 1–2% of that of the aggregates. However, protein carbonylation may expose hydrophobic surfaces that can mediate aberrant interactions with other (non-oxidized) proteins, resulting in their functional impairment and sequestration. Future studies will test whether agents capable of preventing protein aggregation can also reduce cell death without changing the extent of protein carbonylation.
Carbonylation of specific proteins has been found to be toxic as well. For instance, the occurrence of carbonyls in GAPDH (glyceraldehyde-3-phosphate dehydrogenase), ANT (adenine nucleotide translocator) and Bcl-2 has been shown to play a role in nitric oxide-induced apoptosis in insulin-producing RINm5F cells (Cahuana et al., 2004). Carbonyl modification of several chaperones, including glucose-regulated protein-78, heat-shock protein-60, heat-shock protein cognate-71, protein disulfide isomerase and calreticulin, has been linked to apoptosis of irradiated HL60 human leukaemia cells (Magi et al., 2004). Furthermore, apoptosis of etopside-treated HL60 cells is caused by reduced rate of glycolysis, which likely results from the extensive carbonylation of several glycolytic enzymes including aldolase, enolase, triosephosphate isomerase and phosphoglycerate mutase (England et al., 2004). Characterization of the carbonyl proteome of PC12 cells will determine whether similar metabolic pathways or cellular processes are affected during GSH depletion.
In sum, the present study identifies direct protein carbonylation as a critical step in neuronal cell death triggered by GSH depletion. While it is clear that other cytotoxic mechanisms may be at play in EAE, it is tempting to speculate that the reduced levels of GSH and the accumulation of PCOs observed in this disease (Dasgupta and Bizzozero, 2011) play a significant pathophysiological role. The novel findings presented herein form the basis for exploring the factors that contribute to the maintenance of low levels of PCOs within cells but most importantly for testing non-toxic carbonyl scavengers to reduce neuronal cell death in EAE and potentially MS.
ACKNOWLEDGEMENTS
We thank Mr Clark Bird (Department of Neurosciences, University of New Mexico) for his help with the primary neuronal cultures and Dr Robert Rubin (Department of Molecular Genetics and Microbiology, University of New Mexico) for the use of his plate centrifuge.
Footnotes
This work was supported by a PHHS (Public Health and Human Services) grant from the National Institutes of Health [grant number NS057755].
REFERENCES
- Altman SA, Randers L, Rao G. Comparison of trypan blue dye exclusion and fluorometric assays for mammalian cell viability determinations. Biotechnol Prog. 1993;9:671–674. doi: 10.1021/bp00024a017. [DOI] [PubMed] [Google Scholar]
- Armstrong JS, Jones DP. Glutathione depletion enforces the mitochondrial permeability transition and causes cell death in Bcl-2-overexpressing HL60 cells. FASEB J. 2002;16:1263–1265. doi: 10.1096/fj.02-0097fje. [DOI] [PubMed] [Google Scholar]
- Aksenov MY, Aksenova MV, Butterfield DA, Geddes JW, Markesbery WR. Protein oxidation in the brain in Alzheimer's disease. Neuroscience. 2001;103:373–383. doi: 10.1016/s0306-4522(00)00580-7. [DOI] [PubMed] [Google Scholar]
- Bizzozero OA. Protein carbonylation in neurodegenerative and demyelinating CNS diseases. In: Lajtha A, Banik N, Ray S, editors. In Handbook of Neurochemistry and Molecular Neurobiology. New York, NY: Springer; 2009. pp. 543–562. [Google Scholar]
- Bizzozero OA, Dejesus G, Callahan K, Pastuszyn A. Elevated protein carbonylation in the brain white matter and gray matter of patients with multiple sclerosis. J Neurosci Res. 2005;81:687–695. doi: 10.1002/jnr.20587. [DOI] [PubMed] [Google Scholar]
- Bizzozero OA, Ziegler JL, De Jesus G, Bolognani F. Acute depletion of reduced glutathione causes extensive carbonylation of rat brain proteins. J Neurosci Res. 2006;83:656–667. doi: 10.1002/jnr.20771. [DOI] [PubMed] [Google Scholar]
- Bota DA, Davies KJ. Lon protease preferentially degrades oxidized mitochondrial aconitase by an ATP-stimulated mechanism. Nat Cell Biol. 2002;4:674–680. doi: 10.1038/ncb836. [DOI] [PubMed] [Google Scholar]
- Buchmüller-Rouiller Y, Corrandin SB, Smith J, Schneider P, Ransijn A, Jongeneel CV, Mauel J. Role of glutathione in macrophage activation: effect of cellular glutathione depletion on nitrite production and leishmanicidal activity. Cell Immunol. 1995;164:73–80. doi: 10.1006/cimm.1995.1144. [DOI] [PubMed] [Google Scholar]
- Cahuana GM, Tejedo JR, Jiménez J, RamıÍrez R, Sobrino F, Bedoya FJ. Nitric oxide-induced carbonylation of Bcl-2, GAPDH and ANT precedes apoptotic events in insulin-secreting RINm5F cells. Exp Cell Res. 2004;293:22–30. doi: 10.1016/j.yexcr.2003.10.004. [DOI] [PubMed] [Google Scholar]
- Chen Q, Vazquez EJ, Moghaddas S, Hoppel CL, Lesnefsky EJ. Production of reactive oxygen species by mitochondria: central role of complex III. J Biol Chem. 2003;278:36027–36031. doi: 10.1074/jbc.M304854200. [DOI] [PubMed] [Google Scholar]
- Dalle-Donne I, Rossi R, Giustarini D, Gagliano N, Lusini L, Milzani A, Di Simplicio P, Colombo R. Actin carbonylation: from a simple marker of protein oxidation to relevant signs of severe functional impairment. Free Radical Biol Med. 2001;31:1075–1083. doi: 10.1016/s0891-5849(01)00690-6. [DOI] [PubMed] [Google Scholar]
- Dasgupta A, Bizzozero OA. Positive correlation between protein carbonylation and apoptosis in EAE. Trans Am Soc Neurochem. 2011;42:PSM08–01. [Google Scholar]
- Davies MJ. The oxidative environment and protein damage. Biochim Biophys Acta. 2005;1703:93–109. doi: 10.1016/j.bbapap.2004.08.007. [DOI] [PubMed] [Google Scholar]
- Demasi M, Davies KJ. Proteasome inhibitors induce intracellular protein aggregation and cell death by an oxygen-dependent mechanism. FEBS Lett. 2003;542:89–94. doi: 10.1016/s0014-5793(03)00353-3. [DOI] [PubMed] [Google Scholar]
- Divald A, Powell SR. Proteasome mediates removal of proteins oxidized during myocardial ischemia. Free Radical Biol Med. 2006;40:156–164. doi: 10.1016/j.freeradbiomed.2005.09.022. [DOI] [PubMed] [Google Scholar]
- Eguchi Y, Shimizu S, Tsujimoto Y. Intracellular ATP levels determine cell death fate by apoptosis or necrosis. Cancer Res. 1997;57:1835–1840. [PubMed] [Google Scholar]
- England K, O'Driscoll C, Cotter TG. Carbonylation of glycolytic proteins is a key response to drug-induced oxidative stress and apoptosis. Cell Death Differ. 2004;11:252–260. doi: 10.1038/sj.cdd.4401338. [DOI] [PubMed] [Google Scholar]
- Ferrante RJ, Browne SE, Shinobu LA, Bowling AC, Baik MJ, MacGarvey U, Kowall NW, Brown RH, Beal MF. Evidence of increased oxidative damage in both sporadic and familial amyotrophic lateral sclerosis. J Neurochem. 1997;69:2064–2074. doi: 10.1046/j.1471-4159.1997.69052064.x. [DOI] [PubMed] [Google Scholar]
- Ferrington DA, Husom AD, Thompson LV. Altered proteasome structure, function and oxidation in aged muscle. FASEB J. 2005;19:644–646. doi: 10.1096/fj.04-2578fje. [DOI] [PubMed] [Google Scholar]
- Floor E, Wetzel MG. Increased protein oxidation in human sustantia nigra pars compacta in comparison with basal ganglia and prefrontal cortex measured with an improved dinitrophenylhydrazine assay. J Neurochem. 1998;70:268–275. doi: 10.1046/j.1471-4159.1998.70010268.x. [DOI] [PubMed] [Google Scholar]
- Freeman ML, Meredith MJ. Subcellular localization of glutathione and thermal sensitivity. Radiat Res. 1988;115:461–471. [PubMed] [Google Scholar]
- Fucci L, Oliver CN, Coon MJ, Stadtman ER. Inactivation of key metabolic enzymes by mixed-function oxidation reactions: possible implication in protein turnover and ageing. Proc Natl Acad Sci USA. 1983;80:1521–1525. doi: 10.1073/pnas.80.6.1521. [DOI] [PMC free article] [PubMed] [Google Scholar]
- Gao G, Xing J, Xiao X, Liou AF, Gao Y, Yin XM, Clark RS, Graham SH, Chen J. Critical role of calpain I in mitochondrial release of apoptosis-inducing factor in ischemic neuronal injury. J Neurosci. 2007;27:9278–9293. doi: 10.1523/JNEUROSCI.2826-07.2007. [DOI] [PMC free article] [PubMed] [Google Scholar]
- Grune T, Reinheckel T, Davies KJ. Degradation of oxidized proteins in mammalian cells. FASEB J. 1997;11:526–534. [PubMed] [Google Scholar]
- Gupta A, Datta M, Shukla GS. Cerebral antioxidant status and free radical generation following glutathione depletion and subsequent recovery. Mol Cell Biochem. 2000;209:55–61. doi: 10.1023/a:1007000430394. [DOI] [PubMed] [Google Scholar]
- Guyton MK, Wingrave JM, Yallapragada AV, Wilford GG, Sribnick EA, Matzelle DD, Tyor WR, Ray SK, Banik NL. Upregulation of calpain correlates with increased neurodegeneration in acute experimental autoimmune encephalomyelitis. J Neurosci Res. 2005;81:53–61. doi: 10.1002/jnr.20470. [DOI] [PubMed] [Google Scholar]
- Harms KM, Li L, Cunningham LA. Murine neural stem/progenitor cells protect neurons against ischemia by HIF-1a-Regulated VEGF signaling. PLoS ONE. 2010;5:e9767. doi: 10.1371/journal.pone.0009767. [DOI] [PMC free article] [PubMed] [Google Scholar]
- Hassen GW, Feliberti J, Kesner L, Stracher A, Mokhtarian F. A novel calpain inhibitor for the treatment of acute experimental autoimmune encephalomyelitis. J Neuroimmunol. 2006;180:135–146. doi: 10.1016/j.jneuroim.2006.08.005. [DOI] [PubMed] [Google Scholar]
- Jomova K, Vondrakova D, Lawson M, Valko M. Metals, oxidative stress and neurodegenerative disorders. Mol Cell Biochem. 2010;345:91–104. doi: 10.1007/s11010-010-0563-x. [DOI] [PubMed] [Google Scholar]
- Kisselev AF, Goldberg AL. Proteasome inhibitors: from research tools to drug candidates. Chem Biol. 2001;8:739–758. doi: 10.1016/s1074-5521(01)00056-4. [DOI] [PubMed] [Google Scholar]
- Lambert AJ, Brand MD. Superoxide production by NADH:ubiquinone oxidoreductase (complex I) depends on the pH gradient across the mitochondrial inner membrane. Biochem J. 2004;382:511–517. doi: 10.1042/BJ20040485. [DOI] [PMC free article] [PubMed] [Google Scholar]
- Lewerenz J, Maher P. Control of redox state and redox signaling by neural antioxidant systems. Antiox Redox Signal. 2011;14:1449–1465. doi: 10.1089/ars.2010.3600. [DOI] [PubMed] [Google Scholar]
- Lin S, Lisi L, Russo CD, Polak PE, Sharp A, Weinberg G, Kalinin S, Feinstein DL. The anti-inflammatory effects of dimethyl fumarate in astrocytes involve glutathione and haem oxygenase-1. ASN NEURO. 2011;3((2)):art:e00055. doi: 10.1042/AN20100033. doi:10.1042/AN20100033. [DOI] [PMC free article] [PubMed] [Google Scholar]
- Luo S, Wehr NN. Protein carbonylation: avoiding pitfalls in the 2,4-dinitrophenylhydrazine assay. Redox Rep. 2009;14:159–166. doi: 10.1179/135100009X392601. [DOI] [PubMed] [Google Scholar]
- Magi B, Ettorre A, Liberatori S, Bini L, Andreassi M, Frosali S, Neri P, Pallini V. Selectivity of protein carbonylation in the apoptotic response to oxidative stress associated with photodynamic therapy: a cell biochemical and proteomic investigation. Cell Death Differ. 2004;11:842–852. doi: 10.1038/sj.cdd.4401427. [DOI] [PubMed] [Google Scholar]
- Maisonneuve E, Ezraty B, Dukan S. Protein aggregates: an aging factor involved in cell death. J Bacteriol. 2008;190:6070–6075. doi: 10.1128/JB.00736-08. [DOI] [PMC free article] [PubMed] [Google Scholar]
- Mirzaei H, Regnier F. Protein:protein aggregation induced by protein oxidation. J Chromatogr. 2008;873:8–14. doi: 10.1016/j.jchromb.2008.04.025. [DOI] [PubMed] [Google Scholar]
- Nagai H, Matsumaru K, Feng G, Kaplowitz N. Sensitization to tumor necrosis factor-α-induced apoptosis in cultured mouse hepatocytes. Hepatology. 2002;36:55–64. doi: 10.1053/jhep.2002.33995. [DOI] [PubMed] [Google Scholar]
- Namura S, Zhu J, Fink K, Endres M, Srinivasan A, Tomaselli K, Yuan J, Moskowitz MA. Activation and cleavage of caspase-3 in apoptosis induced by experimental cerebral ischemia. J Neurosci. 1998;18:3659–3668. doi: 10.1523/JNEUROSCI.18-10-03659.1998. [DOI] [PMC free article] [PubMed] [Google Scholar]
- Nyström T. Role of oxidative carbonylation in protein quality control and senescence. EMBO J. 2005;24:1311–1317. doi: 10.1038/sj.emboj.7600599. [DOI] [PMC free article] [PubMed] [Google Scholar]
- Ohkawa H, Ohishi N, Yagi K. Assay for lipid peroxides in animal tissues by thiobarbituric acid reaction. Anal Biochem. 1979;95:351–358. doi: 10.1016/0003-2697(79)90738-3. [DOI] [PubMed] [Google Scholar]
- Olzscha H, Schermann SM, Woerner AC, Pinket S, Hecht MH, Tartaglia GG, Vendruscolo M, Hayer-Hartl M, Hartl FU, Vabulas RM. Amyloid-like aggregates sequester numerous metastable proteins with essential cellular functions. Cell. 2011;144:67–78. doi: 10.1016/j.cell.2010.11.050. [DOI] [PubMed] [Google Scholar]
- Petronilli V, Costantini P, Scorrano L, Colonna R, Passamonti S, Bernardi P. The voltage sensor of the mitochondrial permeability transition pore is tuned by the oxidation-reduction state of vicinal thiols. Increase of the gating potential by oxidants and its reversal by reducing agents. J Biol Chem. 1994;269:16638–16642. [PubMed] [Google Scholar]
- Pickering AM, Koop AL, Teoh CY, Ermak G, Grune T, Davies KJ. The immunoproteasome, the 20S proteasome and the PA28αβ proteasome regulator are oxidative-stress-adaptive proteolytic complexes. Biochem J. 2010;432:585–594. doi: 10.1042/BJ20100878. [DOI] [PMC free article] [PubMed] [Google Scholar]
- Reynolds A, Laurie C, Mosley RL, Gendelman HE. Oxidative stress and the pathogenesis of neurodegenerative disorders. Int Rev Neurobiol. 2007;82:297–325. doi: 10.1016/S0074-7742(07)82016-2. [DOI] [PubMed] [Google Scholar]
- Rinaudo MT, Piccinini M. Immunoproteasome activity in the nervous system. In: Lajtha A, Galoya A, Besedorsky H, editors. In Handbook of Neurochemistry and Molecular Neurobiology: Neuroimmunology. Vol. 12. New York, NY: Springer; 2007. pp. 223–235. [Google Scholar]
- Rodgers KJ, Dean RT. Assessment of proteasome activity in cell lysates and tissue homogenates using peptide substrates. Int J Biochem Cell Biol. 2003;35:716–727. doi: 10.1016/s1357-2725(02)00391-6. [DOI] [PubMed] [Google Scholar]
- Shaik IH, Mehvar R. Rapid determination of reduced and oxidized glutathione levels using a new thiol-masking reagent and the enzymatic recycling method: application to the rat liver and bile samples. Anal Bioanal Chem. 2006;385:105–113. doi: 10.1007/s00216-006-0375-8. [DOI] [PMC free article] [PubMed] [Google Scholar]
- Shen D, Dalton TP, Nebert DW, Shertzer HG. Glutathione redox state regulates mitochondrial reactive oxygen production. J Biol Chem. 2005;280:25305–25312. doi: 10.1074/jbc.M500095200. [DOI] [PubMed] [Google Scholar]
- Shringarpure R, Grune T, Mehlhase J, Davies KJ. Ubiquitin conjugation is not required for the degradation of oxidized proteins by proteasome. J Biol Chem. 2003;278:311–318. doi: 10.1074/jbc.M206279200. [DOI] [PubMed] [Google Scholar]
- Smerjac SM, Bizzozero OA. Cytoskeletal protein carbonylation and degradation in experimental autoimmune encephalomyelitis. J Neurochem. 2008;105:763–772. doi: 10.1111/j.1471-4159.2007.05178.x. [DOI] [PMC free article] [PubMed] [Google Scholar]
- Starke PE, Oliver CN, Stadtman ER. Modification of hepatic proteins in rats exposed to high oxygen concentration. FASEB J. 1987;1:36–39. doi: 10.1096/fasebj.1.1.2886388. [DOI] [PubMed] [Google Scholar]
- Votyakova TV, Reynolds IJ. Ca2+-induced permeabilization promotes free radical release from rat brain mitochondria with partially inhibited complex I. J Neurochem. 2005;93:526–537. doi: 10.1111/j.1471-4159.2005.03042.x. [DOI] [PubMed] [Google Scholar]
- Zheng J, Bizzozero OA. Traditional reactive carbonyl scavengers do not prevent the carbonylation of brain proteins induced by acute glutathione depletion. Free Radical Res. 2010a;44:258–266. doi: 10.3109/10715760903456092. [DOI] [PMC free article] [PubMed] [Google Scholar]
- Zheng J, Bizzozero OA. Accumulation of protein carbonyls within cerebellar astrocytes in murine experimental autoimmune encephalomyelitis. J Neurosci Res. 2010b;88:3376–3385. doi: 10.1002/jnr.22488. [DOI] [PMC free article] [PubMed] [Google Scholar]


