Abstract
The mechanical role of non-fibrillar matrix and the nature of its interaction with the collagen network in soft tissues remain poorly understood, in part because of the lack of a simple experimental model system to quantify these interactions. This study’s objective was to examine mechanical and structural properties of collagen-agarose co-gels, utilized as a simplified model system, to understand better the relationships between the collagen network and non-fibrillar matrix. We hypothesized that the presence of agarose would have a pronounced effect on microstructural reorganization and mechanical behavior. Samples fabricated from gel solutions containing 1.0 mg/mL collagen and 0, 0.125, or 0.25% w/v agarose were evaluated via scanning electron microscopy, incremental tensile stress-relaxation tests, and polarized light imaging. While the incorporation of agarose did not dramatically alter collagen network morphology, agarose led to concentration-dependent changes in mechanical and structural properties. Specifically, resistance of co-gels to volume change corresponded with differences in fiber reorientation and elastic/viscoelastic mechanics. Results demonstrate strong relationships between tissue properties and offer insight into behavior of tissues of varying Poisson’s ratio and fiber kinematics. Results also suggest that non-fibrillar material may have significant effects on properties of artificial and native tissues even in tension, which is generally assumed to be collagen dominated.
Keywords: Non-fibrillar matrix, Fiber-matrix interactions, Collagen gel, Agarose, Soft tissue analog, Mechanical and structural properties
INTRODUCTION
Connective soft tissues have complex mechanical properties that are determined by their constituent collagen fiber network and surrounding non-fibrillar material. The mechanical role of non-fibrillar material and the nature of its interaction with the collagen network remain poorly understood. Non-fibrillar material is generally modeled via the rule of mixtures 28,29 or as a contributor to the isotropic components of a strain-energy function.7,36 Explicit accounting for fiber-matrix interaction at the microscopic scale is rare and not generally developed, in part because of the lack of a simple experimental model system to examine and quantify the interaction between collagen fibers and non-fibrillar matrix. In studies that have accounted for fiber-matrix interactions, 9,24,27,34 the mathematical representation of these interactions varies considerably. The development of a simple but representational experimental system will allow for greater insight into the interaction between fibers and the non-fibrillar matrix.
Reconstituted Type I collagen gels, whose properties can be easily modified during fabrication,37 are an attractive model tissue for exploring micro- and macroscale relationships between constituents.4,13,14,26,31 The standard collagen gel formulation, however, lacks the non-fibrillar components (i.e., proteoglycans, glycosaminoglycans, minor collagens, etc.) present in native tissue. Some recent work1,19,33 has explored adding agarose, a biocompatible linear polysaccharide extracted from agar, to type I collagen gels in order to alter the microenvironment of cultured cells. One particular advantage of agarose is a large increase in stiffness that occurs with small changes in concentration. 23 Indeed, when incorporated into collagen I gels during preparation, low quantities of agarose dramatically increased the shear storage modulus.33 Importantly, this large mechanical change occurred with minimal changes in collagen fiber diameter or architecture (up to 0.25% w/v agarose), thus presenting a modified collagen gel system that allows for modulation of mechanical properties without significantly altering the morphology of the collagen fiber network.
In this study, we suggest that the collagen-agarose co-gel can serve as the model system needed to investigate the mechanical role of non-fibrillar ECM and to examine interactions between tissue constituents. These interactions are likely complex and variable with tissue loading conditions, but even under the simplest macroscopic conditions, the role of non-fibrillar matrix could be important. For example, under the simple loading protocol of uniaxial tension, fiber networks exhibit dramatic fiber rotation and area loss30 similar to that exhibited by several native tissues,6,11,15,20 and these responses are likely affected by the presence of, and interaction with, non-fibrillar matrix. We hypothesized that even though collagen fibers are generally assumed to be the predominant load bearing mechanism for tissues in tension, the presence of agarose in co-gels would have a pronounced effect on microstructural network reorganization and elastic/viscoelastic mechanical behavior. Therefore, the objective of this study was to examine the mechanical and structural properties of collagen-agarose co-gels in uniaxial tension to understand better the nature of, and the relationships between, the collagen fiber network and non-fibrillar matrix of simplified tissue analogs.
MATERIALS AND METHODS
Sample Preparation
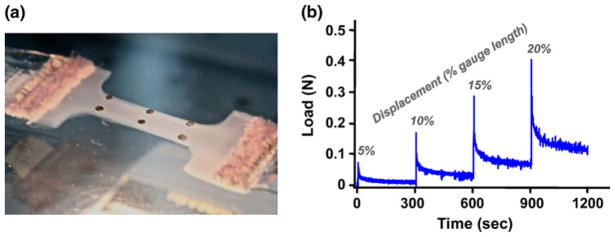
Collagen-agarose co-gels were prepared using an adapted protocol.33 Briefly, 2.2 mg/mL bovine dermal collagen solution (Organogenesis, Canton, MA) was mixed with 1 M 4-(2-hydroxyethyl)-1-piper-azineethanesulfonic acid (HEPES, Cellgro, Manassas, VA), 0.1 M NaOH, 10× Modified Eagle’s Medium (MEM, Sigma-Aldrich, St. Louis, MO), and fetal bovine serum (HyClone, Logan, UT) in proper volumes to prepare a stock collagen solution at 1.5 mg/mL, which was kept on ice. Low-melt agarose powder (A9414, Sigma) was dissolved in Dulbecco’s Modification of Eagle’s Medium (DMEM, Cellgro) to create an agarose stock solution at 2% w/v. Agarose stock solution was cooled to ~60 °C and combined with appropriate volumes of collagen stock solution and DMEM to yield gel solutions containing 1.0 mg/mL collagen and 0% (NoAg), 0.125% (LoAg), or 0.25% (HiAg) w/v agarose. Final gel solutions were cast in dog-bone shaped Teflon molds (Fig. 1) with a 24 × 8 × 3 mm center region. Small pieces were cut from a natural fiber scour pad (3 M, St. Paul, MN) and placed in the far end of each mold; the large pores of the scour pad allowed penetration of the gel solution during casting and, after gelation, provided a firm material for gripping in mechanical testing. Molds were filled with gel solution, kept at 4 °C for 4 min to initiate agarose gelation, and then transferred to 37 °C for 30 min to promote collagen self-assembly. After gel formation, samples were stored at 4 °C until microscopy preparation or mechanical testing.
FIGURE 1.
(a) Test sample during uniaxial tensile test demonstrates pattern/placement of strain markings and sample shape; (b) example load-time curve showing incremental displacement steps followed by 300 s relaxation periods.
Electron Microscopy
Samples of each gel type were imaged using scanning electron microscopy (SEM). For comparison purposes, a high-density agarose-only gel (2% w/v) was also prepared and imaged. To prepare samples for SEM, small gel pieces were washed in 0.4 M sodium cacodylate and 0.2 M sucrose, fixed in 10% gluteraldehyde for 2 h, and stained with 2% osmium tetroxide for 1 h (all reagents from Electron Microscopy Sciences, Hatfield, PA). Samples were then sequentially dehydrated with ethanol, freeze-fractured using liquid nitrogen, desiccated with a critical point dryer (Samdri-780A, Tousimis Research Corp., Rockville, MD), and sputter coated with platinum for 10 min (DV-502, Denton Vacuum, Moorestown, NJ). Secondary electron images were acquired on a scanning electron microscope (S-900, Hitachi Ltd., Tokyo, Japan) at the University of Minnesota’s Characterization Facility with an excitation voltage of 2 kV at 10,000× and 50,000× magnification to visualize integration of agarose and collagen. At least two gels per group were evaluated, with images taken at different sample locations.
Mechanical Testing and Polarized Light Imaging
Prior to testing, a grid of round markers (2 × 3) was drawn on the center portion of test samples using Verhoeff’s stain to allow for image-based strain tracking (Fig. 1a). Samples (n = 6–8 per group) were placed in a water bath at room temperature and secured in a tensile test system (Instron, Norwood, MA). Preliminary evaluation of collagen and agarose gel swelling in water and phosphate buffered saline (PBS) indicated no significant differences in volume due to either bath solution, therefore water was used for all testing in this study. After application of a 0.005 N tare load, samples were subjected to a four-step, incremental ramp displacement and relaxation protocol (Fig. 1b). Each displacement step of 1.2 mm (5% of the undeformed gauge length) was applied in 1 s, followed by a 300-s relaxation interval. A quantitative polarized light imaging (QPLI) system was used during testing to acquire collagen fiber organization data and to construct maps indicating average direction and strength of collagen fiber alignment.32 QPLI image sets were captured after application of the tare load (zero displacement), and immediately after each of the displacement steps (5, 10, 15, and 20%). Images acquired for collagen fiber orientation analysis were also used for strain analysis in the length–width plane (1- and 2-directions), and a second camera placed lateral to the test device acquired side-view images during testing in order to compute strain in the length-thickness plane (1- and 3-directions).
Data Analysis
Load–displacement curves were analyzed to compute peak force (fp) and equilibrium force (feq = value at end of relaxation interval) at each displacement step, and percent relaxation was defined as follows:
| (1) |
where fo is the load value immediately prior to change in displacement (i.e., the equilibrium load from the previous step). In order to evaluate time dependence, relaxation curves were created at each displacement step by plotting normalized (by peak) load values at nine equally spaced points on a log time scale (from 0 to 300 s).
Two-dimensional strain on the sample surface was determined using a custom Matlab program to quantify the position of stain markers during testing. Marker coordinates at zero displacement ( ) and each displacement step ( ) were used to calculate the two-dimensional deformation gradient (F) and translation vector (p):
| (2) |
where the number of stain markers (n) for each sample was six. Using the deformation gradient F, the twodimensional Lagrangian strain (E) was calculated as follows:
| (3) |
where I is the identity matrix and the components of E are normal strain E11 and E22, and shear strain E12. In addition, side-view images were analyzed to calculate E33. Specifically, the line tool in ImageJ (NIH, Bethesda, MD) was used to measure gel thickness at zero displacement (ho) and at subsequent displacement steps (h), where pixel values were converted to millimeters using a calibration image. Assuming no shear, Eq. (3) reduces to the following expression for the Lagrangian strain E33
| (4) |
where λ3 is the stretch in the thickness direction and is defined, along with λ1 and λ2, as:
| (5) |
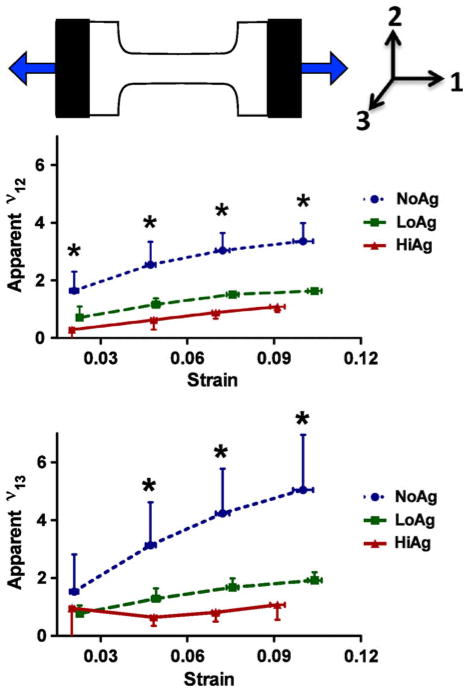
Length (l) and width (w) measurements were made using images in the 1–2 plane, and cross-sectional area (CSA) measurements (thickness × width) were calculated for each sample. Initial CSA values (h0 × w0) were used to convert peak/equilibrium force values to peak/equilibrium 1st Piola–Kirchoff stresses, which were plotted against E11. A linear fit to the last three points of each stress–strain curve (corresponding to stress and strain values at 10, 15, and 20% gauge-length displacement) generated approximate peak/equilibrium modulus values. Finally, apparent Poisson’s ratios for both the length–width (ν12) and length–thickness (ν13) planes were computed:
| (6) |
and plotted, by gel group, against E11. Computing the apparent Poisson’s ratio in this manner has the advantage that ν12 = ν13 = 0.5 for incompressible materials even at finite strain, facilitating interpretation of these values in the context of relative compressibility.
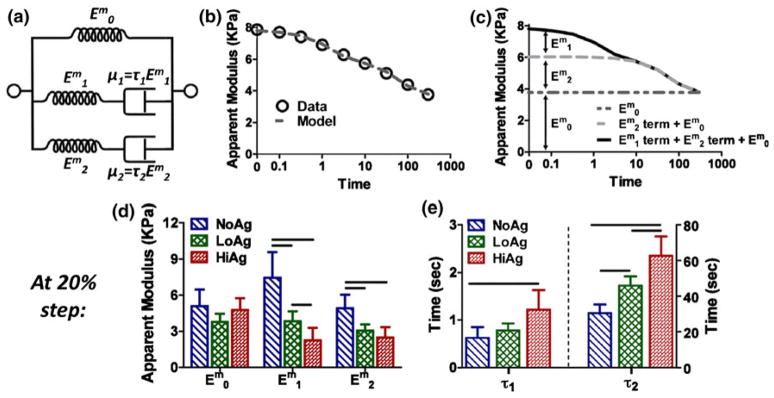
In order to quantify the relative contributions of the elastic and viscous components of the overall viscoelastic response, the relaxation data at each displacement step were fit to a simple mathematical model. A standard linear solid model, constructed with a spring and a Maxwell element (spring in series with a dashpot) in parallel, was unable to provide adequate fits to the data (not shown). A second Maxwell element was added in parallel, and the resulting two-relaxation-time solid linear model (Fig. 6a) fit the experimental data well (e.g., Fig. 6b). For each sample, at each displacement step, stress values were divided by strain (E11) to calculate apparent modulus ( ), which was then fit by least squares to the equation:
| (7) |
where are elastic moduli values (note: superscript “m” distinguishes these from the components of the strain tensor E), τi are relaxation time constants, μi are viscosity coefficients, and t is relaxation time (0–300 s for each step).
FIGURE 6.
(a) Schematic representing formulation of the two-relaxation-time solid linear model ( ; μi = material coefficients of viscosity; τi = relaxation time constants); (b) example model fit to experimental apparent modulus values; (c) evaluation of the data in (b) shows the relative contribution of each term of the solid linear model to the overall time-dependent , specifically, the equilibrium ( ), early-time ( term), and late-time ( term) components; (d) decreased elastic moduli and (e) increased viscosity coefficients (shown at 20% displacement) demonstrate a more viscous response with increasing agarose concentration (mean ± 95% CI; n = 6–8/group; horizontal bars = significant differences).
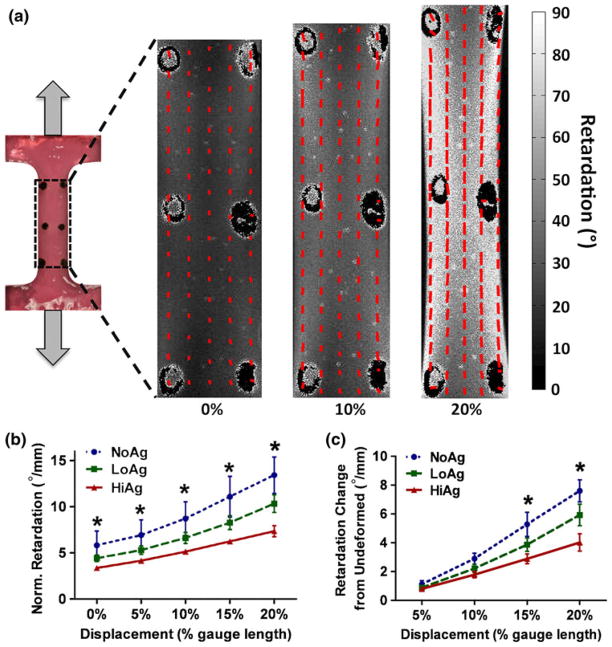
Using the acquired sets of polarized light images, collagen fiber alignment maps were calculated for each sample’s center region at each displacement step, where angle and retardation values indicate the average direction and strength of collagen fiber alignment, respectively. Retardation values are dependent on both collagen density and sample thickness. While all gel formulations contained the same collagen concentration (1 mg/mL), gelled samples exhibited some variation in thickness due to slightly unequal volumes of solution being cast into molds. Therefore, average retardation values for each alignment map were normalized by the sample-specific (undeformed) thickness. Differences in average retardation were computed between zero displacement and each subsequent displacement step.
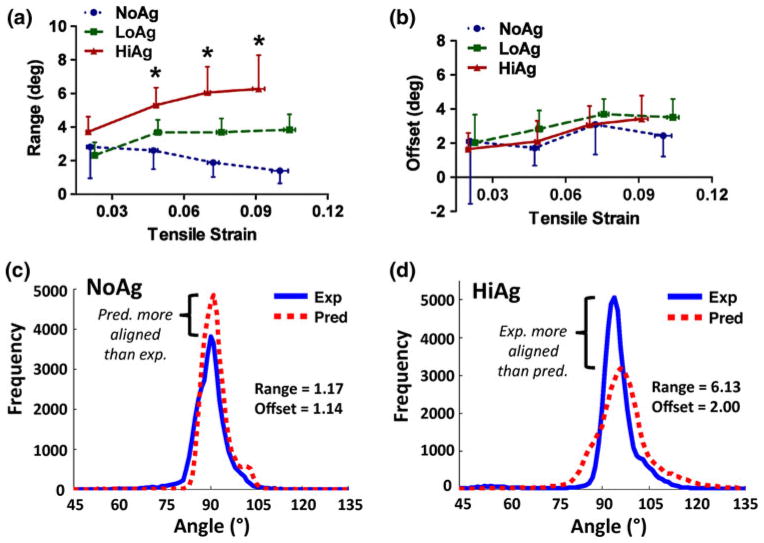
Using alignment maps at each displacement step, quantitative projection plot analysis12,16 was used to examine collagen fiber kinematics of each sample. In particular, samples from each gel type were evaluated to determine whether fibers deformed according to the affine assumption, meaning that local collagen kinematics follow the macroscopic tissue deformation. Projection plots quantify agreement between two distributions in terms of location (represented by “offset” values) and spread/shape (represented by “range” values), where large parameter values indicate poor agreement. In this study, collagen fiber orientation angles in the undeformed samples (θo) were used to calculate the predicted distribution of fiber orientations at each displacement step, with the assumption of affine fiber kinematics.16,17,21 That is, if a fiber follows the vector vj in the undeformed configuration, and the macroscopic deformation tensor is Fij, then the fiber follows the vector Fijvj in the deformed state. In terms of fiber angle, this assumption implies that
| (8) |
where θp are the predicted orientation angles, and F11, F22, F21, and F12 are components of the 2D deformation gradient (Eq. (2)). QPLI angle measurements, which were taken in the 1–2 plane, represent orientation averaged through the thickness (in the 3-direction); it was assumed that fiber reorientation in the 3-direction would not alter average angle alignment in the 1–2 plane, and thus, F33 was not utilized in calculating affine predictions. Projection plots were then used to compare experimentally measured fiber distributions to affine predicted distributions at each displacement step; values were averaged by gel type and plotted as a function of E11 strain.
Statistical Analysis
All mechanical test data were grouped by gel type (NoAg, LoAg, and HiAg) and plotted as mean values ± 95% confidence intervals. Using one-way ANOVA, test parameters (peak load, equilibrium load, peak modulus, equilibrium modulus, percent relaxation, Poisson’s ratios, elastic moduli values, relaxation time constants, normalized retardation, and change in retardation) were compared at each displacement step to evaluate differences between gel types. When significant differences were observed, post hoc t tests with Bonferroni corrections were utilized to identify where differences occurred. At each log time-step of the relaxation curves, one-way ANOVAs were used to identify statistical differences in values due to displacement step (e.g., 5%) or agarose concentration (e.g., HiAg). Paired t tests were also employed to evaluate differences between peak and equilibrium modulus values, and between Poisson’s ratios ν12 and ν13 within each gel formulation. Finally, Pearson correlation coefficients were computed for each gel type to evaluate whether peak stress and normalized retardation values were linearly dependent. For all statistical tests, significance was set at p<0.05.
RESULTS
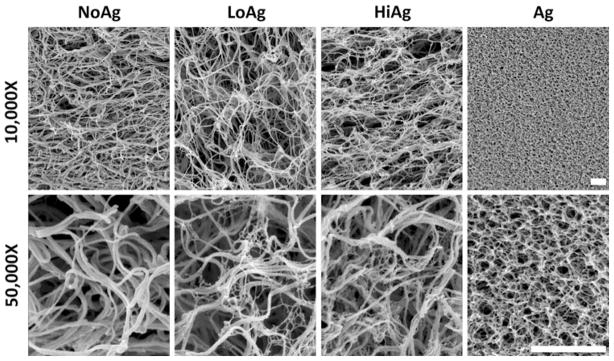
Scanning electron micrographs (Fig. 2) demonstrate relatively loose, unorganized networks of wavy collagen fibers for the three different gel types. The LoAg and HiAg samples showed an interspersed web-like agarose matrix that formed between collagen fibers, with an increased amount of agarose visible for the HiAg samples. The agarose in the co-gels was similar in appearance to the structural morphology of an agarose-only gel (Fig. 2, right), suggesting that polymerization of agarose was not prevented by self-assembly of the collagen fiber network. Importantly, the addition of agarose in the LoAg and HiAg groups did not result in any qualitative differences in the morphology and topology of the collagen fiber network compared to the NoAg samples.
FIGURE 2.
Scanning electron images at 10,000× and 50,000× magnification (top and bottom rows, respectively) illustrate network morphology with increasing agarose concentration from NoAg (0% agarose) to HiAg (0.25% agarose), where fine web-like agarose forms among larger fibers of collagen network; agarose-only gels (far right) exhibit very different structural properties (scale bars = 1 μm).
Peak load values decreased with increasing agarose content (Fig. 3a), with the HiAg group demonstrating significantly smaller values than NoAg (at 10, 15, and 20% displacement) and LoAg (at 5, 10, and 20% displacement). In contrast, equilibrium load values were increased for the agarose-containing groups (Fig. 3b): NoAg samples exhibited significantly smaller values than LoAg (at 5 and 10% displacement) and HiAg (at 5, 10, and 15% displacement). A consequence of these contrasting effects was large differences in total percent relaxation (Fig. 3c), where the amount of relaxation was significantly less with increased agarose content at 5, 10, and 15% displacement. At 20% displacement, there were no differences in total relaxation, with samples from each group averaging approximately 85% relaxation.
FIGURE 3.
(a) HiAg samples demonstrate smaller peak load values and (b) larger equilibrium load values than NoAg; (c) at lower displacement levels total relaxation decreases with increasing agarose content (mean ± 95% CI; n = 6–8/group; * significant differences).
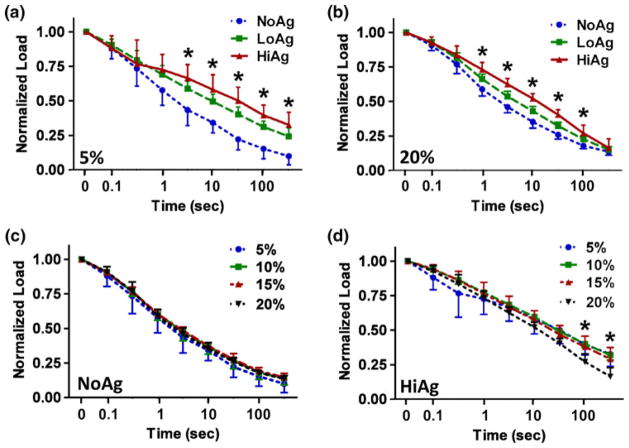
In terms of relaxation rate, there were large differences in time-dependent behavior for the three gel groups (Figs. 4a, 4b). At the 5% displacement step (Fig. 4a), the rate of stress-relaxation decreased monotonically for increasing agarose concentration with significant differences apparent beginning at ~3 s. While this effect was qualitatively less pronounced at the 20% step (Fig. 4b), there continued to be large differences in relaxation behavior between groups, with significant differences measured between 1 and 100 s. For example, the time required to reach 50% relaxation was 2.5, 5.5, and 13.7 s for the NoAg, LoAg, and HiAg groups at 20% displacement, respectively, demonstrating persistent time-dependent effects due to agarose concentration even at high levels of displacement. In order to evaluate relaxation rate dependence on displacement step (and hence, strain), relaxation curves for all four increments were compared within each gel type (Figs. 4c, 4d). The NoAg samples exhibited relaxation behavior that was independent of displacement step (no differences at any time point), while the HiAg samples demonstrated some variability, specifically a slightly faster relaxation rate at 20% displacement (with significant differences measured at the last two time points).
FIGURE 4.
(a, b) Normalized load relaxation curves demonstrate slower relaxation with increasing agarose content, with differences becoming less pronounced at larger displacement (from 5 to 20% displacement); NoAg relaxation (c) is independent of displacement level, while HiAg (d) exhibits slight differences in relaxation behavior at different levels of displacement (mean ± 95% CI; n = 6–8/group; * significant differences).
Group-averaged 1st Piola–Kirchoff stress and Green–Lagrange strain curves demonstrate significantly increased peak values for NoAg compared to agarose-containing groups (Fig. 5a), but minimal differences in equilibrium stress values between different gel types (Fig. 5b), with a significant difference measured only at the first displacement step. Differences in stress–strain behavior are summarized statistically by comparison of linear modulus values (Fig. 5c). Specifically, peak modulus values were larger for NoAg than both LoAg and HiAg, and NoAg equilibrium modulus values were also larger than LoAg. In addition, within each gel type, peak modulus values were significantly larger than equilibrium values.
FIGURE 5.
1st Piola–Kirchoff stress and Green–Lagrange strain curves demonstrate differences between groups in peak stress (a), but minimal differences in equilibrium stress (b); modulus values (c) quantify these group differences and indicate significant differences between peak-equilibrium modulus values within each group (mean ± 95% CI; n = 6–8/group; horizontal bars = significant differences).
The two-relaxation-time solid linear model (Fig. 6a) provided good fits to experimental data (e.g., Fig. 6b). In this model formulation, represents the apparent modulus value at the end of the relaxation period, and τ1 correspond to early behavior (~1 s), and and τ2 describe the late-time (~40 s) response (Fig. 6c). At each displacement step, there were no differences in , but there were significant differences in both and , which decreased with increasing agarose concentration (e.g., at 20% displacement, Fig. 6d). In contrast, the long-time relaxation parameter τ2 increased with agarose content at each displacement step; τ1 also increased for co-gels, but differences were only significant at the 20% displacement step (Fig. 6e).
Apparent Poisson’s ratios showed significant differences between each of the three gel types at each displacement step for both ν12 and ν13 values (Fig. 7), with the only exception being ν13 values at the first displacement step (p = 0.38). For ν12 and ν13, the large NoAg values of ~1.5–3.0 decreased to ~1.0 for LoAg samples and to values near the level of incompressible materials (0.5) for HiAg (Fig. 7). Paired t tests between ν12 and ν13 within each gel type showed no significant differences, indicating that lateral contraction of the sample occurred to a similar degree in both the 2- and 3-directions.
FIGURE 7.
NoAg samples exhibit large apparent Poisson’s ratios (defined in text) in both width and thickness planes (ν12 and ν13, respectively), that are significantly smaller for LoAg and HiAg; values for HiAg demonstrate near-incompressible (≅0.5) behavior (mean ± 95% CI; n = 6–8/group; * significant differences).
Polarized light imaging data for a representative NoAg sample show the analyzed region and collagen fiber alignment maps at zero displacement, as well as immediately after the 10 and 20% displacement steps (Fig. 8a). The lines on each alignment map represent the average orientation angle of the collagen fibers in that region of tissue; line lengths, as well as the underlying gray-scale pixel intensity values, indicate average retardation or strength of alignment. Under uniaxial tension, collagen fibers reoriented to become more aligned in the direction of loading, as indicated by increased retardation values for the alignment map at 20% displacement. Spatially averaged and normalized retardation values show quantitative increases with increased displacement (Fig. 8b), with statistically significant differences measured between gel types for both normalized retardation (at all displacement steps) and change in retardation values (at 15 and 20% displacement) relative to undeformed. Specifically, NoAg samples became more highly aligned, and at an increasingly elevated rate at higher levels of tensile displacement, than agarose-containing samples.
FIGURE 8.
(a) Alignment maps, which represent average fiber orientation and retardation, demonstrate increased alignment at larger tensile displacement (0–20%); group-averaged retardation values (normalized by initial thickness) show increased retardation (b) and change in retardation (c) with decreasing agarose content, indicating stronger alignment for NoAg samples (large retardation = highly aligned; mean ± 95% CI; n = 6–8/group; * significant differences).
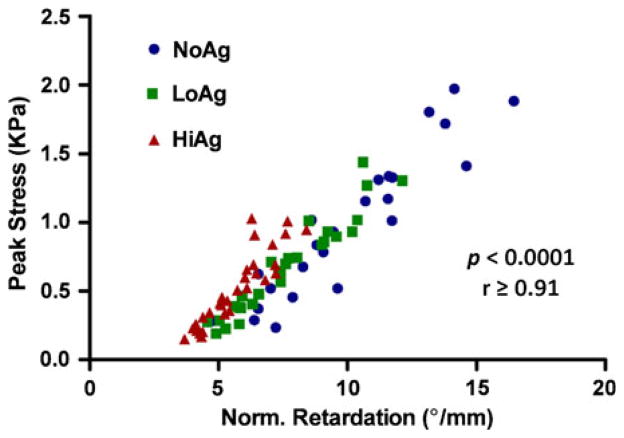
In terms of investigating mechanical-organizational relationships, peak stresses for each gel type were significantly correlated (r ≥ 0.91, p<0.0001) with normalized retardation values (Fig. 9). Interestingly, the slopes of the linear regressions were not different among NoAg, LoAg, and HiAg groups (slopes = 0.20, 0.18, and 0.21, respectively), demonstrating a close relationship between collagen fiber alignment and mechanical response that was independent of the presence/absence of agarose.
FIGURE 9.
For all three gel types, peak stress values are significantly correlated with strength of alignment (represented via normalized retardation).
Collagen fiber kinematics for the NoAg samples were close to affine, as indicated by small range and offset values in the projection plots (Fig. 10). While offset values were also small for agarose-containing samples, larger range values indicate that fiber kinematics became progressively more removed from affine for LoAg and HiAg samples. There were significant differences in range values starting at the second displacement step (Fig. 10a); in contrast, there were no differences between group-averaged offset values (Fig. 10b). Example experimental and affine-predicted angle distributions for NoAg and HiAg samples (Figs. 10c, 10d, respectively) show that the affine model over-predicted the amount of alignment in the loading direction (90°) for NoAg (albeit by a small amount, as evidenced by small range values), but under-predicted experimental alignment for HiAg (to a larger extent, indicated by larger range).
FIGURE 10.
Range and offset values, which are output parameters from quantitative projection plot analysis, indicate how closely experimental collagen fiber orientation data matches with affine predictions based on undeformed fiber distributions: (a) larger range values demonstrate that HiAg samples exhibit less affine behavior than LoAg and NoAg, however (b) offset values are relatively consistent (mean ± 95% CI; n = 6–8/group; * significant differences); interestingly, example histograms at 20% displacement show that for the NoAg samples (c), the affine model tends to over-predict the amount of alignment in the loading direction (90°), while in the HiAg samples (d) the affine model consistently under-predicts experimental alignment.
DISCUSSION
In this study, collagen-agarose co-gels were fabricated and examined as a model system to evaluate qualitatively and quantitatively the interactions between the collagen network and non-fibrillar matrix. In the co-gels, scanning electron micrographs reveal a web-like agarose matrix that interpenetrates the collagen fiber network (Fig. 2). Co-gel morphology appears similar to that reported in a previous study,33 with some differences in collagen/agarose ratio due to a higher collagen concentration in the current study (1 vs. 0.5 mg/mL). Importantly, the addition of agarose does not appear to alter the formation or structural topology of the collagen fiber network in our tissue analogs, which is consistent with a study that reported no change in the rate of collagen molecular assembly when agarose was added to collagen gels.22 In addition, the presence of collagen did not impede agarose gelation: the appearance of the agarose matrix in co-gel samples appears very similar to agarose-only gels (Fig. 2). Thus, agarose was successfully introduced in type I collagen gels as an artificial non-fibrillar component without disrupting the fiber network of our collagen gel tissue analogs.
The mechanical response of collagen-agarose co-gels in uniaxial tension varied significantly with agarose concentration. Collagen-only gels (NoAg) exhibited large volume changes under tensile loading (evidenced by high Poisson’s ratios, Fig. 7), corresponding with significant increases in strength of collagen fiber alignment (Fig. 8) as lateral compaction occurred. As a result, the reorganized fiber networks were highly aligned in the loading direction and provided greater mechanical resistance in terms of peak load/stress (Figs. 3a, 5a). With no agarose matrix to interfere, microstructural reorganization of collagen in NoAg samples occurred quickly, indicated by fast relaxation rates (Fig. 4), and to a large extent, indicated by low equilibrium loads (Fig. 3b) and high amounts of total relaxation (Fig. 3c). In contrast, the agarose-containing LoAg gels and, to a larger degree, HiAg gels, were much more resistant to volume change. In fact, the HiAg samples exhibited Poisson’s ratios comparable to an incompressible material (Fig. 7). This resistance to volume change corresponded with less microstructural reorganization of the collagen network (i.e., smaller retardation values; Fig. 8). Since retardation values correlated significantly with mechanical response at peak displacement (Fig. 9), co-gels exhibited smaller peak load/stress values compared to NoAg gels (Figs. 3a, 5a). Resistance to structural reorganization in the co-gels meant that load was not dissipated as quickly or as much, indicated by slower relaxation rates (Fig. 4), larger equilibrium load values (Fig. 3b), and less total relaxation (Fig. 3c). Differences in viscoelasticity between gel groups were quantified via the parameter values of the two-relaxation-time solid linear model (Fig. 6). The largest differences in elastic and viscous parameters were for and τ2, respectively, demonstrating that there were larger differences in the magnitude of at early time points, but greater differences in how dissipated at later time points. In addition, the need to incorporate two Maxwell elements (with corresponding viscosity coefficients) in order to fit the experimental data suggests different relaxation behavior on at least two time scales. The differences in viscoelastic behavior observed in this study, specifically an increase in the viscous mechanical response for co-gels, may be due to increased resistance to interstitial fluid flow through the collagen-agarose network, thereby decreasing the speed at which the sample can respond to a step displacement. Taken together, the results presented here demonstrate that the incorporation of agarose led to concentration-dependent changes in the elastic and viscoelastic mechanical response, and structural reorganization under load in tissue analogs under uniaxial tension.
In a previous study, Ulrich et al.33 hypothesized that agarose would reduce the mesh size of the co-gel network and restrict movement of collagen fibers. Results of the present study support this hypothesis. Specifically, the interfusing web-like agarose matrix of the co-gels may increase binding to water and/or decrease permeability to fluid flow, thereby resisting volume loss. Also, smaller retardation values for LoAg and HiAg correspond to a less highly aligned collagen network, which may be due to a decrease in collagen fiber mobility. Examining collagen fiber kinematics further, one interesting observation by Ulrich et al. was an apparent transition from non-affine fiber deformation for collagen-only gels, where loads were dissipated locally by bending and sliding of individual collagen fibers, to more affine behavior consistent with a continuum network when agarose was incorporated. In our study, results indicate less affine fiber kinematics for HiAg samples compared to LoAg and, to a greater degree, NoAg samples (Fig. 10). Importantly, there are large differences in how these assessments of fiber kinematics were made: the previous study qualitatively examined the local deformation of collagen fibers under cell-exerted forces on the μm-scale, while the current study evaluated quantitative polarized light measurements of average fiber orientations over a large area of the sample under macroscale tissue deformation on the cm-scale. An inherently important aspect of any technique for assessing fiber kinematics is length-scale of observation, since this evaluation is by definition a comparison of deformation at two different length-scales (i.e., bulk tissue and local fiber). Besides possible effects due to differences in gel composition (e.g., acellular vs. cellular, different collagen concentration), apparent discrepancies between these studies in terms of fiber kinematics likely reflect the nature of the assessment approaches and the length-scale over which they were evaluated. Previous theoretical results obtained in our laboratory5 support this notion: while individual fibril kinematics in collagen gels were non-affine (in terms of fibril stretch and rotation), measures of average fibril orientation (such as those obtained via QPLI analysis) were consistent with affine behavior. Thus, apparent discrepancies in the observations of fiber kinematics in collagen-agarose co-gels are likely due to differences in comparing distributions of overall (average) orientation in the current study, in contrast to observations of individual fibril behavior by Ulrich et al. In both cases, agarose appears to progressively restrict the mobility of collagen fibers as the tissue is loaded. An interesting aspect of the current study is that the nature of the disagreement between experimental data and affine predictions was different for NoAg and HiAg samples. Specifically, for the NoAg gels, the affine model tended to over-predict the number of fibers aligned in the loading direction (Fig. 10c) and to under-predict experimentally measured alignment in the HiAg gels (Fig. 10d). Thus, with the very large lateral compaction in the NoAg gels, fibers didn’t become as uniformly oriented as predicted, while with the very small lateral compaction of the HiAg gels, fibers actually became more aligned than predicted. These differences may be due to complex collagen-agarose interactions at the microscale, including the possibility of independent movement of collagen fibers relative to agarose matrix. Future experimental evaluation and computational modeling will explore these mechanisms further.
The objective of this study was to evaluate the collagen- agarose co-gel as a simplified model system in order to gain insight into relationships between tissue constituents. Similar to the co-gels in this study, there are many native tissues in which a network of collagen is embedded in a non-fibrillar extracellular matrix. For example, tendons and ligaments are composite materials composed primarily of type I collagen functioning in a hydrated extracellular matrix containing minor collagens, proteoglycans, and cells. While the composition and structure of such native tissues are more complex than co-gel tissue analogs, results of this study can still provide interesting insight into native tissue properties. The average apparent Poisson’s ratio values for the co-gels ranged from 0.5 to ~3 (Fig. 7), indicating a wide range in amount of volume change under tensile load. Similarly, reported average values of Poisson’s ratio for tendon and ligament tested in uniaxial tension range from 0.8 to 2.98.6,11,15,20 While a recent study using a micromechanical model suggested that such variation in Poisson’s ratio might be due to changes in helical fibril organization and collagen fiber crimp,25 our results suggest that the presence and quantity of non-fibrillar material may also have a role in altering lateral compaction and volume loss for such tissues. It is likely that such behavior is not due exclusively to either microstructural organization or non-fibrillar material, but instead that both of these, and potentially other factors contribute.
The collagen fiber kinematics of the co-gels in this study also provide insight to native tissue behavior. While the validity of the affine assumption in collagenous soft tissues has only recently begun to be evaluated in depth, several studies have reported non-affine fiber kinematics of biological tissues under tensile loading.2,8,10,16 In these studies, the proximity of the experimentally measured kinematics to the affine assumption was affected by relative degree of initial fiber alignment, orientation of test (i.e., parallel or perpendicular to the predominant fiber direction), level of degeneration and, more generally, by the type of tissue. Here, we suggest that the non-fibrillar matrix is another factor that affects the reorientation of collagen fibers under load. Specifically, the ability of the collagen fibers to rotate in agreement with the global tissue deformation is modulated by local interactions with the surrounding non-fibrillar material and its corresponding resistance to fluid flow and volume change.
In the context of applying the results of this study to understanding better native tissues, it is useful to consider the relative quantities of the collagen fiber network and the non-fibrillar matrix in the collagen-agarose co-gels and in native tissues. Within orthopedic soft tissues, for example, typical tendons and ligaments contain ~60–70% (dry weight) type I collagen, with the remaining ~30–40% composed of non-fibrillar material including proteoglycans, glycoproteins, elastin, minor collagens, and cells.18,35 Other tissues contain larger quantities of non-collagenous material such that the total percentage of fibrillar collagen is smaller, such as ~50% for articular cartilage and annulus fibrosus, and levels as low as ~10% for nucleus pulposus.3,38 In comparison, of the total solid content, our co-gels contained ~100% (NoAg), ~50% (LoAg), and ~30% (HiAg) collagen by dry weight, with agarose contributing the remaining material as a representation of all nonfibrillar matrix.
This study is not without limitations. First, the optical properties of agarose relevant to our polarized light imaging technique (i.e., birefringence) are not fully known. The presence of agarose in the co-gels may alter QPLI measurements, however, preliminary evaluation of 0.25% w/v agarose-only gels yielded very low retardation values that increased negligibly as a function of strain (~5° retardation for agarose-only vs. ~30° for a similarly loaded collagen-only gel at 10% tensile strain). Therefore, it is likely that polarized light measures are due predominantly to collagen. Second, while the results presented in this study were restricted to behavior under uniaxial extension, tissues are often subjected to a much wider range of loading scenarios in vivo. Future work will explore other loading configurations in which non-fibrillar material is likely to contribute directly to the mechanical response (e.g., indentation, shear).
CONCLUSIONS
In this study, a collagen-agarose co-gel model system was used to investigate the mechanical role of non-fibrillar matrix and to examine interactions between tissue constituents in uniaxial tension. Although the incorporation of agarose into co-gels did not dramatically alter the formation or morphology of the collagen network, agarose led to concentration-dependent changes in the mechanical and structural response: the resistance of co-gels to volume change corresponded with large differences in fiber reorientation and elastic/viscoelastic mechanical behavior under incremental stress-relaxation. Results of this study demonstrate strong relationships between compositional, organizational, and mechanical properties of tissue analogs. While not intended to represent a specific constituent of native tissues, the changes due to the addition of agarose in this study suggest that non-fibrillar material may have significant effects on soft tissue properties and behavior in artificial and native tissues even in tension, which is generally assumed to be collagen dominated.
Acknowledgments
The authors thank Victor Lai, Xiao Zhong, and Sadie Doggett for help with SEM acquisition, mechanical testing, and data analysis, respectively. We gratefully acknowledge the financial support of NIH Grants R01-EB005813 and F32-EB012352, and the NSF’s support of the University of Minnesota’s Characterization Facility.
Footnotes
CONFLICT OF INTEREST
No benefits in any form have been or will be received from a commercial party related directly or indirectly to the subject of this manuscript.
References
- 1.Batorsky A, et al. Encapsulation of adult human mesenchymal stem cells within collagen-agarose microenvironments. Biotechnol Bioeng. 2005;92(4):492–500. doi: 10.1002/bit.20614. [DOI] [PubMed] [Google Scholar]
- 2.Billiar KL, Sacks MS. A method to quantify the fiber kinematics of planar tissues under biaxial stretch. J Biomech. 1997;30(7):753–756. doi: 10.1016/s0021-9290(97)00019-5. [DOI] [PubMed] [Google Scholar]
- 3.Buckwalter JA. Musculoskeletal soft tissues. In: Baratz M, Watson AD, Imbriglia JE, editors. Orthopaedic Surgery: The Essentials. New York, NY: Thieme; 1999. [Google Scholar]
- 4.Chandran PL, V, Barocas H. Microstructural mechanics of collagen gels in confined compression: poroelasticity, viscoelasticity, and collapse. J Biomech Eng. 2004;126(2):152–166. doi: 10.1115/1.1688774. [DOI] [PubMed] [Google Scholar]
- 5.Chandran PL, V, Barocas H. Affine versus non-affine fibril kinematics in collagen networks: theoretical studies of network behavior. J Biomech Eng. 2006;128(2):259–270. doi: 10.1115/1.2165699. [DOI] [PubMed] [Google Scholar]
- 6.Cheng VWT, Screen HRC. The micro-structural strain response of tendon. J Mater Sci. 2007;42(21):8957–8965. [Google Scholar]
- 7.Elliott DM, Setton LA. A linear material model for fiber-induced anisotropy of the anulus fibrosus. J Biomech Eng. 2000;122(2):173–179. doi: 10.1115/1.429639. [DOI] [PubMed] [Google Scholar]
- 8.Gilbert TW, et al. Fiber kinematics of small intestinal submucosa under biaxial and uniaxial stretch. J Biomech Eng. 2006;128(6):890–898. doi: 10.1115/1.2354200. [DOI] [PubMed] [Google Scholar]
- 9.Guerin HA, Elliott DM. The role of fiber-matrix interactions in a nonlinear fiber-reinforced strain energy model of tendon. J Biomech Eng. 2005;127(2):345–350. doi: 10.1115/1.1865212. [DOI] [PubMed] [Google Scholar]
- 10.Guerin HA, Elliott DM. Degeneration affects the fiber reorientation of human annulus fibrosus under tensile load. J Biomech. 2006;39(8):1410–1418. doi: 10.1016/j.jbiomech.2005.04.007. [DOI] [PubMed] [Google Scholar]
- 11.Hewitt J, et al. Regional material properties of the human hip joint capsule ligaments. J Orthop Res. 2001;19(3):359–364. doi: 10.1016/S0736-0266(00)00035-8. [DOI] [PubMed] [Google Scholar]
- 12.Jones CP. Living beyond our “means”: new methods for comparing distributions. Am J Epidemiol. 1997;146(12):1056–1066. doi: 10.1093/oxfordjournals.aje.a009234. [DOI] [PubMed] [Google Scholar]
- 13.Knapp D, et al. Rheology of reconstituted type I collagen gel in confined compression. J Rheol. 1997;41:971. [Google Scholar]
- 14.Krishnan L, et al. Design and application of a test system for viscoelastic characterization of collagen gels. Tissue Eng. 2004;10(1–2):241–252. doi: 10.1089/107632704322791880. [DOI] [PubMed] [Google Scholar]
- 15.Lake SP. Anisotropic, Inhomogeneous and Nonlinear Structure-Function of Human Supraspinatus Tendon. Department of Bioengineering, University of Pennsylvania; Philadelphia, PA: 2009. [Google Scholar]
- 16.Lake SP, et al. Evaluation of affine fiber kinematics in human supraspinatus tendon using quantitative projection plot analysis. Biomech Model Mechanobiol. 2011 doi: 10.1007/s10237-011-0303-5. in press. [DOI] [PMC free article] [PubMed] [Google Scholar]
- 17.Lanir Y. A structural theory for the homogeneous biaxial stress-strain relationships in flat collagenous tissues. J Biomech. 1979;12(6):423–436. doi: 10.1016/0021-9290(79)90027-7. [DOI] [PubMed] [Google Scholar]
- 18.Laurencin CT, et al. Tissue engineering: orthopedic applications. Annu Rev Biomed Eng. 1999;1:19–46. doi: 10.1146/annurev.bioeng.1.1.19. [DOI] [PubMed] [Google Scholar]
- 19.Lund AW, et al. Osteogenic differentiation of mesenchymal stem cells in defined protein beads. J Biomed Mater Res B. 2008;87(1):213–221. doi: 10.1002/jbm.b.31098. [DOI] [PMC free article] [PubMed] [Google Scholar]
- 20.Lynch HA, et al. Effect of fiber orientation and strain rate on the nonlinear uniaxial tensile material properties of tendon. J Biomech Eng. 2003;125(5):726–731. doi: 10.1115/1.1614819. [DOI] [PubMed] [Google Scholar]
- 21.Malvern LE. Introduction to the Mechanics of a Continuous Medium. Englewood Cliffs, NJ: Prentice-Hall; 1969. [Google Scholar]
- 22.Nomura Y, Ishii Y, Takahashi K. Control of collagen molecular assembly with anionic polysaccharides. Biosci Biotechnol Biochem. 2009;73(4):926–929. doi: 10.1271/bbb.80576. [DOI] [PubMed] [Google Scholar]
- 23.Normand V, et al. New insight into agarose gel mechanical properties. Biomacromolecules. 2001;1(4):730–738. doi: 10.1021/bm005583j. [DOI] [PubMed] [Google Scholar]
- 24.O’Connell GD, Guerin HL, Elliott DM. Theoretical and uniaxial experimental evaluation of human annulus fibrosus degeneration. J Biomech Eng. 2009;131(11):111007. doi: 10.1115/1.3212104. [DOI] [PMC free article] [PubMed] [Google Scholar]
- 25.Reese SP, Maas SA, Weiss JA. Micromechanical models of helical superstructures in ligament and tendon fibers predict large poisson’s ratios. J Biomech. 2010;43(7):1394–1400. doi: 10.1016/j.jbiomech.2010.01.004. [DOI] [PMC free article] [PubMed] [Google Scholar]
- 26.Roeder BA, et al. Tensile mechanical properties of three-dimensional type I collagen extracellular matrices with varied microstructure. J Biomech Eng. 2002;124(2):214–222. doi: 10.1115/1.1449904. [DOI] [PubMed] [Google Scholar]
- 27.Schwartz MH, Leo PH, Lewis JL. A micro-structural model for the elastic response of articular cartilage. J Biomech. 1994;27(7):865–873. doi: 10.1016/0021-9290(94)90259-3. [DOI] [PubMed] [Google Scholar]
- 28.Shirazi R, Shirazi-Adl A. Deep vertical collagen fibrils play a significant role in mechanics of articular cartilage. J Orthop Res. 2008;26(5):608–615. doi: 10.1002/jor.20537. [DOI] [PubMed] [Google Scholar]
- 29.Stylianopoulos T, V, Barocas H. Multiscale, structure- based modeling for the elastic mechanical behavior of arterial walls. J Biomech Eng. 2007;129(4):611–618. doi: 10.1115/1.2746387. [DOI] [PubMed] [Google Scholar]
- 30.Stylianopoulos T, V, Barocas H. Volume-averaging theory for the study of the mechanics of collagen networks. Comput Methods Biomech Biomed Eng. 2007;196(31–32):2981–2990. [Google Scholar]
- 31.Thomopoulos S, Fomovsky GM, Holmes JW. The development of structural and mechanical anisotropy in fibroblast populated collagen gels. J Biomech Eng. 2005;127(5):742–750. doi: 10.1115/1.1992525. [DOI] [PubMed] [Google Scholar]
- 32.Tower TT, Neidert MR, Tranquillo RT. Fiber alignment imaging during mechanical testing of soft tissues. Ann Biomed Eng. 2002;30(10):1221–1233. doi: 10.1114/1.1527047. [DOI] [PubMed] [Google Scholar]
- 33.Ulrich TA, et al. Probing cellular mechanobiology in three-dimensional culture with collagen-agarose matrices. Biomaterials. 2010;31(7):1875–1884. doi: 10.1016/j.biomaterials.2009.10.047. [DOI] [PubMed] [Google Scholar]
- 34.Wagner DR, Lotz JC. Theoretical model and experimental results for the nonlinear elastic behavior of human annulus fibrosus. J Orthop Res. 2004;22(4):901–909. doi: 10.1016/j.orthres.2003.12.012. [DOI] [PubMed] [Google Scholar]
- 35.Wang JH. Mechanobiology of tendon. J Biomech. 2006;39(9):1563–1582. doi: 10.1016/j.jbiomech.2005.05.011. [DOI] [PubMed] [Google Scholar]
- 36.Weiss JA, Maker BN, Govindjee S. Finite element implementation of incompressible, transversely isotropic hyperelasticity. Comput Methods Biomech Biomed Eng. 1996;135:107–128. [Google Scholar]
- 37.Wood GC, Keech MK. The formation of fibrils from collagen solutions. 1. The effect of experimental conditions: kinetic and electron-microscope studies. Bio-chem J. 1960;75:588–598. doi: 10.1042/bj0750588. [DOI] [PMC free article] [PubMed] [Google Scholar]
- 38.Yeh G, Esterhai JL. Orthopaedics. In: Kreisal D, Krupnick AS, Kaiser LR, editors. The Surgical Review: An Integrated Basic and Clinical Science Guide. Philadelphia, PA: Lippincott Williams and Wilkins; 2000. [Google Scholar]


