Abstract
Real-time detection of pre-atherosclerotic regions remains an unmet clinical challenge. We previously demonstrated the application of micro-electro-mechanical systems (MEMS) to detect changes in convective heat transfer in terms of sensor output voltages in the zone of flow reversal in an in vitro stenotic model. We hereby demonstrated changes in sensor output voltages in the pre-atherosclerotic regions in the New Zealand White rabbits fed on hypercholesterolemic diet (HD). After 8 weeks, we observed that mean output voltages (Vave) were similar in the distal aortic arch, thoracic, and abdominal aortas in the normal standard diet (ND) group, consistent with an absence of atherosclerosis. In HD group, Vave increased in the distal aortic arch (HD: Vave = 1.05 ± 0.04 V; ND: Vave = 0.12 ± 0.01 V, n = 3, p<0.05) and in the thoracic aortas (HD: Vave = 0.72 ± 0.06 V; ND: Vave = 0.13 ± 0.024 V, n = 3, p<0.05), consistent with the histological presence of pre-atherosclerosis. Despite HD diet, Vave magnitudes were similar to ND group in the abdominal aortas (HD: Vave = 0.14 ± 0.003 V; ND: Vave = 0.14 ± 0.004 V, n = 3), corroborating histological absence of pre-atherosclerosis. Hence, MEMS thermal sensors provide a new approach to detect changes in convective heat transfer in the pre-atherosclerotic regions.
Keywords: MEMS, Atherosclerosis, Heat transfer, Disturbed flow, Shear stress
INTRODUCTION
Mounting evidence supports that hemodynamics, namely, fluid shear stress, is intimately involved in vascular oxidative stress,24 inflammatory responses, and atherosclerosis.7,10,26,34 In the athero-prone regions, flow separation, and secondary flow develop. In response to cardiac contraction, the migrating stagnation points generate low and oscillating flow, otherwise known as disturbed or secondary flow.11 However, real-time detection of changing flow profiles in the presence of pre-atherosclerotic regions remains a clinical challenge.
Intravascular strategy has emerged to address mechanically unstable plaque. In the arterial regions where flow separation develops, low and oscillatory wall shear stress predict the progression of atherosclerosis, 30 vessel wall remodeling,9 and development of abdominal aortic aneurysm.27,33 The combination of three dimensional intravascular ultrasound (IVUS) images and finite element analysis have been reported to assess plaque size, shape, expansive remodeling, calcification, and lipid core.18 Stone et al. demonstrated integration of IVUS, biplane coronary angiography, and coronary blood flow measurements to elucidate the effects of shear stress on the progression of atherosclerosis, vascular remodeling, and in-stent re-stenosis in humans.21,30 Jaffer et al. further demonstrated intravascular deployment of near-infrared fluorescence catheter to detect proteolytically active atherosclerotic lesions in New Zealand White (NZW) rabbits.19 In our group, we introduced the microelectro- mechanical systems (MEMS) thermal sensors to provide high spatial (1/10th of a string of hair) and temporal resolution (kHz)2,3,36 that enables us to link shear stress with pre-atherosclerotic lesions.
The operational principle of the MEMS sensors is based on convective cooling of a heated sensing element as fluid flows over the sensing element surface. The heat transfer from the heated surface to the fluid depends on the flow characteristics in the viscous region of the boundary layer.12 In response to instantaneous fluctuation in temperature, the heat dissipation from the sensors to the blood flow alters the resistance of the sensing elements, from which voltage changes are acquired.15 Using a stenotic model, we reported that the MEMS sensors detected changes in convective heat transfer in the throat of stenosis and regions of flow reversal.4
To demonstrate changes in convective heat transfer in the pre-atherosclerotic regions, we compared intravascular voltage (IVV) between the NZW rabbits fed on high-fat/cholesterol (HD) and normal standard diets (ND). The MEMS thermal sensors detected significant changes in mean output voltage (Vave) and its time-varying component (δV/δt) in the pre-atherosclerotic regions that harbored active lipids and macrophages. Hence, the heat transfer strategy provides an entry point to link shear stress with pre-atherosclerotic regions.
EXPERIMENTAL DESIGNS AND METHODS
Experimental Protocol
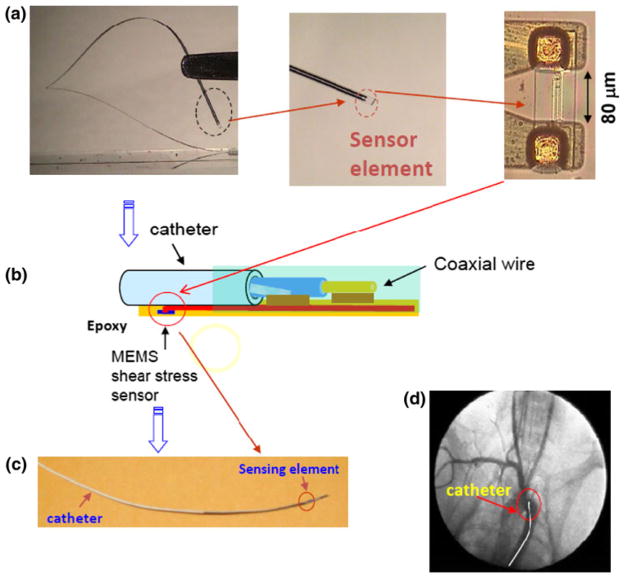
Age-matched adult male NZW rabbits were catheterized for IVV measurements via a femoral cut-down procedure after 8 weeks of high-fat and high-cholesterol diet (Newco® 1.5% cholesterol and 6% peanut oil). The use of 3-D fluoroscope (Phillips BV-22HQ C-arm) enabled real-time visualization of the catheter, coaxial wire, and MEMS thermal sensors in the aortas. Contrast dye injection through the carotid arteries demarcated the vessel diameters and sensor positions (Fig. 1d). IVV measurements were acquired in the distal aortic arch, followed by thoracic, and abdominal regions. Doppler ultrasound was used to obtain pulsatile velocity in the abdominal aorta for the computational fluid dynamics (CFD) boundary conditions. Instantaneous IVV tracings were compared between the animals on normal and high-fat diets. This protocol was approved by the USC Institutional Animal Care and Use Committee.
FIGURE 1.
The MEMS sensors. (a) The sensor was flexible. The dotted circle at the terminal end of sensor was magnified to reveal the polymer-coated sensing element. (b) The schematic diagram detailed the packaging of the polymer sensor to the coaxial wire. The sensor was connected to the electrical coaxial wire with conductive epoxy and covered with biocompatible epoxy. The distance between the sensing element and the tip of the catheter was 4 cm. (c) Illustration revealed a packaged sensor to the coaxial wire. (d) Angiogram enabled visualization of the catheter position.
Operation of the MEMS Thermal Sensors
The operational principle and fabrication process of the MEMS thermal sensors were previously described.36 Briefly, titanium (Ti) and platinum (Pt) were deposited on silicon wafers and patterned to form the sensing elements. The diameter of the coaxial wire was 0.4 mm and the sensing element was measured at 2 μm in width and 80 μm in span wise length (Fig. 1). The biocompatible epoxy (EPO-TEK 301: Epoxy Technology, MA) was used to anchor the sensor to the coaxial wire. Constant temperature (CT) mode was used to acquire real-time voltage signals.28 The CT circuit contained a feedback loop to maintain voltage across the sensing element, and was monitored by a LabVIEW-based data acquisition system at a sampling rate of 800 Hz.2,36 Calibration was performed in a 2-D flow channel for individual sensors and a relationship between heat loss and changes in output voltage over a range of flow rates was derived at 37.8 °C.3 The viscosity of the blood as a function of shear rate was obtained using a viscometer (Brookfield Engineering, Newhall, CA). Next, the MEMS sensors were deployed into the rabbit aortas for IVV measurements. Signal processing, wavelet decomposition, and low-pass filters were applied to minimize the background noise.31 The average signal-to-noise ratio (SNR) was approximately 4 in the rabbit aorta.
Protocol for NZW Rabbits
Six male rabbits (mean body weight 2.52 ± 0.30 kg) were acquired from a local breeder (Irish Farms, Norco, CA) and maintained by the Heart Institute of the Good Samaritan Hospital in Los Angeles. Prior to catheterization, the rabbits were anesthetized with an intramuscular injection of 50 mg/kg ketamine (Fort Dodge Laboratories, Inc) combined with Xylazine 10 mg/kg, with additional anesthesia given as required. A 23 gauge hypodermic needle and a 26 gauge guide wire were introduced into the left femoral artery via a cut-down. A rabbit femoral catheter (0.023″ID × 0.038″OD) was passed through the left femoral artery. The individual animals were heparinized (100 U/kg) prior to catheterization.
Immunohistochemistry
After IVV measurements, en face aortas were isolated for gross pathology, followed by immersion in 4% paraformaldehyde for 24 h. Vascular rings were frozen for histological analysis. Serial 5-μm cryosections of rabbit atheromas were cut (Sakura Finetek, Torrance, CA). Regions corresponding to the 3-D fluoroscope images were isolated, embedded, and sectioned. Next, immunostaining was performed with standard techniques in frozen vascular tissue using biotinylated secondary antibodies and peroxidase staining. Diaminobenzidine (DAB) was used as a chromogen and the sections were counterstained with hematoxylin for visualization of intima, media, smooth muscle cells, and adventitia. Atheromas, macrophages, or foam cells, were identified (Leica, DM LB2 microscope, Germany) and captured with a CCD digital camera (Spot RT-KE, Diagnostic Instruments, MI). Foam cells will be identified by Sudan black stain, lipids with oil-red-O,13,35 macrophages with anti-CD68 antibody, and oxLDL with mAb4E6.14
CFD
Three dimensional CFD code was developed for non-Newtonian fluid to simulate shear stress in the eccentric stenotic model.3 The average diameter of the rabbit abdominal aortas, Dave = 2.4 mm, was measured during catheterization. The non-Newtonian blood flow was simulated using the 3-D Navier–Stokes equations. The governing equations, including mass and momentum equations, were solved in FLUENT for laminar, incompressible, and non-Newtonian flow. The CFD solutions for the 3-D eccentric stenotic model in the presence and absence of catheter were previously reported.4 Briefly, the CFD model was constructed with 2, 410, 112 cells, which were primarily the tetrahedral elements. Fine elements, especially immediately adjacent to the tube wall and in the vicinity of the stenosis, were constructed to obtain sufficient information to characterize the large fluid velocity gradients near the wall. This approach guaranteed the mesh-independence of the numerical results. The simulations were performed under three steady state flow rates, namely, 50, 100, and 150 mL/min. The second order formulation of the solver was applied for the spatial discretization. The pressure–velocity coupling is based on the SIMPLEC technique.
Statistical Analysis
All values were expressed as means ± SD. For statistical comparisons of IVV measurements and temporal gradients, we used a paired t test with values of p<0.05 considered as significant. Comparisons of multiple mean values were performed by one-way analysis of variance (ANOVA), and statistical significance among multiple groups was determined using the Tukey procedure.
RESULTS
CFD Simulation of the 3-D Eccentric Stenotic Model
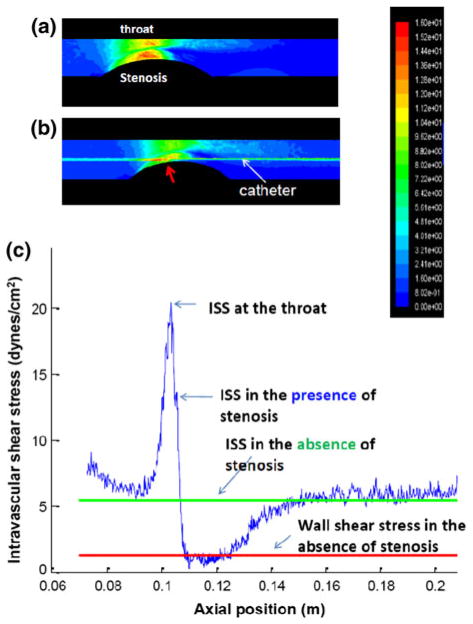
At a steady state of 150 mL/min, the wall shear stress profiles peaked in the throat, and reached a nadir in the zone of flow reversal (Fig. 2a). Intravascular shear stress (ISS) on the catheter along the axial position also peaked in the throat, and reached a nadir in the zone of flow reversal (Fig. 2b). The representative shear stress profiles along the catheter in the presence and absence of an eccentric stenosis further elucidated the transition of the ISS magnitudes from the throat to the region of flow reversal (Fig. 2c). ISS in the absence of stenosis was illustrated as a steady horizontal line. Hence, CFD simulation provided a spectrum of ISS magnitudes for which intravascular assessment of convective heat transfer could be established in the fat-fed NZW rabbits.
FIGURE 2.
A representative CFD simulation for the 3-D eccentric stenotic model at a steady flow rate of 150 mL/min. (a) The wall shear stress profiles reveal the highest magnitude alone the throat corresponding to the region of highest mean velocity, and lowest magnitude in the zone of flow reversal. (b) Intravascular shear stress (ISS) on the catheter along the axial position peaks in the throat, and reached a nadir in the zone of flow reversal. (c) The representative shear stress profiles along the catheter in the presence and absence of an eccentric stenosis are compared. The blue curve denotes changes in intravascular shear stress (ISS) on the catheter along the axial position in the presence of an eccentric stenosis, and the green in the absence of stenosis. The red line represents the wall shear stress in the absence of stenosis.
MEMS Sensors to Assess Convective Heat Transfer
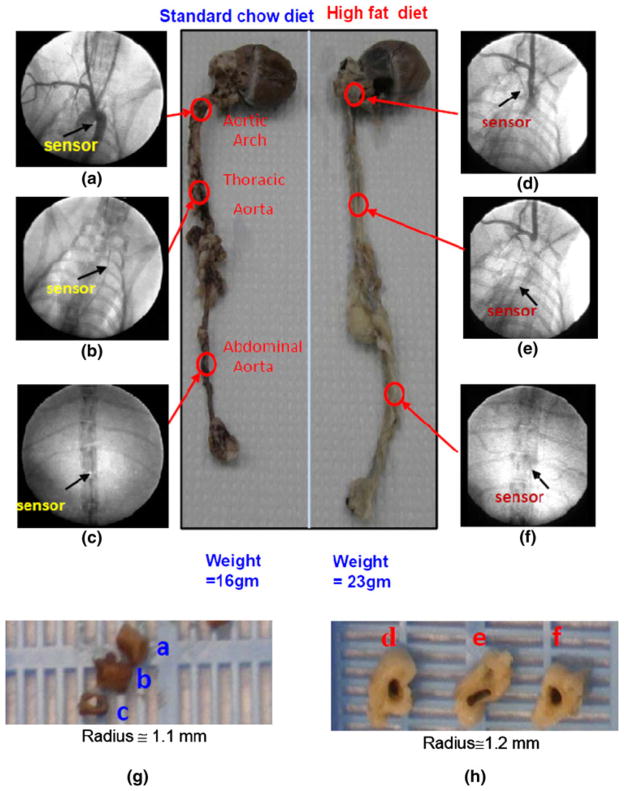
Under fluoroscope, angiograms coupled with contrast dye enabled visualization of aortas and positions of the sensors (Figs. 3a–3f). Specifically, contrast dye delineated the contour of aortic arch, innominate, and carotid arteries, allowing for comparison of the sensor positions between the normal standard and high-fat diets groups. Fluoroscope also revealed the coaxial wire in the thoracic and abdominal aortas in relation to adjacent anatomic structures. The en face segments of aortas further provided comparison of endoluminal pathology after 8 weeks of ND vs. HD diets (Figs. 3g, 3h). Taken together, integrating CFD simulation, fluoroscopic images, and gross pathology allowed for assessment of convective heat transfer in terms of intravascular output voltages (IVV) in response to ND vs. HD diets.
FIGURE 3.
Angiograms and segments of aortas isolated from adult rabbits on 8 weeks of normal standard vs. high-fat/high-cholesterol diet. (a) Contrast dye delineated the contour of aortic arch, innominate, and carotid arteries. Arrow indicated the positioning of the MEMS sensor downstream from the aortic arch. (b) Fluoroscope revealed the coaxial wire deployed to the thoracic aorta. Arrow indicated the position of the sensor in relation to the ribs and cardiac silhouette. (c) Coaxial wire was in the abdominal aorta. (d) The sensor position in the fat-fed rabbits that developed myocardial hypertrophy, vessel wall remodeling, and atherosclerotic plaques as evidenced by greater size (radius, R) and weights in abdominal aortas, left ventricles, and aortic arches. (e) Fluoroscope coupled with contrast dye revealing the position of the sensor in the thoracic aorta. (f) The sensor was positioned in the abdominal aorta. (g) A set of en face segments corresponded to the position of the sensors in (a–c). Gross pathology revealed no atherosclerotic lesions. (h) A set of en face segments corresponded to the position of sensors in (d–f). Pre-atherosclerotic lesions were present in the distal aortic arch and thoracic aorta, but absent in the abdominal aortas.
Changes in IVV
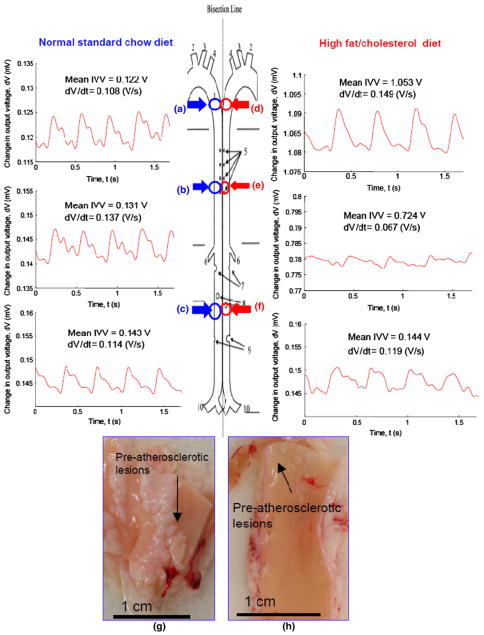
IVV measurements in the rabbit aortas on ND vs. HD diets were compared (Fig. 4). The mean heart rate was 164 ± 14 beats per minute (bpm) for the ND group, and 157 ± 18 bpm for the HD group. In the ND group, the mean IVV magnitudes were within a similar range (distal aortic arch = 0.12 ± 0.01 V, thoracic aorta = 0.13 ± 0.024 V, and abdominal aorta = 0.14 ± 0.004 V, n = 3, p>0.05) (Figs. 4a–4c), and the corresponding temporal gradients (δV/δt) were 0.12 ± 0.03, 0.14 ± 0.02, and 0.11 ± 0.02 V/s, respectively (n = 3, p>0.05). In the HD animals, the mean IVV magnitudes were distinct (distal aortic arch = 1.05 ± 0.04 V, thoracic aorta = 0.72 ± 0.06 V, abdominal aorta = 0.14 ± 0.003 V, n = 3, p<0.05) (Figs. 4d–4f), and the corresponding temporal gradients (δV/δt) were 0.15 ± 0.01, 0.07 ± 0.01, and 0.12 ± 0.01 V/s, respectively (n = 3, p<0.05). En face segments of distal aortic arch and thoracic aorta revealed pre-atherosclerotic lesions in the HD group. In the absence of pre-atherosclerotic lesions, the mean IVV magnitudes and δV/δt gradients in the abdominal aortas were similar between the two groups. Hence, changes in IVV magnitudes provided information to the micro-hemodynamics in the pre-atherosclerotic regions.
FIGURE 4.
Intravascular voltage (IVV) signals in the rabbit aortas on normal standard (ND) vs. high-fat (HD) diets. (a–c) Representative intravascular voltage (IVV) profiles were acquired in the distal aortic arch, thoracic aorta, and abdominal aorta on ND. (d–f) Representative IVV profiles were acquired in the HD group. (g, h) Gross pathology revealed pre-atherosclerotic lesions in both distal aortic arch and thoracic aortas from the HD group.
Immunohistochemistry
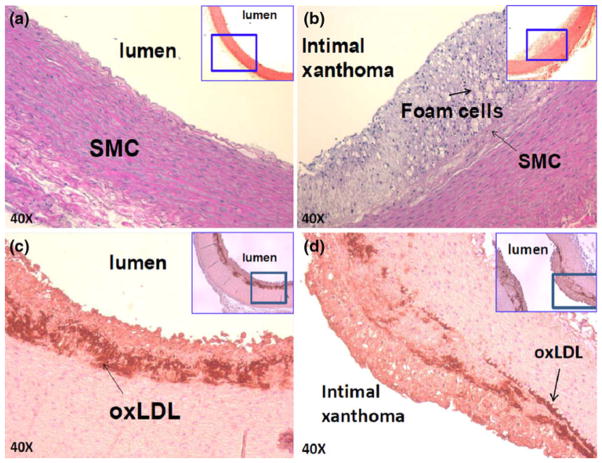
Oxidative products, such as oxidized low density lipoprotein (oxLDL) and foam cells, play a key role in the initiation of atherosclerosis. However, direct in vivo evidence elucidating their link with atherogenic hemodynamics has recently become recognized.1,16,17 Elevated mean IVV signals accompanied by varying δV/δt gradients were evident in the distal aortic arch and thoracic arterial wall in which hematoxylin and eosin (H&E) staining revealed pre-atherosclerotic lesions; namely, intimal thickening, foam cell infiltration, and varying degrees of smooth muscle cells (Figs. 5b–5d). Despite oxLDL and foam cell infiltrates, these lesions were considered clinically silent, and were previously reported to impart insignificant changes in the Thrombolysis in Myocardial Infarction (TIMI) flow by the conventional angiogram. However, the heat transfer strategy enabled detection of local micro-hemodynamics in the pre-atherosclerotic regions.
FIGURE 5.
Immunostaining of pre-atherosclerotic lesions on ND vs. HD. (a) Aortic arch isolated from the rabbit on ND. (b) Intimal thickening and atheroma were present in the fat-fed rabbits. Macrophage-derived foam cells were identified Sudan black stain, and varying degrees of smooth muscle cells (SMC) were identified by anti-SMC actin. (c, d) Subendothelial layers were stained positive for oxLDL by mAb4E6 antibody.
DISCUSSION
The innovation of this study lies in the convective heat transfer strategy to detect changes in output voltage signals in the non-obstructive, albeit inflammatory, and otherwise considered normal TIMI flow regions. By virtue of its high temporal (7.5 kHz) and spatial resolution (100 μm), the MEMS thermal sensors enabled the detection of stenosis in terms of peak IVV in the throat of the stenosis and nadir in the region of flow reversal (Fig. 2).4 CFD codes further corroborated the peak and nadir in IVV measurements (Fig. 2c).4 Hence, convective heat transfer strategy detects changes in convective heat transfer in the pre-atherosclerotic regions in the fat-fed NZW rabbit model.
Real-time detection of changing flow profiles in the pre-atherosclerotic lesions remains a challenge. We hereby established a heat transfer strategy to detect flow reversal by deploying MEMS thermal sensors into the aorta of fat-fed NZW rabbits. Our findings revealed distinct IVV signals (Vave) accompanied by various temporal gradients (δV/δt) between lesion free and pre-atherosclerotic regions. In the distal aortic arch where flow reversal was prevalent in the pre-atherosclerotic regions, IVV measurements were significantly elevated. Despite geometric variations in the distal aortic arch, thoracic, and abdominal aortas, the IVV magnitudes remained nearly identical in the ND group (without pre-atherosclerotic lesions). Despite differences between ND and HD diets, the IVV magnitudes and δV/δt were similar in the abdominal aortas where atherosclerotic lesions were absent. Hence, the heat transfer strategy offers an entry point to assess micro-hemodynamics in the pre-atherosclerotic regions.
Heat transfer principle has been applied to study flow separation in response to low- vs. high-grade stenosis. Separation of shear layers from the arterial wall leads to a significant loss of viscous force (or a significant decrease in wall shear stress).4 Flow separation also develops in the arterial curvature and branching points.6,22 Helical flow developed lateral to the celiac artery and to the superior mesenteric ostia, accompanied by flow separation on the dorsal wall opposite to the superior mesenteric artery.5 Flow separation and flow recirculation engender disturbed flow or secondary flow, promoting recruitment of inflammatory cells.25 Our previous CFD codes provided insight into the pulsatile flow profiles and viscous secondary flow patterns in the branching points of rabbit abdominal aorta.5 We also showed the feasibility of using the MEMS thermal sensors to characterize regions of eccentric stenosis in an in vitro model.4 The current study demonstrated the capability of the MEMS thermal sensors to detect the pre-atherosclerotic regions by the means of convective heat transfer.
Magnetic resonance imaging20 and computational simulation29 have been used to characterize helical and retrograde secondary flow patterns in the aortic arch and branching points. Both methods revealed secondary motion,29 and flow reversals in the aortic arch and distal arch where turbulence remains localized, transient, and low in intensity.20 Complementary to these studies were the numerical and experimental data supporting the notion that secondary flow promotes heat transfer from the arterial wall to the flow field.8,32 In this context, our convective heat transfer strategy established the feasibility to detect time- and spatial-varying flow fields in the pre-atherosclerotic regions otherwise considered clinically silent during the conventional catheterization.
The MEMS thermal sensors operate on the convective heat transfer principle. Heat convection from the resistively heated element to the flowing fluid is measured as a function of the changes in voltage, from which shear stress can be inferred.23 As shown in Fig. 1, the voltage across the sensing element was significantly elevated in response to the secondary vortex motion that generated high fluid velocities and rapid heat dissipation from the surrounding fluid.8,32 The combination of a decrease in the sensor temperature and an increase in sensor resistance, coupled with an increase in power consumption, led to an increase in the voltage across the sensing element. Overall, detection and characterization of atherosclerotic regions are of utmost importance in the management of patients with suspected unstable atherosclerotic lesions. The heat transfer strategy hereby holds promises to assess changes in intravascular voltage in the non-obstructive, albeit pro-inflammatory regions during angiograms.
Acknowledgments
The authors would like to express their gratitude to Dr. Herbert J. Meiselman from Physiology and Biophysics for his assistance with viscosity measurement. The authors are grateful for the technical support from Sharon L. Hale and Dr. Robert A. Kloner at the Heart Institute of Good Samaritan Hospital. This work was supported by AHA Pre-Doctoral Fellowship 0615063Y (L. A.), NHLBI HL 83015 (T. K. H.), and NHLBI HL091302 (T. K. H.).
References
- 1.Ai L, Rouhanizadeh M, Wu JC, et al. Shear stress influences spatial variations in vascular Mn-SOD expression: implication for LDL nitration. Am J Physiol Cell Physiol. 2008;294(6):C1576–C1585. doi: 10.1152/ajpcell.00518.2007. [DOI] [PMC free article] [PubMed] [Google Scholar]
- 2.Ai L, Yu H, Dai W, et al. Real-time intravascular shear stress in the rabbit abdominal aorta. IEEE Trans Biomed Eng. 2009;56(6):1755–1764. doi: 10.1109/TBME.2009.2013455. [DOI] [PMC free article] [PubMed] [Google Scholar]
- 3.Ai LS, Yu HY, Takabe W, et al. Optimization of intravascular shear stress assessment in vivo. J Biomech. 2009;42(10):1429–1437. doi: 10.1016/j.jbiomech.2009.04.021. [DOI] [PMC free article] [PubMed] [Google Scholar]
- 4.Ai L, Zhang L, Dai W, et al. Real-time assessment of flow reversal in an eccentric arterial stenotic model. J Biomech. 2010;43(14):2678–2683. doi: 10.1016/j.jbiomech.2010.06.021. [DOI] [PMC free article] [PubMed] [Google Scholar]
- 5.Barakat AI, Karino T, Colton CK. Microcine-matographic studies of flow patterns in the excised rabbit aorta and its major branches. Biorheology. 1997;34(3):195–221. doi: 10.1016/S0006-355X(97)00025-5. [DOI] [PubMed] [Google Scholar]
- 6.Berger SA, Jou LD. Flows in stenotic vessels. Annu Rev Fluid Mech. 2000;32:347–382. [Google Scholar]
- 7.Berk BC. Atheroprotective signaling mechanisms activated by steady laminar flow in endothelial cells. Circulation. 2008;117(8):1082–1089. doi: 10.1161/CIRCULATIONAHA.107.720730. [DOI] [PubMed] [Google Scholar]
- 8.Chandratilleke TT, Nursubyakto Numerical prediction of secondary flow and convective heat transfer in externally heated curved rectangular ducts. Int J Therm Sci. 2003;42(2):187–198. [Google Scholar]
- 9.Chatzizisis YS, Jonas M, Coskun AU, et al. Prediction of the localization of high-risk coronary atherosclerotic plaques on the basis of low endothelial shear stress—an intravascular ultrasound and histopathology natural history study. Circulation. 2008;117(8):993–1002. doi: 10.1161/CIRCULATIONAHA.107.695254. [DOI] [PubMed] [Google Scholar]
- 10.Davies PF, Remuzzi A, Gordon EJ, et al. Turbulent fluid shear stress induces vascular endothelial cell turnover in vitro. Proc Naatl Acad Sci USA. 1986;83(21):2114–2117. doi: 10.1073/pnas.83.7.2114. [DOI] [PMC free article] [PubMed] [Google Scholar]
- 11.Fung YC. Biomechanics: Circulation. 2. New York: Springer; 1997. [Google Scholar]
- 12.Haritonnidis JH. Advances in Fluid Mechanics measurements. New York: Springer-Verlag; 1989. The measurement of wall shear stress; pp. 229–236. [Google Scholar]
- 13.Holvoet P, Mertens A, Verhamme P, et al. Circulating oxidized LDL is a useful marker for identifying patients with coronary artery disease. Arterioscler Thromb Vasc Biol. 2001;21(5):844–848. doi: 10.1161/01.atv.21.5.844. [DOI] [PubMed] [Google Scholar]
- 14.Holvoet P, Vanhaecke J, Janssens S, et al. Oxidized LDL and malondialdehyde-modified LDL in patients with acute coronary syndromes and stable coronary artery disease. Circulation. 1998;98(15):1487–1494. doi: 10.1161/01.cir.98.15.1487. [DOI] [PubMed] [Google Scholar]
- 15.Hsiai TK, Cho SK, Honda HM, et al. Endothelial cell dynamics under pulsating flows: significance of high versus low shear stress slew rates (d(tau)/dt) Ann Biomed Eng. 2002;30(5):646–656. doi: 10.1114/1.1484222. [DOI] [PubMed] [Google Scholar]
- 16.Hsiai TK, Hwang J, Barr ML, et al. Hemodynamics influences vascular peroxynitrite formation: implication for low-density lipoprotein apo-B-100 nitration. Free Radic Biol Med. 2007;42(4):519–529. doi: 10.1016/j.freeradbiomed.2006.11.017. [DOI] [PMC free article] [PubMed] [Google Scholar]
- 17.Hwang J, Ing MH, Salazar A, et al. Pulsatile vs. Oscillatory Shear Stress Regulates NADPH Oxidase System: Implication for Native LDL Oxidation. Circ Res. 2003;93:1225–1232. doi: 10.1161/01.RES.0000104087.29395.66. [DOI] [PMC free article] [PubMed] [Google Scholar]
- 18.Imoto K, Hiro T, Fujii T, et al. Longitudinal structural determinants of atherosclerotic plaque vulnerability: a computational analysis of stress distribution using vessel models and three-dimensional intravascular ultrasound imaging. J Am Coll Cardiol. 2005;46(8):1507–1515. doi: 10.1016/j.jacc.2005.06.069. [DOI] [PubMed] [Google Scholar]
- 19.Jaffer FA, Vinegoni C, John MC, et al. Real-time catheter molecular sensing of inflammation in proteolytically active atherosclerosis. Circulation. 2008;118(18):1802–1809. doi: 10.1161/CIRCULATIONAHA.108.785881. [DOI] [PMC free article] [PubMed] [Google Scholar]
- 20.Kilner PJ, Yang GZ, Mohiaddin RH, et al. Helical and retrograde secondary flow patterns in the aortic arch studied by three-directional magnetic resonance velocity mapping. Circulation. 1993;88(5 Pt 1):2235–2247. doi: 10.1161/01.cir.88.5.2235. [DOI] [PubMed] [Google Scholar]
- 21.Koskinas KC, Feldman CL, Chatzizisis YS, et al. Natural history of experimental coronary atherosclerosis and vascular remodeling in relation to endothelial shear stress: a serial, in vivo intravascular ultrasound study. Circulation. 2010;121(19):2092–2101. doi: 10.1161/CIRCULATIONAHA.109.901678. [DOI] [PMC free article] [PubMed] [Google Scholar]
- 22.Ku DN. Blood flow in arteries. Annu Rev Fluid Mech. 1997;29:399–434. [Google Scholar]
- 23.Liu C, Tai YC, Huang JB, et al. Surface Micromachined Thermal Shear Stress Sensor. The First ASME Symposium on Application of Micro-Fabrication to Fluid Mechanics; 1994. pp. 9–15. [Google Scholar]
- 24.Madamanchi NR, Vendrov A, Runge MS. Oxidative stress and vascular disease. Arterioscler Thromb Vasc Biol. 2005;25(1):29–38. doi: 10.1161/01.ATV.0000150649.39934.13. [DOI] [PubMed] [Google Scholar]
- 25.Malinauskas RA, Sarraf P, Barber KM, et al. Association between secondary flow in models of the aortoceliac junction and subendothelial macrophages in the normal rabbit. Atherosclerosis. 1998;140(1):121–134. doi: 10.1016/s0021-9150(98)00129-4. [DOI] [PubMed] [Google Scholar]
- 26.Nerem RM, Alexander RW, Chappell DC, et al. The study of the influence of flow on vascular endothelial biology. Am J Med Sci. 1998;316(3):169–175. doi: 10.1097/00000441-199809000-00004. [DOI] [PubMed] [Google Scholar]
- 27.Raghavan ML, Vorp DA, Federle MP, et al. Wall stress distribution on three-dimensionally reconstructed models of human abdominal aortic aneurysm. J Vasc Surg. 2000;31(4):760–769. doi: 10.1067/mva.2000.103971. [DOI] [PubMed] [Google Scholar]
- 28.Rouhanizadeh M, Lin TC, Arcas D, et al. Spatial variations in shear stress in a 3-D bifurcation model at low Reynolds numbers. Ann Biomed Eng. 2005;33(10):1360–1374. doi: 10.1007/s10439-005-6542-9. [DOI] [PubMed] [Google Scholar]
- 29.Shipkowitz T, V, Rodgers G, Frazin LJ, et al. Numerical study on the effect of secondary flow in the human aorta on local shear stresses in abdominal aortic branches. J Biomech. 2000;33(6):717–728. doi: 10.1016/s0021-9290(99)00223-7. [DOI] [PubMed] [Google Scholar]
- 30.Stone PH, Coskun AU, Kinlay S, et al. Effect of endothelial shear stress on the progression of coronary artery disease, vascular remodeling, and in-stent restenosis in humans—in vivo 6-month follow-up study. Circulation. 2003;108(4):438–444. doi: 10.1161/01.CIR.0000080882.35274.AD. [DOI] [PubMed] [Google Scholar]
- 31.Sun P, Zhang Y, Yu F, et al. Micro-electrocardiograms to study post-ventricular amputation of zebrafish heart. Ann Biomed Eng. 2009;37(5):890–901. doi: 10.1007/s10439-009-9668-3. [DOI] [PMC free article] [PubMed] [Google Scholar]
- 32.Tatsumi K, Iwai H, Inaoka K, et al. Secondary flow effect to heat transfer of a duct with discrete rib turbulators. Heat Transf Gas Turbine Syst. 2001;934:481–488. doi: 10.1111/j.1749-6632.2001.tb05886.x. [DOI] [PubMed] [Google Scholar]
- 33.Taylor TW, Yamaguchi T. 3-Dimensional simulation of blood-flow in an abdominal aortic-aneurysm—steady and unsteady-flow cases. J Biomech Eng Trans Asme. 1994;116(1):89–97. doi: 10.1115/1.2895709. [DOI] [PubMed] [Google Scholar]
- 34.Topper JN, Cai J, Falb D, et al. Identification of vascular endothelial genes differentially responsive to fluid mechanical stimuli: cyclooxygenase-2, manganese superoxide dismutase, and endothelial cell nitric oxide synthase are selectively up-regulated by steady laminar shear stress. Proc Natl Acad Sci. 1996;93(19):10417–10422. doi: 10.1073/pnas.93.19.10417. [DOI] [PMC free article] [PubMed] [Google Scholar]
- 35.Verhamme P, Quarck R, Hao H, et al. Dietary cholesterol withdrawal reduces vascular inflammation and induces coronary plaque stabilization in miniature pigs. Cardiovasc Res. 2002;56(1):135–144. doi: 10.1016/s0008-6363(02)00515-1. [DOI] [PubMed] [Google Scholar]
- 36.Yu H, Ai L, Rouhanizadeh M, Patel D, Kim ES, Hsiai TK. Flexible polymer sensors for in vivo intravascular shear stress analysis. IEEE/ASME J MEMS. 2008;17(5):1178–1186. [Google Scholar]


