

Abstract
A significant challenge in biology is to functionally annotate novel and uncharacterized proteins. Several approaches are available for deducing the function of proteins in silico based upon sequence homology and physical or genetic interaction, yet this approach is limited to proteins with well-characterized domains, paralogs and/or orthologs in other species, as well as on the availability of suitable large-scale data sets. Here, we present a quantitative proteomics approach extending the protein network of core histones H2A, H2B, H3, and H4 in Saccharomyces cerevisiae, among which a novel associated protein, the previously uncharacterized Ydl156w, was identified. In order to predict the role of Ydl156w, we designed and applied integrative bioinformatics, quantitative proteomics and biochemistry approaches aiming to infer its function. Reciprocal analysis of Ydl156w protein interactions demonstrated a strong association with all four histones and also to proteins strongly associated with histones including Rim1, Rfa2 and 3, Yku70, and Yku80. Through a subsequent combination of the focused quantitative proteomics experiments with available large-scale genetic interaction data and Gene Ontology functional associations, we provided sufficient evidence to associate Ydl156w with multiple processes including chromatin remodeling, transcription and DNA repair/replication. To gain deeper insights into the role of Ydl156w in histone biology we investigated the effect of the genetic deletion of ydl156w on H4 associated proteins, which lead to a dramatic decrease in the association of H4 with RNA polymerase III proteins. The implication of a role for Ydl156w in RNA Polymerase III mediated transcription was consequently verified by RNA-Seq experiments. Finally, using these approaches we generated a refined network of Ydl156w-associated proteins.
The packaging of DNA in the nucleus of eukaryotic cells is achieved through the formation of nucleosomes, which predominantly consist of the core histones H2A, H2B, H3, and H4 (1, 2). Nucleosomes are highly dynamic structures, which are responsible for the state of chromatin, and may be found in either an extended (accessible = euchromatin) or condensed, (tightly packed = heterochromatin) state (3). The chromatin state is highly regulated and therefore dynamically changed during all cellular processes involving genomic DNA like transcription, DNA replication, and DNA repair; each of these changes are accompanied by modifications of the four histones such as acetylation, methylation, or ubiquitination (reviewed in (4–6)). These events are critical cellular processes and will clearly remain under study in the future. Therefore, identifying new associations with histone proteins that participate in these processes is valuable.
Many years of research have established specific interactions between corresponding protein complexes and histones (reviewed in (6, 7). However, it is believed that these interactions are gene or locus specific, for example are only present when a gene is actively transcribed or at the site of DNA repair (8). In contrast, less is known about proteins that constitutively or predominantly interact with histones independent of the chromatin state. We therefore took the opposing approach and used affinity purification experiments followed by mass spectrometry using the Tandem Affinity Purification (TAP)1 tagged histones in order to extend the core histone protein network, thereby identifying novel associations within core nucleosomes. One of the novel associations was with a previously poorly characterized protein, Ydl156w, which was initially identified in large scale analyses (9, 10). Ydl156w contains a WD40 repeat domain and has been shown to interact (directly or indirectly) with the histone H4-tail (11). Importantly, its human sequence homolog WDR76 (WD repeat protein 76) has a BLAST homology relation between sequences with an E-value of 5e-23 of their respective alignment (supplemental Fig. S1). WDR76 is also lacking any functional annotation and very limited information is available on its interaction partners as identified by STRING (http://string-db.org/). The study of Ydl156w could therefore also be a starting point for the future analysis of its human ortholog and might provide important information for the study of histone function. Through focused quantitative proteomics experiments combined with a bioinformatics approach utilizing genetic interaction data, gene deletions, and functional associations provided through the Gene Ontology consortium, we propose that the histone-associated protein Ydl156w is necessary for proper chromatin remodeling, transcription through RNA polymerase III, and DNA replication and repair. Follow-up studies using RNA-Seq further strengthened the importance of Ydl156w in RNA Polymerase III mediated transcription. Finally, using the information gained by the different approaches we also refined the network of Ydl156w-interacting proteins.
EXPERIMENTAL PROCEDURES
Tandem Affinity Purification (TAP)
All TAP-tagged strains were obtained from Open Biosystems (Huntsville, AL). Cells were grown in YPD to an absorbance of OD600 1.5–2.0. TAP was performed as previously described (12, 13). The ydl156w gene was deleted from a H4-TAP tag strain by homologous recombination using a kanamycin gene cassette flanked by 200 base pairs of gene specific sequence.
MudPIT Mass Spectrometry and Data Analysis
In order to analyze the purified protein complexes, TCA-precipitation, LysC/Trypsin digestion, and multidimensional protein identification technology (MudPIT) analyses were performed as previously described (13, 14). Briefly, peptide mixtures were pressure-loaded onto a three-phase 100 μm fused silica microcapillary column packed with 2.0 centimeters 5-μm C18 reverse phase particles (Aqua, Phenomenex) followed by 4.0 centimeters strong cation exchange resin (Partisphere SCX, Whatman) followed by 8.0 centimeters of a reverse phase resin tip. Loaded columns were washed with buffer A (water/acetonitrile/formic acid (95:5:0.1, v/v/v), pH 2.6) for 5 min. After desalting, the triphasic column was placed in-line with a Quaternary Agilent 1100 series HPLC pump and a LTQ linear ion trap MS equipped with a nano-LC electrospray ionization source (ThermoFisher). A fully automated 12-step MudPIT run was performed as previously described (14). Each full MS scan (from 400 to 1600 m/z range) was followed by five MS/MS events using data-dependent acquisition, with the five most intense ions from each MS scan subjected to Collision Induced Dissociation (CID). The RAW files for each mass spectrometry run are publicly available for download through Tranche at https://proteomecommons.org under the following hash: eD+I7An5/vYZyfDwcR+qvMNi/Mfs47s5KlH7p4T6Ltrs5rw0BIi426CJANkur2FN+TIZM/H/uO9DN8+Evlb2bDh2IVcAAAAAAAACVA = = .
RAW files were converted to the ms2 format using RAWDistiller v. 1.0, an in-house developed software. The ms2 files were subjected to database searching using SEQUEST (version 27 (rev.9) (15). No enzyme specificity was imposed during searches and the mass tolerance for precursor ions was set at 3 amu, whereas the mass tolerance for fragment ions was 0 amu. Tandem mass spectra were compared with 11,677 amino acid sequences consisting of 5880 nonredundant S. cerevisiae protein sequences obtained from the National Center for Biotechnology (2009-10-27 release). The database also included 176 common contaminant proteins including human keratins, IgGs, and proteolytic enzymes. The protein sequences for ubiquitin were pre-processed in order to reflect the mature processed form of ubiquitin expressed in the cell because the UBI4 gene contains multiple tandem repeats of the same sequence. The database also included randomized versions of each nonredundant protein entry to estimate the false discovery rates (FDR) (13). All SEQUEST searches were performed with a static modification of +57 Daltons added to cysteine residues to account for carboxamidomethylation, and dynamic searches of +16 Daltons for oxidized methionine; +14 Daltons for methylation of arginine and lysine residues; +28 Daltons for dimethylation of arginine and lysine residues; +42 Daltons for acetylation of alanine, lysine, serine and threonine residues; +80 Daltons for phosphorylation of serine, threonine and tyrosine; and +114 Daltons for ubiquitination of lysines. The process of performing post-translational modification searches on these purifications was not to identify new post-translational modifications, but to acquire additional spectra of the histone proteins because they are heavily modified.
Spectra/peptide matches were filtered using DTASelect/CONTRAST (16). In this data set, spectrum/peptide matches only passed filtering if they were at least seven amino acids in length and fully tryptic. The DeltCn was required to be at least 0.08, with minimum XCorr values of 1.8 for singly, 2.0 for doubly, and 3.0 for triply charged spectra, and a maximum Sp rank of 10. Proteins that were subsets of others were removed using the parsimony option in DTASelect (16) on the proteins detected after merging all runs. Proteins that were identified by the same set of peptides (including at least one peptide unique to such protein group to distinguish between isoforms) were grouped together, and one accession number was arbitrarily considered as representative of each protein group.
Quantitation was performed using label-free spectral counting. The number of spectra identified for each protein was used for calculating the distributed Normalized Spectral Abundance Factors (dNSAF) (17). NSAF v7 (an in-house developed software) was used to create the final report on all non-redundant proteins detected across the different runs, estimate FDR, and calculate their respective dNSAF values. supplemental Tables S2, S4, S6, and S8 contain the dNSAF values, and estimated FDRs. Information on the identified peptides and protein assignment is given in supplemental Tables S1, S3, S6, and S7 and the total number of proteins with their corresponding sequence coverage, unique peptides, and spectral counts passing criteria is given for each purification in supplemental Tables S2, S4, S6, and S8. Across the histone TAP preparations, the spectral FDR ranged from 0.00 to 0.33%, the unique peptide FDR ranged from 0.00 to 3.25% and the protein FDR ranged from 0.00 to 7.44%. Across the Ydl156w replicates, the spectral FDR ranged from 0.00 to 0.28%, the unique peptide FDR ranged from 0.00 to 0.56% and the protein FDR ranged from 0.00 to 1.64%.
Contaminant Extraction
The contaminant proteins were extracted from the data set as described in Mosley et al. (13). Basically, the nonspecific binding proteins were extracted from the data set by comparing the dNSAF value in each of the individual purifications with the dNSAF value from the mock controls. Seven mock control data sets were generated in which the mock controls consisted of yeast cell lysates from untagged BY4741 strains passed through the TAP purification to determine the background proteins in the data set that are a result of the purification protocol alone (supplemental Table S2). If the dNSAF value in the purification is less than twofold higher than the dNSAF in the mock control, the protein was considered nonspecific to that particular purification and the dNSAF was replaced by 0, otherwise the dNSAF value remained unchanged. The proteins that were shown to be nonspecific to all purifications were extracted from the data set. In addition, we also removed previously identified proteins that nonspecifically bind to the TAP tag (18). Proteins from the data set that were considered as contaminants in the large scale TAP purification studies performed by Krogan et al. (18). We chose this contaminant list because the strains used in the study were from the same S. cerevisiae strain library that we used.
Replicates Measure
The similarity between the biological replicates was assessed by calculating the Pearson correlation using the R environment function cor(value1, value2, method = c(“pearson”)) .
Singular Vector Decomposition
Singular vector decomposition was used to identify the most enriched proteins in our data set (19). The input matrix that was subjected to SVD consisted of 17 biological purifications corresponding to all known histone subunits and 556 pulled-down proteins. In principle, the proteins were sorted based on their coefficient values corresponding to the first singular vector and plotted in the linear-log and log-log scale (supplemental Fig. S2). The top proteins (located at the top of the distribution and separated by a dash line) with the highest coefficient values, which delimited from the remaining proteins were considered as forming a separate subnetwork. The SVD was performed using R environment function svd(matrix).
Size Exclusion Chromatography
Size exclusion chromatography was used to separate and identify large macromolecular complexes containing Ydl156w. The Ydl156w-TAP elution was concentrated, loaded onto a molecular weight calibrated Superose 6 10/300 GL column (high and low molecular weight calibration kit, GE Healthcare) at 0.2 ml/min, collecting 500 μl fractions. The Ydl156w protein was identified using an anti-TAP polyclonal antibody. After identifying fractions containing Ydl156w, selected fractions (fractions 5, 12, 17, and 23) were chosen for mass spectrometry analysis.
Gene Ontologies (GO) Analysis for Functional/Function Categories/Identification
GOstat (20) is a program that obtains the GO annotations for an analyzed list of genes and generates statistics on overrepresented genes found in a data set. GOstat was used to identify statistically overrepresented genes in the biological processes found in MudPIT data. GO terms were considered statistically significant if the p value was less than 0.01. In addition to the GOstat analysis, we also used Go Slim (http://www.yeastgenome.org/cgi-bin/GO/goSlimMapper.pl) to separate the proteins into different complexes. Like GOstat, Go Slim Mapper maps the GO annotations to a list of genes. The Slim set “Macromolecular complex Terms: Component” was used for determining whether the proteins in our data set are members of a particular complex. For the purpose of graphical representation we listed the top 20 mostly significant biological processes. In order to measure the similarity between the GO terms obtained from the GOstat analysis we used the function mgoSim (21) from the R environment. This function is generally used to compute the semantic similarity among sets of GO terms using the topology of the GO structure graph. The output value of the basic function mgoSim is between 0 and 1, with a higher value indicating higher similarity between the GO terms.
Transcriptional Profiling Analysis of Ydl156w Mutants Using RNA-Seq
To better understand the cellular role of Ydl156w, the transcriptome in deletion mutants was compared with wild-type using RNA-Seq. Three biological replicates of wild-type and Ydl156w deletion mutants were grown in YPD and total RNA was extracted and purified using the MasterPure™ Yeast RNA Purification Kit (http://www.epibio.com/item.asp?id = 426). Total RNA from wild-type and mutant strains was generated in triplicate and used to prepare individually barcoded libraries with the TruSeq RNA Sample Preparation Kit (Illumina, cat# FC-122–1001) according to manufacturer specifications. Briefly, 1250 ng Total RNA was enriched for poly(A)+ RNA by oligo(dT) selection. The Poly(A)+ RNA was then fragmented, and first-strand cDNA synthesis performed using random hexamer priming. Following second-strand synthesis, the ends were cleaned up, a nontemplated 3′ A was added, and Illumina indexed adapters were ligated to the ends. The libraries were enriched by 15 rounds of PCR. Purified libraries were quantified using the High Sensitivity DNA assay on an Agilent 2100 Bioanalyzer. All six libraries were pooled at equal molarities for multiplex sequencing. Pooled libraries were run single read with a 40 nt read length on two lanes of an Illumina GAIIx instrument (http://www.illumina.com/systems/genome_analyzer_iix.ilmn). The resulting fastq files were mapped to the yeast genome (UCSC, sacCer2) using tophat aligner version 1.3.1 (22). The alignments for sample pairs split across two lanes were merged. Cuffdiff version 1.0.3 was used to quantify gene expression for yeast genes using Ensembl version 63 in which the ratios between samples were quantified using the cuffdiff tool from the cufflinks suite (23). The results of the RNA level comparison between ydl156w deletion mutant and wild-type were visually represented using a MA plot (i.e. intensity versus average intensity). We subsequently subjected the up- and down-regulated transcripts to a GOstat analysis, from which the significantly enriched functional classes were determined.
Determination of Potential RNA Polymerase III Targets
In order to determine the functional role of Ydl156w in transcription, in particular with RNA-Polymerase III mediated transcription, we made use of the data set generated by Roberts et al. (24). To define the RNA Polymerase III targets in yeast, Roberts et al. performed genome-wide chromatin immunoprecipitation using subuits of RNA Polymerase III, TFIIB and TFIIC. For each segment (i.e. transcriptional unit), a ratio between Cy5 (for ChIP enriched) and Cy3 (for input) was recorded and normalized. Based on this ratio, which reflected the relative enrichment of the corresponding segment, a percentile rank (0–100%) was assigned. In order to obtain the segments occupied by RNA Polymerase III, we merely employed the data derived from its two subunits, Rpc40 and Rpc82 (i.e. left out TFIIB and TFIIC subunits). To ensure that the segments of changing RNA expression are indeed occupied by RNA Polymerase III, we required that the average percentile for each of the Rpc40 or Rpc82 occupied segments was at least 50% (i.e. medium to high percentage) greater than the average percentile obtained from the control (i.e. untagged strain).
Statistical Enrichment of Ydl156w Targets and Chromosome Occupancy by RNA Polymerase III
The hypergeometric distribution (equivalent to Fisher's one tailed exact test) was used to determine the degree of enrichment between transcriptional units occupied by RNA Polymerase III (i.e. genes occupied by RNA Polymerase III according to Roberts et al.) and those identified in our RNA-Seq study as being up- or down-regulated. The hypergeometric probability distribution is defined as follows:
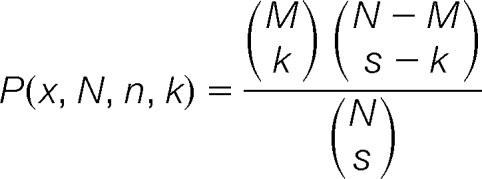 |
where k is the number of overlapping genes (i.e. genes that were up or down regulated and identified as occupied by Pol III with a particular average percentile cutoff), s is the sample size (i.e. number of genes that were up- (335 genes) or down-regulated (109 genes). M is the number of genes that were occupied by Pol III as determined by Roberts et al. (i.e. 2626 with an average percentile greater than 50%, 2122 with a 60% or more percentile, 1549 having 70% or higher average percentile, and 927 with an average greater than 80%), N is the population size (the total number of 3207 ORFs in the list of Robert et al.), and the brackets indicate the binomial coefficient:
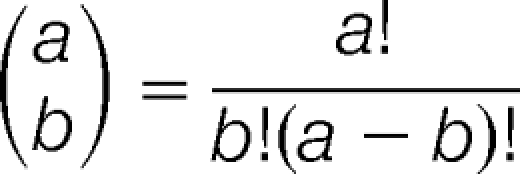 |
The hypergeometric distribution was calculated in the R environment using the function dhyper(k, M, N-M, s). Note that, the hypergeometric distribution was calculated applying different average percentile cutoffs between 50 and 80%.
RESULTS
Data Generation for the Wild-Type Histone Complex
All histones of the core nucleosome, i.e. H2A, H2B, H3, and H4 were TAP-tagged (hereafter referred to as “baits”), expressed and purified by affinity purification (supplemental Table S1 and S2). The proteins specifically binding to the respective histones (i.e. prey protein) were analyzed by MudPIT (14) and quantified using the distributed normalized spectral abundance factors (dNSAF) (17). Histone proteins are known to dynamically interact with many proteins, which often are low abundant and consequently are difficult to capture in single affinity purification experiments. We therefore performed at least four biological replicates to maximize our ability to capture as many dynamic and/or low abundant protein-protein associations as possible. A total of 17 biological purifications (4 × H4-TAP, 4 × H3-TAP, 4 × H2A-TAP, and 5 × H2B-TAP) were carried out for the 4 histone baits, which lead to the identification of a total of 1024 potential interacting proteins (supplemental Table S2, worksheet 1).
To distinguish truly associating preys from experimental noise, the dNSAF of each prey in every purification was compared with the corresponding dNSAF value in the negative control experiment as described in Mosley et al. (13). We retained only the proteins with dNSAF values in the purification at least twice the values measured in the mock experiments and also controlled for proteins that nonspecifically bind to the TAP tag by removing those proteins from the data set that were regarded as contaminants in the large scale TAP purification studies performed by Krogan et al. (18). After the contaminants extraction, a total of 556 proteins remained in the 17 purifications (supplemental Table S2, worksheet 2).
We next aimed to identify the most enriched proteins in the remaining data set because they are reflecting a high association with the baits. Therefore, Singular Value Decomposition (SVD) was applied on the matrix (556 × 17) based on the first singular vector (19). Next, all proteins were sorted according to the coefficients of the first eigenvector and then plotted in a log-log and linear-log scale (supplemental Fig. S2). Thereby, we focused our attention only on the 31 proteins located at the top of the distributions that were clearly separated from the rest of the proteins (supplemental Fig. S2). Out of this group we observed that 15 proteins were also among the 25 proteins shared between the four histone purifications, as represented by the intersection in the Venn diagram in Fig. 1A, therefore forming a distinct sub-network in the data set.
Fig. 1.

The identification of histone associated proteins. A, Venn diagram illustrating the shared nature of the histone core. Subunits common to all four baits are indicated by a black box. B, The relative abundance of the prey proteins in the core histones represented by dNSAF. Average dNSAF values for 25 preys that were shared by all histones and scored highly in the first singular vector of the SVD analysis. The blue color intensity is indicative of the dNSAF value according to the scale shown at the right side of the heat map. High dNSAFs are represented by the light blue whereas low dNSAF values correspond to dark blue. C, Relative protein abundance determined for the core histones as obtained from the H4 (n = 4 biological replicates), H3 (n = 4 biological replicates), H2A (n = 4 biological replicates), and H2B (n = 5 biological replicates) TAP purifications. Data in (C) is expressed as average dNSAF values + standard deviations.
We have previously demonstrated the highly reproducible nature of the system used on RNA Polymerase complexes (13). However, the reproducibility will be affected by the dynamics of the biological system being studied. Here, before further analysis, we first addressed the reproducibility of the distinct biological replicates for each bait using Pearson correlation on the quantitative dNSAF values of all proteins in the entire data set after contaminant extraction (supplemental Table S2, worksheet 3). The Pearson correlation analysis between biological replicates resulted in p values ranging from 0.70–0.97 between H4 replicates, 0.93–0.96 between H3 replicates, 0.97–0.98 between H2A replicates, and 0.75–0.92 between H2B replicates, thus indicating the high level of reproducibility between biological replicates (supplemental Fig. S3A and supplemental Table S2, worksheet 3). We previously also demonstrated that biological variance exceeds that of technical variance (13). Here we analyzed two technical replicates for three biological replicate analyses of histone H3-TAP purifications (supplemental Fig. S3B). Among all histone H3-TAP technical replicates the Pearson correlation analysis p values ranged from 0.54 to 0.98. If the one relatively weak technical replicate is removed (supplemental Fig. S3B), the p values range from 0.82 to 0.98 again demonstrating the high degree of reproducibility of the approach.
Next, we generated a 25 × 4 matrix with the average values of the 25 preys found in all histone purifications (Fig. 1A) and represented these proteins in Fig. 1B. This sub-network included the histone core and additional interactors such as the Yku complex (Yku70 and Yku80) (25, 26), Rim1, Abf2, Gfa1, Dem1, Sub2, Smc3, Yta7, Cse4, Cka2, Tif34, the heteromeric replication protein A (RPA) complex (Rfa2 and Rfa3) (27), the RNA polymerase III complex (Rpo31, Ret1, Rpc17, Rpc37, Rpc40 and Rpc82) (reviewed in (28)), and a previously poorly characterized protein with unknown function, Ydl156w (Figs. 1B and 1C). Among the proteins identified in this sub-network, we were most intrigued by Ydl156w and therefore sought to characterize the role of this novel component of the histone core complex in the remainder of this study.
Identification of Novel Ydl156w-associated Proteins and Their Associated Functions
In order to test that Ydl156w is indeed associated with all the histone proteins we next performed a reciprocal purification with a TAP tagged Ydl156w protein (Fig. 2A–2C and supplemental Tables S3 and S4). Six biological replicate analyses of Ydl156w were carried out to ensure a high-quality data set and to maximize our ability to capture as many dynamic and/or low abundant protein-protein associations as possible (13). Interestingly, besides all of the histones that were detected in the Ydl156w-TAP (Fig. 2B), many of the proteins that were determined for the histone sub-network were also identified in the Ydl156w-TAP (Fig. 2C), indicating a stable association between these proteins. This included Rim1, Rfa2, Rfa3, Yta7, Yku70, and Yku80 (Fig. 2C). More importantly, in addition to the members of the histone network, a large number of additional proteins could be identified as interacting partners of Ydl156w of which the majority had not yet been described. This observation leads us to the question of whether Ydl156w interacts with multiple subcomplexes as they could provide insights into the function of the Ydl156w.
Fig. 2.

dNSAF analyses of the histones and Ydl156w. A, Silver stained gel for the Ydl156w-TAP purification. The histone proteins along with Ydl156w are indicated on the right side of the gel. B, Relative protein abundance for the core histones and Ydl156w obtained from the Ydl156w-TAP (n = 6). C, The relative abundance of additional prey proteins (that are also identified in the four histone purifications) in the Ydl156w-TAP (n = 6 biological replicates), represented by dNSAF. Data in (B) and (C) are expressed as average dNSAF values + standard deviations.
Because Ydl156w was a previously uncharacterized protein, we tried to get insight into its putative function using the Gene Ontology (GO) resource. As expected, no direct functional association was available for Ydl156w through Gene Ontology. We therefore instead tried to infer its function by evaluating its binding partners by performing a GOstat (20) analysis on all proteins pulled down by Ydl156w-TAP. Using the gene IDs for the proteins identified in the corresponding MudPIT data set, we next determined the overrepresented GO terms (biological process) within the group of proteins pulled-down by Ydl156w-TAP. GO terms were considered as statistically significant if the p value was less than 0.01 (see supplemental Table S5, worksheet 1). Fig. 3A contains a graphic representation of the 20 most significantly enriched biological processes. General predominant categories were “transcription” (by RNA polymerase II and III), “chromatin remodeling,” “chromatin assembly and disassembly,” “DNA recombination,” “DNA replication” and “DNA repair.” An analysis using Go Slim gave similar results (supplemental Table S5, worksheet 2).
Fig. 3.

Detected proteins in the Ydl156w-TAP and their functional classifications. A, Gene Ontology classes (“biological process”) significantly overrepresented (in percent, as measured by GOstat (20)) in the Ydl156w purifications. All six biological replicates were used for GO analysis, however, for visualization purposes we only represented the top 20 overrepresented (by percentage) categories of “biological processes.” B, An interaction network that depicts the Ydl156w associated proteins identified by MudPIT. Proteins identified in at least three biological replicates are depicted in (B) and used to create a network of Ydl156w associations using Cytoscape (56, 57).
Our results obtained from the proteomics analyses revealed associations between Ydl156w and several chromatin-remodeling complexes, in particular with proteins from the ATP-dependent chromatin remodeling complexes SWI/SNF and RSC (29, 30). In contrast to other chromatin remodeling complexes (such as SAGA), SWI/SNF does not covalently modify histones but rather is implicated in positioning the histone core on DNA in order to create nucleosome-free regions (31), and 58% of all known SWI/SNF components were detected in the Ydl156w pull-downs (Swp82, Rtt102, Swi3, Arp9, Snf12, Swi1, and Taf14). The RSC complex remodels the structure of chromatin, and 45% of its subunits (Rsc8, Rtt102, Rsc6, Rsc58, Rsc2, Arp9, Npl6, and Taf14) showed an association with Ydl156w. Besides the ATP-dependent chromatin complexes, our results also revealed an enrichment in the histone deacetylase complexes RPD3L (Ume1, Ume6, Sin3, and Rpd3), RPD3S (Rco1) and the facilitates chromatin transcription complex, FACT (Spt16 and Pob3).
Strikingly, the MudPIT analyses revealed a large number of RNA polymerase III subunits (Rpb5, Rpc53, Rpc11, Rpc10, Rpc37, Rpc34, Rpo31, Ret1, Rpb8, Rpc40, Rpo26, and Rpc82) (reviewed in (28, 32)) associating with Ydl156w, five of which were detected in at least two replicates. In contrast, none of the RNA polymerase II subunits were observed, with the exception of the proteins shared with RNA polymerase III (Rpb5, Rpb8, Rpc10, and Rpo26). However, in addition to the previously mentioned chromatin remodeling complexes facilitating transcription by RNA polymerase II, other RNA polymerase II specific general transcription factors were observed, such as a subunit of the PAF complex Leo1. The MudPIT results also indicated a role of Ydl156w during several modes of double-stranded break (DSB) DNA repair, because we detected all three subunits of the heteromeric replication protein A (RPA) complex (Rfa1, Rfa2, and Rfa3 (33)), as well as both subunits of the teleomeric Ku complex (Yku70-Yku80), which participate in nonhomologous end-joining (NHEJ) DSB DNA repair by promoting the rejoining (34).
Using the information gained from the Ydl156w-TAPs, we were able to refine the network of Ydl156w-interacting proteins (Fig. 3B). It should be noted that multiple components of these reviewed complexes were present in at least two biological replicates, however several proteins were found in a single replicate with a strict filtering criteria. Therefore in order to increase the confidence of the Ydl156w associating proteins, we have only included proteins that were identified in at least three biological replicates in the network (Fig. 3B). Finally, for all proteins bound to Ydl156w, the represented Gene Ontology categories together with their associated proteins and p values, according to GOstat and GO Slim (including several categories/proteins not discussed in this section), are reported in supplemental Table S5 (worksheet 1 and 2) and discussed in more detail in the Supplemental file.
Separation by Size Exclusion Chromatography
In order to validate some of the identified associations with Ydl156w, we next separated the complexes based on their size using Size Exclusion Chromatography. We first fractionated the Ydl156w-TAP elution by Superose 6 size exclusion chromatography and then monitored the elution by Western blotting and MS (Fig. 4). Western blotting was used to identify the Ydl156w protein through the use of an Anti-TAP antibody (Rabbit polyclonal) (Fig. 4A). Ydl156w was identified as two bands detected in multiple fractions with varying intensities correlating to its monomeric molecular weight of 60 kDa as well as higher order complexes with a molecular weight greater than 1.5 MDa (Fig. 4A). Next, mass spectrometry was used to identify proteins present in several of the Superose 6 fractions (Fig. 4B). The majority of Ydl156w was found in Fractions 5 and 23, with lower levels detected in fractions 12 and 17. MS results revealed that fraction 5 contains Ydl156w and components of the histone complex (H4, H3, H2B, and Htz1), the telomeric Ku complex (Yku80), the histone acetyltransferase complex (Hat1, Hat2 and Hif1), components of the RSC chromatin remodeling complex (Rsc8, Rsc2, and Sth1), and Rim1 indicating that indeed Ydl156w associates with the histone core and other proteins from different multi-subunit complexes (Fig. 4B). The relative abundance of proteins identified in fraction 5, as well as their relative abundance levels in fraction 23, which form high molecular weight complexes with Ydl156w are shown in Fig. 4B. The rest of the proteins identified in fractions 5, 12, 17, and 23 are listed in the supplemental Table S6, worksheets 1 and 2.
Fig. 4.

Ydl156w exists in high molecular weight complexes. The yeast protein Ydl156w was purified from S. cerevisiae and fractionated by size exclusion chromatography on a superose 6 HR 10/30 column. A, Fractions were collected and aliquots were TCA precipitated, separated using SDS-PAGE and transferred to nitrocellulose membranes for Western blotting. The TAP-tagged Ydl156w was detected with polyclonal anti-TAP IgG. B, MudPIT analyses were carried out on superpose six fractions and dNSAF values of the 17 proteins identified in fraction 5, as well as their relative abundance levels in fraction 23 are shown.
Absent Proteins from H4-Ydl156wΔ: Feature and Functions
Because our data showed a clear association between the Ydl156w and the core histone complex, we next tried to address the effect of Ydl156w on the biological processes associated with the histone core. Our focus was on histone H4 because it is the bait that pulled down the largest amount of Ydl156w when comparing dNSAF values for Ydl156w among all the histone TAP purifications (Fig. 1A and supplemental Table S2, worksheet 2). In addition, the tail of histone H4 has been shown to interact with proteins containing a WD40-repeat (11), and Ydl156w has several predicted WD40 domains.
We have previously demonstrated that the analysis of protein complexes in gene deletion backgrounds is a valuable approach to determine protein complex modularity in well characterized complexes (35, 36). Here we sought to determine if Ydl156w was important for any of the protein interactions found in H4-TAP purifications. Therefore, we compared the H4-TAP results to the H4-TAP results in a ydl156w deletion background. We analyzed three biological replicates of the H4-TAP ydl156wΔ purification (supplemental Tables S7 and S8). The lack of Ydl156w had dramatic effects on H4 interactions with components of RNA Polymerase III, in which the majority of its specific proteins were no longer detected and identified (Fig. 5A). Surprisingly, the interaction of H4 with RNAP II specific proteins appeared to increase in the H4-TAP ydl156wΔ purification (Fig. 5A). Lastly, the major H4 interactions seen were not affected by the loss of ydl156w (Fig. 5B).
Fig. 5.

Classification of detected proteins in H4-TAP in comparison with H4-TAP in ydl156w deletion strain. A, The relative abundance of proteins of the RNA Polymerase III complex obtained from H4-TAP (n = 4 biological replicates) and H4-TAP in a ydl156w deletion strain (n = 3 biological replicates). B, Relative protein abundance determined for the major H4 interactions in the ydl156w mutant strain. Data in (A) and (B) are expressed as average dNSAF values + standard deviations. C, The top 20 overrepresented classes (“biological process”; in percent) as determined by GOstat. Gray color corresponds to the overrepresented classes in “biological process” in the H4-TAP whereas the red color illustrates the enriched categories in “biological processes” of the H4-TAP in the ydl156wΔ.
To gain deeper insight we used the same GOstat approach, as used previously for Ydl156w, to the histone H4 purification (H4-TAP). Two predominant categories observed in Ydl156w-TAP were also enriched in the H4-TAP, which are “chromatin remodeling” and “transcription” (both by RNA polymerase II and III) (supplemental Table S9; worksheets 1 and 2). Strikingly, the category “transcription from RNA polymerase III promoter” was, like for Ydl156w, highly enriched, with 26 out of 38 proteins present in the whole yeast genome (p value equal to 3.58E-25). Several other classes were similarly enriched both in H4-TAP as well as in Ydl156w-TAP (correlation coefficient of 0.863 as determined by mgoSim (see Materials and Methods)). Because of this overlap, we reasoned that Ydl156w might be functionally required (or involved) for the histone complex to facilitate these shared functions. In addition, this overlap could also provide a basis for elucidating the links between Ydl156w and its functional association classes. We therefore tried to address the functional consequences of deleting ydl156w on those histone associated functions by comparing the wild-type H4-TAP GOstat results with H4-TAP strains in which ydl156w was genetically deleted (Fig. 5C).
Our proteomic results from H4-TAP in ydl156wΔ revealed that a number of proteins from the ATP dependent chromatin complexes were absent when compared with the H4-TAP purification. In particular, for the RSC complex a total of 7 proteins (Rsc30, Rsc4, Rsc58, Sfh1, Rsc2, Rsc9, and Arp9) were no longer observed after deletion of ydl156w (supplemental Table S10). Because three of the missing proteins (Rsc58, Rsc2, and Arp9) were also observed in one of the Ydl156w-TAP purifications, we can suggest that Ydl156w recruits those subunits to histone H4/chromatin, in which the RSC complex is otherwise only partially assembled. It should be noted that Arp9 is also a shared component of the SWI/SNF complex. In addition to the Arp9 protein, two additional proteins (Swp82 and Swi1) were also absent when compared with H4-TAP (supplemental Table S8). All three of these proteins could be the direct link between the SWI/SNF complex and the histone H4/chromatin, because these proteins were also observed in Ydl156w-TAP. Within the Rpd3 complex, Ume1 and Ume6 were the only two proteins missing from the purification.
Our GO analysis showed a clear decrease in the number of proteins involved in transcription. A major effect of ydl156wΔ was observed for the RNA polymerase III complex, because its eight unique subunits (out of 17) were no longer observed to associate with H4 (Fig. 5A and supplemental Tables S9 and S10, worksheets 1 and 2). In addition, several subunits of the RNA polymerase III associated TFIIIC complex (Tfc3, Tfc6, and Tfc8) were also absent. Other proteins involved in transcription were also absent in H4-TAP ydl156wΔ: shared subunits of the PAF1 transcription elongation factor (Cdc73, Pob3, and Leo1) (37) and the entire protein kinase CK2 complex (Ckb1, Ckb2, Cka1, and Cka2) (38) whose substrates include the transcription factor (TF) complexes and all RNA polymerases, thereby promoting the formation of transcriptional pre-initiation complexes on DNA. Finally, further proteins absent from H4-TAP ydl156wΔ that were not assigned by GO Slim to any of the identified groups are reported in the supplemental Table S10 (worksheet 2) and discussed in more detail in the Supplemental file.
The Role of Ydl156w in Gene Expression and Transcription
We next sought to further investigate the potential role of Ydl156w in gene expression and transcription, in particular transcription mediated by RNA polymerase III, which was one of the most prominent functional groups enriched in our GOstat analysis (i.e. in the H4-TAP ydl156Δ, specific proteins of the Pol III complex are absent). To provide further evidence using an additional independent methodology, we inspected the function of Ydl156w during the transcription of RNA species using RNA-Seq. We performed three biological replicates using wild-type and ydl156w mutants, respectively, and recorded the log2 ratio of the changes (See supplemental Table S11, worksheet 1). For an initial visualization of the changes between the ydl156w deletion mutant and wild-type, we used a MA plot, which allows examining the ratio of difference, as well as the components that give rise to the ratio in separated axes. After plotting the log2 ratio of ydl156w mutant/wild-type versus the magnitude of the signal coming from both samples represented by the expression log2(sqrt (wild-type*Ydl145w)) (Fig. 6A), we identified 351 up-regulated genes and 116 down-regulated transcripts with an adjusted p value of less than 0.05 (See Fig. 6A and supplemental Table S11, worksheet 1). In total, the regulation of 467 genes was affected by the deletion of ydl156w clearly demonstrating that Ydl156w plays a key role in gene expression.
Fig. 6.

RNA-Seq analysis of gene expression in a ydl156w deletion strain. A, The results of comparing gene expression between wild type and ydl156w deletion cells are shown in the MA plot. The y axis represents the log2 ratio of expression values for ydl156w/wt, whereas the x axis represents the overall magnitude of the signal coming from both samples, calculated by the expression log2(sqrt(wt*ydl156w)). Values highlighted in color represent genes with an adjusted p value of less than 0.05. The number of genes enriched in ydl156w or wild-type by this criteria is indicated. The dash gray line represents a twofold difference in expression up or down. B, 10 most significant functional classes as determined by GOstat analysis in the group of up- and down-regulated transcripts. The x axis depicts the percentage relative to all transcripts of the functional class. C, Results of the hypergeometric test comparing the RNA-Seq data to the RNA Polymerase III ChIP-chip data performed by Roberts et al. (24). The p values indicating the statistical significance of enrichment of RNA Polymerase III occupied transcripts in the RNA-Seq data are reported for different average percentiles.
Next, a Gene Ontology enrichment analysis was performed on the two sets of genes. As defined by GO Slim and GOstat, most genes considered to be up- or down-regulated were characterized as “housekeeping” genes. The two largest increases in gene expression seen in the ydl156w deletion strain were for HSP30 and PHO84, both integral membrane proteins involved in transport (supplemental Table S11). Among the top categories of genes that were increased in the ydl156w deletion were catabolic processes and electron transport (Fig. 6B and supplemental Table S11, worksheets 1–5). Two of the largest decreases in gene expression seen in the ydl156w deletion strain, other than ydl156w itself, included DAN1 and FIT1, both cell wall mannoprotein (supplemental Table S11). Among the top categories of genes that were decreased in the ydl156w deletion were assimilation and transport processes (Fig. 6B and supplemental Table S11, worksheets 1–5).
In order to examined whether Ydl156 is implicated in recruiting RNA Polymerase III to the chromatin, we integrated the Chromatin Immunoprecipitation (ChIP) - microarray (ChIP-chip) data generated by Roberts et al. (24) in our analysis. In short, Roberts et al. performed Chromatin Immunoprecipitation followed by microarray (ChIP-chip) using subunits of Polymerase III (Rpc40, also a member of Pol I, and Rpc82) to define Polymerase III targets in S. cerevisiae (24). To identify the enriched segments (i.e. transcriptional units), Roberts et al. first determined Cy3 (i.e. label for input) and Cy5 (i.e. label for ChIP enriched DNA) intensities for every segment, followed by a normalization. A percentile rank (0–100%) was assigned to the Cy5/Cy3 ratio for each segment, with segments of high Cy5/Cy3 ratios, which correspond to enriched segments, giving rise to high percentile ranks. We used these percentile rank cutoffs (between 50 and 80%) to determine the segments occupied by RNA Polymerase III (i.e. Rpc40 or Rpc82), and assayed whether the corresponding RNAs were significantly up- or down-regulated in ydl156w mutants according to our RNA-Seq data set (using the same 351 and 116 transcripts, respectively). Using a hypergeometric distribution for assessing its significance (see Experimental Procedures), we observed a significant enrichment of RNA Polymerase III occupancy on the transcriptional units that, according to our RNA-Seq data set, were affected by the loss of ydl156w with the majority of p values being less than 0.01. For example, a highly significant p value of 2.09E-08 was obtained for the genes up-regulated in the ydl156w deletion strain that had at least an 0.8 average percentile for RPC82, which is an RNA Polymerase III specific subunit (See supplemental Tables S12 (worksheets 1 and 2), and Fig. 6C). These results provide further evidence that Ydl156w plays an important role in gene expression and RNA Polymerase III function.
DISCUSSION
Using an affinity purification approach followed by quantitative proteomics we were able to extend the protein network of core nucleosomes. Our data shows that the four histones, i.e. H2A, H2B, H3, and H4, strongly associate with additional 15 proteins, which were found in affinity purifications of all four histones and were also among the 31 proteins enriched in the entire data set as determined by Singular Value Decomposition (SVD). This suggests that the core histones are present in a large complex or several subcomplexes (which always contain H2A, H2B, H3, and H4). Among these were proteins of the replication factor A (RPA) complex, which is involved in DNA replication, but also proteins involved in DNA recombination and repair (reviewed in (39, 40)): the Yku complex, which also functions in nonhomologous end joining (NHEJ), DNA repair (34) and Rim1, the homolog of SSB (single-stranded DNA binding protein) in E. coli (41), and subunits of RNA polymerase III.
Surprisingly, also in this group of novel associations was the poorly characterized yet highly conserved protein, Ydl156w, which, except for a WD40 domain, has no known function. In order to gain insights into its potential functions, we applied a strategy combining experimental and bioinformatics approaches, incorporating information from several different sources, i.e. quantitative proteomics generated in this study, large-scale genetic interaction data and the ontologies provided through the Gene Ontology consortium. The results provide evidence for an important function of Ydl156w in chromatin remodeling, transcription, DNA replication and DNA repair and also revealed novel proteins that are in close association with Ydl156w. Our analysis links Ydl156w to chromatin remodeling, in particular to the SWI/SNF, RSC, and the RPD3 complexes, which all have the capability of specifically being recruited to RNA polymerase II promoters by transcriptional activators or repressors/corepressors, thereby activating or repressing expression (reviewed in (42–44)). Strikingly, these associations to histone H4 are at least partially lost (i.e. part of the respective complexes are missing) in the absence of ydl156w. Therefore it is intriguing to speculate that Ydl156w might be involved in the recruitment of the respective complexes to the chromatin or functions as a linker between the complexes and the core nucleosomes. In agreement with the involvement of Ydl156w associated factors in the regulation of transcription by changing the chromatin status, several subunits of complexes influencing transcription by RNA polymerase II were also linked to Ydl156w. Interestingly, based upon a publication of Lenstra et al. (45) who generated and analyzed 165 mutants of chromatin machinery components in S. cerevisiae, the expression of Ydl156w is strongly changed in Gcn5 mutants (with a p value equal to 4.00E-06), suggesting that the interaction between Ydl156w and the Gcn5 containing chromatin remodeling complexes is additionally autoregulated at the transcriptional level. Concerning the predicted role of Ydl156w in chromatin remodeling and transcription, we located among the novel Ydl156w associated proteins one well characterized protein that is involved in the regulation of transcription, named Mot1. Strikingly, in a previous study (46) purifying TAP tagged Mot1, a large number of similar protein associations as for Ydl156w were identified, indicating that both proteins might function cooperatively in regulating transcription. Ydl156w playing a key role in gene expression was further supported by RNA-Seq analysis of wild-type versus a ydl156w deletion strain in which the regulation of 467 genes was affected by the deletion of ydl156w.
Our bioinformatics analysis also provided a connection of Ydl156w with DNA repair, which was especially evident from the large-scale genetic interaction data (supplemental Fig. S4), in which several associations to major players of the DNA repair machinery were scored (47). Strikingly, Ydl156w shares a significant PDB structure homology (p value 9.4e-05, with 21% identity, 33% amino acid similarity on a region covering more than half of its protein length) to the crystal structure of the human UV DNA-damage recognition complex DDB1-DDB2, which is involved in the initial detection of UV lesions in vivo (48) (supplemental Fig. S5; it should be noted that the predicted structure homolog differs from WDR76, the human protein with the highest sequence homology). Therefore, it is possible that the function of Ydl156w for the different modes of DSB DNA repair is analogously in the recognition of the damaged nucleotides. In agreement with this idea is the fact that Ydl156w was previously shown to be specifically expressed during the cell cycle (49, 50), showing a peak at late G1 phase as well as encompassing late G1 phase specific regulatory elements (like Pol2 and Pol32), which would suggest that Ydl156w plays a role during the G1/S checkpoint of DNA repair (49, 50). Accordingly, Brohee et al. identified Ydl156w in an in silico screen as a probable Mbf1p target gene, which associates with Swi6p to form the MBF complex involved in transcriptional control of several genes during the G1/S transition (51).
One of the most striking findings was the association of Ydl156w with the majority of the proteins belonging to the RNA polymerase III complex, which mostly fail to purify with histone H4 in the ydl156w deletion strain. This observation is in agreement with the fact that Ydl156w co-occurs (e.g. in APMS experiments using Bob1 and Las17 as baits) according to the pSTIING (Protein, Signaling, Transcriptional Interactions & Inflammation Networks Gateway) database (http://pstiing.licr.org) (52) with the subunits of RNA polymerase III thus strengthening our result. The role of Ydl156w in RNA polymerase III biology was further supported by the comparison of the genes whose expression was changed by deletion of ydl156w and RNA polymerase III localization as determined by ChIP-Chip (24). In this computational analysis a statistically significant subset of the genes affected by ydl156w deletion have also been shown to be enriched for RNA polymerase III. Finally, recent evidence has demonstrated the role of the FACT and RSC complexes in RNA Polymerase III transcription (53–55), and both the FACT and RSC complexes were found in Ydl156w-TAP purifications and the association of the RSC complex with histone H4 was disrupted in the H4-TAP ydl156w deletion strain. These results strongly suggest that Ydl156w plays a role in RNA polymerase III biology.
Taken together, the novel, previously uncharacterized member of the core histone network, Ydl156w, is suggested to be implicated in several major cellular processes related to core nucleosomes. Based upon its amino acid composition it is unlikely that Ydl156w is directly catalyzing the corresponding processes, but the absence of the respective proteins or whole protein complexes in ydl156w mutants strongly suggests its requirement for recruiting the necessary factors to histone H4 on specific sites of the chromosomes that are being rearranged or replicated, that are sites of transcription or that require the attention of the DNA repair machinery. The presence of a WD40 domain which, despite its low level of sequence conservation and functional diversity is present in several scaffold proteins, further strengthens this notion. Although the exact mode of action for Ydl156w remains to be elucidated, its broad spectrum of functional involvement suggests a pivotal role in nucleosome associated processes. Follow up biochemical, molecular, and genomic studies are required to further elucidate the function of Ydl156w, but this study provides the first information regarding the role of this highly conserved protein in histone biology. Finally, all our observations were in vast agreement with the limited functional associations from the literature. We demonstrated that our approach combining quantitative proteomics with a bioinformatics strategy incorporating large-scale genetic interaction data and the ontologies provided through the Gene Ontology consortium is capable of inferring the function of uncharacterized or poorly characterized proteins.
Footnotes
* This work was supported by the Stowers Institute for Medical Research and the M.R. and Evelyn Hudson Foundation.
 This article contains supplemental Figs. S1 to S5 and Tables S1 to S13.
1 The abbreviations used are:
- TAP
- tandem affinity purification
- MudPIT
- multidimensional protein identification technology
- FDR
- false discovery rate
- dNSAF
- distributed normalized spectral abundance factors
- SVD
- Singular Value Decomposition
- ChIP
- chromatin immunoprecipitation.
REFERENCES
- 1. Kornberg R. D. (1974) Chromatin structure: a repeating unit of histones and DNA. Science 184, 868–871 [DOI] [PubMed] [Google Scholar]
- 2. Sahasrabuddhe C. G., van Holde K. E. (1974) The effect of trypsin on nuclease-resistant chromatin fragments. J. Biol. Chem. 249, 152–156 [PubMed] [Google Scholar]
- 3. Huisinga K. L., Brower-Toland B., Elgin S. C. (2006) The contradictory definitions of heterochromatin: transcription and silencing. Chromosoma 115, 110–122 [DOI] [PubMed] [Google Scholar]
- 4. Murr R. (2010) Interplay between different epigenetic modifications and mechanisms. Adv. Gen. 70, 101–141 [DOI] [PubMed] [Google Scholar]
- 5. Smith E., Shilatifard A. (2010) The chromatin signaling pathway: diverse mechanisms of recruitment of histone-modifying enzymes and varied biological outcomes. Mol. Cell 40, 689–701 [DOI] [PMC free article] [PubMed] [Google Scholar]
- 6. Kouzarides T. (2007) Chromatin modifications and their function. Cell 128, 693–705 [DOI] [PubMed] [Google Scholar]
- 7. Bao Y., Shen X. (2007) INO80 subfamily of chromatin remodeling complexes. Mutation Res. 618, 18–29 [DOI] [PMC free article] [PubMed] [Google Scholar]
- 8. Bao Y., Shen X. (2007) Chromatin remodeling in DNA double-strand break repair. Curr. Opin. Genet. Dev. 17, 126–131 [DOI] [PubMed] [Google Scholar]
- 9. Gavin A. C., Aloy P., Grandi P., Krause R., Boesche M., Marzioch M., Rau C., Jensen L. J., Bastuck S., Dümpelfeld B., Edelmann A., Heurtier M. A., Hoffman V., Hoefert C., Klein K., Hudak M., Michon A. M., Schelder M., Schirle M., Remor M., Rudi T., Hooper S., Bauer A., Bouwmeester T., Casari G., Drewes G., Neubauer G., Rick J. M., Kuster B., Bork P., Russell R. B., Superti-Furga G. (2006) Proteome survey reveals modularity of the yeast cell machinery. Nature 440, 631–636 [DOI] [PubMed] [Google Scholar]
- 10. Hellauer K., Lesage G., Sdicu A. M., Turcotte B. (2005) Large-scale analysis of genes that alter sensitivity to the anticancer drug tirapazamine in Saccharomyces cerevisiae. Mol. Pharmacol. 68, 1365–1375 [DOI] [PubMed] [Google Scholar]
- 11. Suka N., Nakashima E., Shinmyozu K., Hidaka M., Jingami H. (2006) The WD40-repeat protein Pwp1p associates in vivo with 25S ribosomal chromatin in a histone H4 tail-dependent manner. Nucleic Acids Res. 34, 3555–3567 [DOI] [PMC free article] [PubMed] [Google Scholar]
- 12. Puig O., Caspary F., Rigaut G., Rutz B., Bouveret E., Bragado-Nilsson E., Wilm M., Séraphin B. (2001) The tandem affinity purification (TAP) method: a general procedure of protein complex purification. Methods 24, 218–229 [DOI] [PubMed] [Google Scholar]
- 13. Mosley A. L., Sardiu M. E., Pattenden S. G., Workman J. L., Florens L., Washburn M. P. (2011) Highly reproducible label free quantitative proteomic analysis of RNA polymerase complexes. Mol. Cell. Proteomics 10, M110.000687 [DOI] [PMC free article] [PubMed] [Google Scholar]
- 14. Florens L., Washburn M. P. (2006) Proteomic analysis by multidimensional protein identification technology. Methods Mol. Biol. 328, 159–175 [DOI] [PubMed] [Google Scholar]
- 15. Eng J. K., McCormack A. L., Yates J. R., 3rd (1994) An approach to correlate tandem mass spectral data of peptides with amino acid sequences in a protein database. J. Am. Soc. Mass Spectrom. 5, 976–989 [DOI] [PubMed] [Google Scholar]
- 16. Tabb D. L., McDonald W. H., Yates J. R., 3rd (2002) DTASelect and Contrast: tools for assembling and comparing protein identifications from shotgun proteomics. J. Proteome Res. 1, 21–26 [DOI] [PMC free article] [PubMed] [Google Scholar]
- 17. Zhang Y., Wen Z., Washburn M. P., Florens L. (2010) Refinements to label free proteome quantitation: how to deal with peptides shared by multiple proteins. Anal. Chem. 82, 2272–2281 [DOI] [PubMed] [Google Scholar]
- 18. Krogan N. J., Cagney G., Yu H., Zhong G., Guo X., Ignatchenko A., Li J., Pu S., Datta N., Tikuisis A. P., Punna T., Peregrin-Alvarez J. M., Shales M., Zhang X., Davey M., Robinson M. D., Paccanaro A., Bray J. E., Sheung A., Beattie B., Richards D. P., Canadien V., Lalev A., Mena F., Wong P., Starostine A., Canete M. M., Vlasblom J., Wu S., Orsi C., Collins S. R., Chandran S., Haw R., Rilstone J. J., Gandi K., Thompson N. J., Musso G., St Onge P., Ghanny S., Lam M. H., Butland G., Altaf-Ul A. M., Kanaya S., Shilatifard A., O'Shea E., Weissman J. S., Ingles C. J., Hughes T. R., Parkinson J., Gerstein M., Wodak S. J., Emili A., Greenblatt J. F. (2006) Global landscape of protein complexes in the yeast Saccharomyces cerevisiae. Nature 440, 637–643 [DOI] [PubMed] [Google Scholar]
- 19. Sardiu M. E., Cai Y., Jin J., Swanson S. K., Conaway R. C., Conaway J. W., Florens L., Washburn M. P. (2008) Probabilistic assembly of human protein interaction networks from label-free quantitative proteomics. Proc. Natl. Acad. Sci. U. S. A. 105, 1454–1459 [DOI] [PMC free article] [PubMed] [Google Scholar]
- 20. Beissbarth T., Speed T. P. (2004) GOstat: find statistically overrepresented Gene Ontologies within a group of genes. Bioinformatics 20, 1464–1465 [DOI] [PubMed] [Google Scholar]
- 21. Yu G., Li F., Qin Y., Bo X., Wu Y., Wang S. (2010) GOSemSim: an R package for measuring semantic similarity among GO terms and gene products. Bioinformatics 26, 976–978 [DOI] [PubMed] [Google Scholar]
- 22. Trapnell C., Pachter L., Salzberg S. L. (2009) TopHat: discovering splice junctions with RNA-Seq. Bioinformatics 25, 1105–1111 [DOI] [PMC free article] [PubMed] [Google Scholar]
- 23. Roberts A., Pimentel H., Trapnell C., Pachter L. (2011) Identification of novel transcripts in annotated genomes using RNA-Seq. Bioinformatics 27, 2325–2329 [DOI] [PubMed] [Google Scholar]
- 24. Roberts D. N., Stewart A. J., Huff J. T., Cairns B. R. (2003) The RNA polymerase III transcriptome revealed by genome-wide localization and activity-occupancy relationships. Proc. Natl. Acad. Sci. U. S. A. 100, 14695–14700 [DOI] [PMC free article] [PubMed] [Google Scholar]
- 25. Mimori T., Hardin J. A., Steitz J. A. (1986) Characterization of the DNA-binding protein antigen Ku recognized by autoantibodies from patients with rheumatic disorders. J. Biol. Chem. 261, 2274–2278 [PubMed] [Google Scholar]
- 26. Paillard S., Strauss F. (1991) Analysis of the mechanism of interaction of simian Ku protein with DNA. Nucleic Acids Res. 19, 5619–5624 [DOI] [PMC free article] [PubMed] [Google Scholar]
- 27. Brill S. J., Stillman B. (1989) Yeast replication factor-A functions in the unwinding of the SV40 origin of DNA replication. Nature 342, 92–95 [DOI] [PubMed] [Google Scholar]
- 28. Geiduschek E. P., Kassavetis G. A. (2001) The RNA polymerase III transcription apparatus. J. Mol. Biol. 310, 1–26 [DOI] [PubMed] [Google Scholar]
- 29. Martens J. A., Winston F. (2003) Recent advances in understanding chromatin remodeling by Swi/Snf complexes. Curr. Opin. Genet. Dev. 13, 136–142 [DOI] [PubMed] [Google Scholar]
- 30. Neely K. E., Workman J. L. (2002) The complexity of chromatin remodeling and its links to cancer. Biochim. Biophys. Acta 1603, 19–29 [DOI] [PubMed] [Google Scholar]
- 31. Whitehouse I., Flaus A., Cairns B. R., White M. F., Workman J. L., Owen-Hughes T. (1999) Nucleosome mobilization catalysed by the yeast SWI/SNF complex. Nature 400, 784–787 [DOI] [PubMed] [Google Scholar]
- 32. Geideuschek E. P., Tocchini-Valentini G. P. (1988) Transcription by RNA polymerase III. Annu. Rev. Biochem. 57, 873–914 [DOI] [PubMed] [Google Scholar]
- 33. Longhese M. P., Plevani P., Lucchini G. (1994) Replication factor A is required in vivo for DNA replication, repair, and recombination. Mol. Cell. Biol. 14, 7884–7890 [DOI] [PMC free article] [PubMed] [Google Scholar]
- 34. Daley J. M., Palmbos P. L., Wu D., Wilson T. E. (2005) Nonhomologous end joining in yeast. Annu. Rev. Genet. 39, 431–451 [DOI] [PubMed] [Google Scholar]
- 35. Lee K. K., Sardiu M. E., Swanson S. K., Gilmore J. M., Torok M., Grant P. A., Florens L., Workman J. L., Washburn M. P. (2011) Combinatorial depletion analysis to assemble the network architecture of the SAGA and ADA chromatin remodeling complexes. Mol. Syst. Biol. 7, 503. [DOI] [PMC free article] [PubMed] [Google Scholar]
- 36. Sardiu M. E., Gilmore J. M., Carrozza M. J., Li B., Workman J. L., Florens L., Washburn M. P. (2009) Determining protein complex connectivity using a probabilistic deletion network derived from quantitative proteomics. PloS One 4, e7310. [DOI] [PMC free article] [PubMed] [Google Scholar]
- 37. Squazzo S. L., Costa P. J., Lindstrom D. L., Kumer K. E., Simic R., Jennings J. L., Link A. J., Arndt K. M., Hartzog G. A. (2002) The Paf1 complex physically and functionally associates with transcription elongation factors in vivo. EMBO J. 21, 1764–1774 [DOI] [PMC free article] [PubMed] [Google Scholar]
- 38. Rigobello M. P., Jori E., Carignani G., Pinna L. A. (1982) Isolation and characterization of a type II casein kinase ('casein kinase-TS') from Saccharomyces cerevisiae. FEBS Lett. 144, 354–358 [DOI] [PubMed] [Google Scholar]
- 39. Symington L. S. (2002) Role of RAD52 epistasis group genes in homologous recombination and double-strand break repair. Microbiol. Mol. Biol. Rev. 66, 630–670 [DOI] [PMC free article] [PubMed] [Google Scholar]
- 40. Li X., Heyer W. D. (2008) Homologous recombination in DNA repair and DNA damage tolerance. Cell Res. 18, 99–113 [DOI] [PMC free article] [PubMed] [Google Scholar]
- 41. Van Dyck E., Foury F., Stillman B., Brill S. J. (1992) A single-stranded DNA binding protein required for mitochondrial DNA replication in S. cerevisiae is homologous to E. coli SSB. EMBO J. 11, 3421–3430 [DOI] [PMC free article] [PubMed] [Google Scholar]
- 42. Armstrong J.A., Bieker J.J., Emerson B.M. (1998) A SWI/SNF-related chromatin remodeling complex, E-RC1, is required for tissue-specific transcriptional regulation by EKLF in vitro. Cell 95, 93–104 [DOI] [PubMed] [Google Scholar]
- 43. Ng H. H., Robert F., Young R. A., Struhl K. (2002) Genome-wide location and regulated recruitment of the RSC nucleosome-remodeling complex. Genes Develop. 16, 806–819 [DOI] [PMC free article] [PubMed] [Google Scholar]
- 44. Sabet N., Volo S., Yu C., Madigan J. P., Morse R. H. (2004) Genome-wide analysis of the relationship between transcriptional regulation by Rpd3p and the histone H3 and H4 amino termini in budding yeast. Mol. Cell. Biol. 24, 8823–8833 [DOI] [PMC free article] [PubMed] [Google Scholar]
- 45. Lenstra T. L., Benschop J. J., Kim T., Schulze J. M., Brabers N. A., Margaritis T., van de Pasch L. A., van Heesch S. A., Brok M. O., Groot Koerkamp M. J., Ko C. W., van Leenen D., Sameith K., van Hooff S. R., Lijnzaad P., Kemmeren P., Hentrich T., Kobor M. S., Buratowski S., Holstege F. C. (2011) The specificity and topology of chromatin interaction pathways in yeast. Mol. Cell 42, 536–549 [DOI] [PMC free article] [PubMed] [Google Scholar]
- 46. Arnett D. R., Jennings J. L., Tabb D. L., Link A. J., Weil P. A. (2008) A proteomics analysis of yeast Mot1p protein-protein associations: insights into mechanism. Mol. Cell. Proteomics 7, 2090–2106 [DOI] [PMC free article] [PubMed] [Google Scholar]
- 47. Costanzo M., Baryshnikova A., Bellay J., Kim Y., Spear E. D., Sevier C. S., Ding H., Koh J. L., Toufighi K., Mostafavi S., Prinz J., St Onge R. P., VanderSluis B., Makhnevych T., Vizeacoumar F. J., Alizadeh S., Bahr S., Brost R. L., Chen Y., Cokol M., Deshpande R., Li Z., Lin Z. Y., Liang W., Marback M., Paw J., San Luis B. J., Shuteriqi E., Tong A. H., van Dyk N., Wallace I. M., Whitney J. A., Weirauch M. T., Zhong G., Zhu H., Houry W. A., Brudno M., Ragibizadeh S., Papp B., Pál C., Roth F. P., Giaever G., Nislow C., Troyanskaya O. G., Bussey H., Bader G. D., Gingras A. C., Morris Q. D., Kim P. M., Kaiser C. A., Myers C. L., Andrews B. J., Boone C. (2010) The genetic landscape of a cell. Science 327, 425–431 [DOI] [PMC free article] [PubMed] [Google Scholar]
- 48. Scrima A., Koníckova R., Czyzewski B. K., Kawasaki Y., Jeffrey P. D., Groisman R., Nakatani Y., Iwai S., Pavletich N. P., Thoma N. H. (2008) Structural basis of UV DNA-damage recognition by the DDB1-DDB2 complex. Cell 135, 1213–1223 [DOI] [PMC free article] [PubMed] [Google Scholar]
- 49. Cho R. J., Campbell M. J., Winzeler E. A., Steinmetz L., Conway A., Wodicka L., Wolfsberg T. G., Gabrielian A. E., Landsman D., Lockhart D. J., Davis R. W. (1998) A genome-wide transcriptional analysis of the mitotic cell cycle. Mol. Cell 2, 65–73 [DOI] [PubMed] [Google Scholar]
- 50. Wolfsberg T. G., Gabrielian A. E., Campbell M. J., Cho R. J., Spouge J. L., Landsman D. (1999) Candidate regulatory sequence elements for cell cycle-dependent transcription in Saccharomyces cerevisiae. Genome Res. 9, 775–792 [PMC free article] [PubMed] [Google Scholar]
- 51. Brohée S., Janky R., Abdel-Sater F., Vanderstocken G., André B., van Helden J. (2011) Unraveling networks of co-regulated genes on the sole basis of genome sequences. Nucleic Acids Res. 39, 6340–6358 [DOI] [PMC free article] [PubMed] [Google Scholar]
- 52. Ng A., Bursteinas B., Gao Q., Mollison E., Zvelebil M. (2006) pSTIING: a ‘systems’ approach towards integrating signalling pathways, interaction and transcriptional regulatory networks in inflammation and cancer. Nucleic Acids Res. 34, D527–534 [DOI] [PMC free article] [PubMed] [Google Scholar]
- 53. Parnell T. J., Huff J. T., Cairns B. R. (2008) RSC regulates nucleosome positioning at Pol II genes and density at Pol III genes. EMBO J. 27, 100–110 [DOI] [PMC free article] [PubMed] [Google Scholar]
- 54. Birch J. L., Tan B. C., Panov K. I., Panova T. B., Andersen J. S., Owen-Hughes T. A., Russell J., Lee S. C., Zomerdijk J. C. (2009) FACT facilitates chromatin transcription by RNA polymerases I and III. EMBO J. 28, 854–865 [DOI] [PMC free article] [PubMed] [Google Scholar]
- 55. Mahapatra S., Dewari P. S., Bhardwaj A., Bhargava P. (2011) Yeast H2A.Z, FACT complex and RSC regulate transcription of tRNA gene through differential dynamics of flanking nucleosomes. Nucleic Acids Res. 39, 4023–4034 [DOI] [PMC free article] [PubMed] [Google Scholar]
- 56. Shannon P., Markiel A., Ozier O., Baliga N. S., Wang J. T., Ramage D., Amin N., Schwikowski B., Ideker T. (2003) Cytoscape: a software environment for integrated models of biomolecular interaction networks. Genome Res. 13, 2498–2504 [DOI] [PMC free article] [PubMed] [Google Scholar]
- 57. Smoot M. E., Ono K., Ruscheinski J., Wang P. L., Ideker T. (2011) Cytoscape 2.8: new features for data integration and network visualization. Bioinformatics 27, 431–432 [DOI] [PMC free article] [PubMed] [Google Scholar]