Abstract
OBJECTIVE
To determine the incremental prognostic value of dobutamine stress echocardiography (DSE) at 13-year follow-up (SD 3.2 years) for predicting mortality and cardiac events in diabetic patients.
RESEARCH DESIGN AND METHODS
A total of 396 diabetic patients (mean age 61 ± 11 years; 252 men [64%]) with limited exercise capacity who underwent DSE for evaluation of ischemia were studied. End points were all causes of mortality, cardiac death, and hard cardiac events (cardiac death and nonfatal myocardial infarction).
RESULTS
During a mean follow-up of 13 years, 230 patients (58%) died (121 cardiac deaths), and 30 patients had nonfatal myocardial infarction. Cumulative survival in patients with an abnormal DSE at 5, 10, and 15 years was 68, 49, and 41%, respectively. In patients with a normal DSE, these respective numbers were 74, 57, and 44%. Multivariate analyses showed that DSE provided incremental value over clinical characteristics and stress test parameters for prediction of mortality and cardiac events. Survival analysis showed that DSE provided optimal risk stratification up to 7 years after initial testing; after that period, the risk of adverse outcome increased comparably in both normal and abnormal DSE patients.
CONCLUSIONS
DSE provided restricted predictive value of adverse outcome in patients with diabetes who were unable to perform an adequate exercise stress test. DSE provided optimal risk stratification up to 7 years after initial testing. Repeated DSE at that time might add to its prognostic value.
Coronary artery disease (CAD) is a major cause of mortality and morbidity in diabetic patients (1). To optimize therapeutic intervention, it is essential to identify patients at risk. Exercise stress testing is the most common stress modality used for the noninvasive evaluation of CAD. However, exercise tolerance in diabetic patients may be impaired, particularly because of the higher prevalence of peripheral vascular disease. Dobutamine stress echocardiography (DSE) is used to assess the severity of CAD in patients unable to perform an adequate exercise test. The safety, feasibility, and accuracy of DSE are comparable in diabetic and nondiabetic patients (2). DSE has shown an incremental value in predicting death and hard cardiac events at short- and intermediate-term follow-up (3–5). However, it is not known whether this incremental value can be maintained at long-term follow-up.
The goals of the current study with 13-year follow-up were to 1) assess very long-term outcome after DSE in patients with diabetes, 2) identify predictors of increased risk in patients with diabetes, and 3) define a low-risk period after normal DSE.
RESEARCH DESIGN AND METHODS
This retrospective study included 408 consecutive patients with diabetes who were unable to perform an adequate exercise test and who underwent DSE at the Thoraxcenter between January 1994 and January 2001. Diabetes was defined in the presence of fasting blood glucose ≥140 mg/dL or requirement for insulin or oral hypoglycemic agents. A total of 12 patients were excluded because of inadequate echocardiographic images. The final population of this study consisted of 396 patients.
Clinical data including hypercholesterolemia, smoking, hypertension, a history of heart failure, a previous myocardial infarction (MI), and/or revascularization were collected at the time of DSE. Hypercholesterolemia was defined as total cholesterol >200 mg/dL or use of cholesterol-lowering agents. Hypertension was defined as systolic blood pressure ≥140 mmHg, diastolic blood pressure ≥90 mmHg, or use of antihypertensive medication. Heart failure was defined in line with the New York Heart Association classification. For the clinical characteristics of the patients, we refer to the short-term study of this population done by Sozzi et al. (5) in 2003. Patients who underwent revascularization within 3 months after DSE were excluded. This exclusion was based on previously published data indicating that referral to coronary revascularization within 3 months after testing tends to be based on the results of the test and that referral to revascularization >3 months after the test tends to be based on worsening of the patients clinical status.
DSE protocol
Left ventricular ejection fraction (LVEF) at rest was assessed using the modified biplane Simpson rule (6). After baseline echocardiography, dobutamine was infused at a starting dose of 5 μg/kg/min for 3 min followed by 10 μg/kg/min for 3 min (low-dose stage). The dobutamine dose was increased by 10 μg/kg/min every 3 min up to a maximum dose of 40 μg/kg/min. Atropine (up to 1 mg) was administered intravenously at the end of the last stage if the target heart rate was not achieved. End points of the test were an achievement of the target heart rate (85% of the maximal heart rate predicted for age), the maximal dose of dobutamine and atropine, >2 mV downsloping ST-segment depression measured 80 ms from the J point compared with baseline, hypertension (blood pressure >240/120 mmHg), a decrease in systolic blood pressure of >40 mmHg, and significant arrhythmias.
Echocardiographic imaging and interpretation
Imaging was acquired at rest and continuously during the test and recovery. Images were recorded on videotapes and, in addition, the baseline, low-dose, peak-stress, and recovery images were recorded in a quad-screen format. The interpretation of images was performed by two independent observers blinded to the patients’ clinical data. In case of disagreement, a majority decision was achieved by a third observer. In our laboratory, the inter- and intraobserver agreement for DSE assessments are 92 and 94%, respectively (7). A 16-segment model was used for segmental analysis of LV function (6). Wall Motion Score Index (WMSCI) was determined at rest and peak stress as the sum of the segmental scores of the 16 segments divided by 16. Each segment was scored using a 5-point Likert scale as follows: 1 = normal, 2 = mild hypokinesis, 3 = severe hypokinesis, 4 = akinesis, and 5 = dyskinesis. Ischemia was defined as new or worsened wall motion abnormalities (WMAs) during stress, which was indicated by an increase of wall motion score ≥1 grade in ≥1 segment (8). Ischemia was not considered to be present when akinetic segments at rest became dyskinetic during stress. DSE results were defined as abnormal if there was ischemia during stress (9) or fixed WMAs (8).
Follow-up
Patients were contacted to retrieve follow-up information twice, in 2001 and in 2010. Prior to contacting them, the on-line municipal civil registry was used to determine the patients’ present survival status. Survival status was retrieved in 100% of the patients. A mailed questionnaire was sent to all living patients. The response rate of the questionnaire was 85%. There were no significant differences between patients who responded to the survey and those who did not respond. This questionnaire was used together with medical records to obtain information about end points. The end points considered were all-cause mortality, cardiac death, and hard cardiac events (defined as nonfatal MI and cardiac death). Causes of death were obtained from the Central Bureau of Statistics Netherlands. Deaths were classified as either documented cardiac death or other. Nonfatal MI was confirmed by using clinical and electrocardiographic criteria and a typical rise and fall of cardiac markers.
Statistical analysis
Continuous variables were reported as mean ± SD and compared with Student t test. Categorical variables were summarized as percentages; the χ2 test was used to compare groups. Cumulative survival was estimated by the Kaplan-Meier method, with comparisons between groups based on the log-rank test. Cox proportional hazards regression model was used to examine the additional value of DSE with the end points of interest at 7, 8, and 15 years after the test. Variables were selected in a stepwise forward selection manner with entry and retention set at a significance level of 0.05. The incremental value of DSE information over clinical data was assessed in two modeling steps. First, clinical data only were selected to fit a multivariable model. These clinical data were then used as baseline risk factors, and DSE variables were added in a stepwise forward selection manner. The incremental value was determined by comparing the log likelihood χ2 values of both prediction models.
RESULTS
Dobutamine-atropine induced a significant increase of heart rate (from 77 ± 13 at rest to 132 ± 16 bpm at peak dose, P < 0.0001), whereas systolic blood pressure did not increase (137 ± 27 at rest and 136 ± 32 mmHg at peak stress). Atropine was administered in 179 patients (45%). Angina occurred in 89 patients (22%), and ST-segment depression occurred in 61 patients (15%). Reasons for termination of the test were achievement of the target heart rate in 320 patients (81%), angina in 42 patients (11%), ST-segment depression in 22 patients (5%), hypotension in 7 patients (2%), and ventricular arrhythmia in 5 patients (1%).
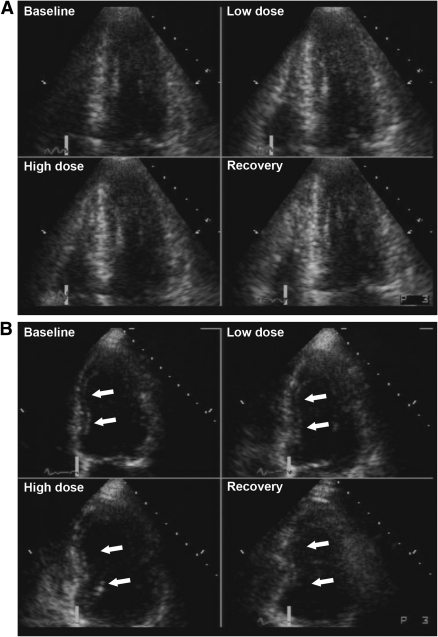
Resting WMAs were detected in 292 patients (74%), and 176 (60%) of these patients had a history of previous MI. Ischemia was detected in 141 patients (36%), and 125 (89%) of these patients had resting WMAs as well. Examples of normal and abnormal DSE studies are presented in Fig. 1.
Figure 1.
A: Example of a normal dobutamine stress echocardiogram. The standard display format shows the apical four-chamber view at end systole, demonstrating normal LV wall motion and thickening at baseline, and further improvement of wall motion and thickening (hyperkinesia) during low- and high-dose dobutamine infusion, and recovery phase. This quad-screen format is also used for the apical two-chamber view, apical three-chamber view, and parasternal short-axis view. B: Example of an abnormal dobutamine stress echocardiogram (the apical four-chamber view at end systole). The interventricular septum is hypokinetic at rest, becomes normokinetic during low-dose dobutamine infusion, and becomes akinetic during high-dose dobutamine infusion and during the recovery phase. This biphasic response during DSE is indicative of significant CAD, probably in the left anterior descending artery. C: Example of an abnormal dobutamine stress echocardiogram. The baseline apical four-chamber view shows akinesia in the interventricular septum and apex. During low- and high-dose dobutamine infusion and recovery, no change in wall motion and thickening occurs in these akinetic regions. This dobutamine stress echocardiogram is indicating a previous MI, without signs of myocardial ischemia.
Outcome
During a mean follow-up of 13 years (SD 3.2), 230 patients (58%) died (121 cardiac deaths), 30 patients (8%) had a nonfatal MI, and 86 (22%) underwent myocardial revascularization. A total of 50 and 45, respectively, underwent percutaneous coronary intervention and coronary artery bypass procedures during follow-up, of whom 9 had both. Among the 141 patients with ischemia by DSE, 62 underwent subsequent revascularization (72% of the total patients revascularized). The remaining patients with ischemia were treated medically.
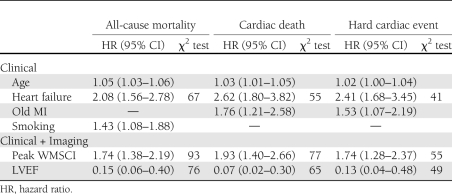
Clinical and DSE variables associated with an increased risk of all end points of interest in the multivariate model analysis are presented in Table 1. WMSCI at peak-dose dobutamine and LVEF at rest added incremental value to the clinical parameters in predicting all-cause mortality (67 to 93 [P < 0.0001] and 76 [P < 0.0001], respectively). The additional value of DSE, however, did not increase any further after 7 years after the test for all end points of interest. Multivariate analysis showed that WMA at rest, new or worsened WMA, and these DSE parameters combined did not significantly improve the prediction model for adverse outcome.
Table 1.
Independent predictors of all-cause mortality, cardiac death, and hard cardiac events using a two-step model
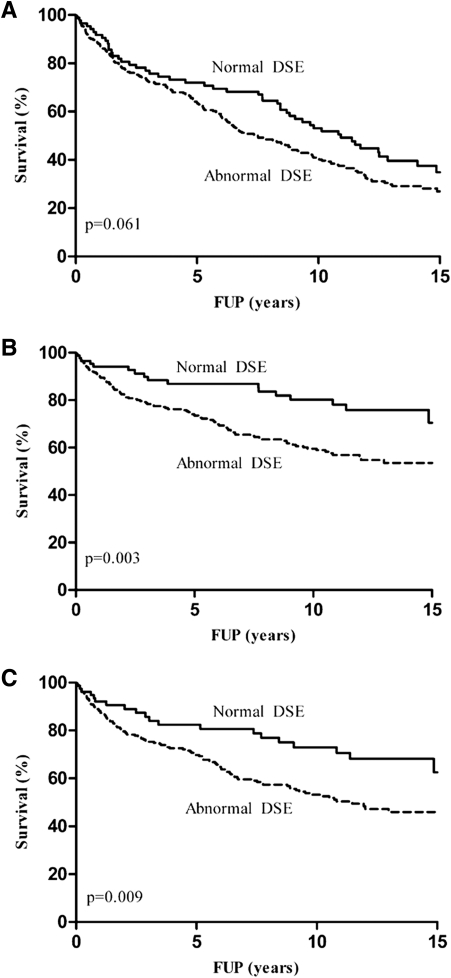
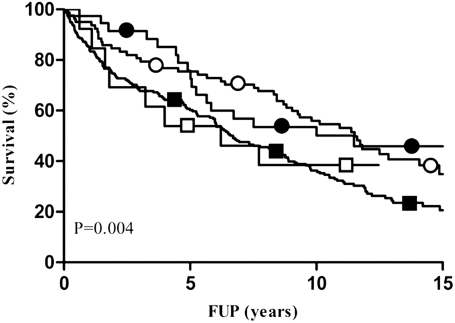
The cumulative survival showed a better, although not significant, survival of normal DSE in comparison with abnormal DSE (74 vs. 68% at 5 years, 57 vs. 49% at 10 years, and 44 vs. 41% at 15 years; overall P = 0.06) (Fig. 2A). Figure 2B and C, respectively, shows the event-free survival curves for cardiac death and hard cardiac events with normal versus abnormal DSE. Both cumulative survival free of cardiac death (89 vs. 78% at 5 years, 84 vs. 69% at 10 years, and 81 vs. 66% at 15 years; overall P = 0.003) and hard cardiac events (84 vs. 75% at 5 years, 81 vs. 65% at 10 years, and 77 vs. 63% at 15 years; overall P = 0.009) show a significantly better prognosis in favor of a normal DSE. The interaction between LVEF and peak WMSCI is shown in Fig. 3.
Figure 2.
Kaplan-Meier survival curves with normal vs. abnormal DSE for all end points of interest. A: All-cause mortality: normal 88, 58, 41, and 12; abnormal 308, 164, 99, and 20 patients at risk at start, 5-, 10-, and 15-year follow-up (FUP), respectively. B: Cardiac death: normal 88, 58, 41, and 12; abnormal 308, 164, 99, and 20 patients at risk at start, 5-, 10-, and 15-year FUP, respectively. C: Hard cardiac events: normal 79, 48, 32, and 10; abnormal 296, 146, 82, and 20 patients at risk at start, 5-, 10-, and 15-year FUP, respectively.
Figure 3.
Kaplan-Meier survival curves demonstrating the interaction between peak WMSCI and LVEF. Group 1: ○, LVEF ≥50% and peak WMSCI = 1; 82, 58, 42, and 10 patients at risk at start, 5-, 10-, and 15-year follow-up (FUP), respectively. Group 2: □, LVEF <50% and peak WMSCI = 1; 13, 7, 5, and 0 patients at risk at start, 5-, 10-, and 15-year FUP, respectively. Group 3: ●, LVEF ≥50% and peak WMSCI >1; 39, 24, 15, and 7 patients at risk at start, 5-, 10-, and 15-year FUP, respectively. Group 4: ■, LVEF <50% and peak WMSCI >1; 240, 120, 67, and 10 patients at risk at start, 5-, 10-, and 15-year FUP, respectively.
CONCLUSIONS
DSE is widely used for diagnosis and risk stratification, but the very long-term prognostic value of this test in patients with diabetes is not defined. Accurate long-term risk stratification of these patients is required to optimize patient management. Patients with normal DSE are considered at low risk of cardiac events; the annualized event rate is generally <1% during the first years after testing. Accordingly, in these low-risk patients, further (invasive) diagnostic and therapeutic strategies and associated medical care costs can be avoided.
Still, over time, a significant change in risk may occur after a normal DSE. The underlying clinical risk of patients with diabetes and history of CAD may significantly influence the event rate after a normal DSE. These observations have lead to the perception that a “warranty period” exists after a normal DSE. In the currently available literature, mean follow-up after DSE was ∼3 years. Very long-term outcome data after DSE are lacking and, consequently, the duration of the low-risk status after a normal test is not clear.
This study is a continuation of the 2003 study of Sozzi et al. (5) in which the same population of 396 patients with diabetes was evaluated, with a median follow-up of 3 years. The current study assesses the very long-term outcome after DSE in patients with diabetes and shows that DSE provides restricted predictive value of adverse outcome in patients with diabetes at very long mean follow-up of 13 ± 3.2 years. The prognostic value of DSE was optimal till ∼7 years after the initial test. DSE provided data in predicting all-cause mortality incremental to clinical parameters and increased the χ2 of the clinical and exercise electrocardiogram model from 67 to 93 (P < 0.0001) at 15-year follow-up, but the additional value of DSE did not increase any further after 7 years after the test. This is in line with the Kaplan-Meier survival curves, which diverge until ∼7 years. After that point, the lines start to run parallel. The most powerful echocardiographic predictor of outcome was peak WMSCI, with LVEF at rest coming up second. Multivariate analysis showed that peak WMSCI and LVEF were independent predictors of long-term outcome. Kaplan-Meier survival analysis (Fig. 3) showed that patients with LVEF ≥50% and peak WMSCI = 1 had a favorable prognosis, whereas patients with LVEF <50% and peak WMSCI >1 had an adverse long-term prognosis. Patients with LVEF ≥50% and peak WMSCI >1 and those with LVEF <50% and peak WMSCI <1 had an intermediate prognosis. The survival curves continued to diverge up to ∼7 years, implying that the incremental prognostic value of both LVEF and peak WMSCI was maintained up to 7 years after initial testing. These findings indicate that the prognosis in diabetic patients is related not only to the extent of stress-induced ischemia but also to LV function at rest. Similar DSE results were found for the end points cardiac death and hard cardiac events.
In 74% of the population, fixed WMA were found. It is likely that this high number has to do with the fact that our population consists of patients with impaired exercise capability, with a great portion of patients with a history of MI. Furthermore, it is well established that diabetes could result in myocardial dysfunction even in the absence of CAD. This could explain the high incidence of resting WMAs in this study.
We currently are not aware of any other study that has evaluated the prognostic value of DSE after such an extended follow-up time. Several studies prove that DSE is a useful tool for short- to medium-term risk stratification of diabetic patients. Bigi et al. (10) reported in 2001 that peak WMSCI was a significant predictor of hard cardiac events in a population of 259 diabetic patients at 2-year follow-up. D’Andrea et al. (11) concluded the same in 2003 in a population of 325 diabetic patients at a follow-up of 2.8 years. Both studies are in line with our long-term study. In 2006, Cortigiani et al. (12) compared the prognostic value of dipyridamole and DSE in 749 diabetic patients with 4,707 nondiabetic patients with known or suspected CAD during a median time of 2.6 years. In the diabetic population, resting WMSCI and ischemia at stress echo were the DSE variables with incremental value.
Chaowalit et al. (3) verified the prognostic significance of DSE in predicting mortality and cardiovascular morbidity during a mean period of 5.4 years in a large cohort (N = 2,349) of patients with diabetes in 2006. In multivariate analyses, age, failure to achieve target heart rate, and the percentage of ischemic segments were important predictors of both mortality and cardiovascular morbidity (nonfatal MI and late revascularization). Innocenti et al. (4) assessed the prognostic role of clinical, rest, and stress echocardiographic data in a group of 322 diabetic patients with known or suspected CAD during a mean follow-up duration of 3.3 years (4). This study shows that presence of viability and severe ischemia during DSE was independently associated with higher occurrence of hard cardiac events.
The current study has limitations. The long-term prognostic value of the test is based on a population referred to DSE for clinical indications. Because of the clinical factors leading patients to be referred for DSE at the time of initial testing, they are likely to have had increased risk. This may limit application of the present findings to patients with diabetes in general. The results may not be necessarily applicable to patients with diabetes and without clinical indication for DSE. Therefore, the use of DSE for risk stratification of all patients with diabetes cannot be recommended.
Exercise or pharmacologic stress myocardial perfusion imaging has been recommended by the American Heart Association for evaluation of ischemic heart disease in diabetic patients (13). However, DSE has the advantages of wider availability and lower cost, and it avoids radiation exposure to the patient. Appropriateness criteria have been developed to provide an estimate of the reasonableness of the use of DSE for several clinical scenarios. A detailed description of appropriate indications of DSE has been published recently (14), including detection of CAD/risk assessment in selected asymptomatic and symptomatic patients, preoperative evaluation before noncardiac surgery, risk assessment after acute coronary syndrome/postrevascularization, assessment of viability/ischemia, and stress study for hemodynamics.
In conclusion, in this study with a mean follow-up of 13 ± 3.2 years, DSE provided restricted predictive value of adverse outcome in patients with diabetes who were unable to perform an adequate exercise stress test. The value of the test seems optimal till ∼7 years after initial DSE. Repeating the test at that time might add to its diagnostic value.
Acknowledgments
No potential conflicts of interest relevant to this article were reported.
J.N.v.d.S. acquired, analyzed, and interpreted data and wrote the manuscript. H.J.B. acquired data and contributed to revising the manuscript critically for important intellectual content. F.B.S. acquired, analyzed, and interpreted data and revised the manuscript critically for important intellectual content. A.E. contributed to the conception and design of the manuscript and the interpretation of data and revised the manuscript critically for important intellectual content. R.T.v.D. and A.F.L.S. contributed to the analysis and interpretation of data and reviewed and edited the manuscript. All authors approved the final version of the article. A.F.L.S. is the guarantor of this work and, as such, had full access to all the data in the study and takes responsibility for the integrity of the data and the accuracy of the data analysis.
References
- 1.Kannel WB, McGee DL. Diabetes and cardiovascular risk factors: the Framingham study. Circulation 1979;59:8–13 [DOI] [PubMed] [Google Scholar]
- 2.Elhendy A, van Domburg RT, Poldermans D, et al. Safety and feasibility of dobutamine-atropine stress echocardiography for the diagnosis of coronary artery disease in diabetic patients unable to perform an exercise stress test. Diabetes Care 1998;21:1797–1802 [DOI] [PubMed] [Google Scholar]
- 3.Chaowalit N, Arruda AL, McCully RB, Bailey KR, Pellikka PA. Dobutamine stress echocardiography in patients with diabetes mellitus: enhanced prognostic prediction using a simple risk score. J Am Coll Cardiol 2006;47:1029–1036 [DOI] [PubMed] [Google Scholar]
- 4.Innocenti F, Agresti C, Baroncini C, et al. Prognostic value of dobutamine stress echocardiography in diabetic patients. Int J Cardiovasc Imaging 2010;26:499–507 [DOI] [PubMed] [Google Scholar]
- 5.Sozzi FB, Elhendy A, Roelandt JR, et al. Prognostic value of dobutamine stress echocardiography in patients with diabetes. Diabetes Care 2003;26:1074–1078 [DOI] [PubMed] [Google Scholar]
- 6.Schiller NB, Shah PM, Crawford M, et al. Recommendations for quantitation of the left ventricle by two-dimensional echocardiography. American Society of Echocardiography Committee on Standards, Subcommittee on Quantitation of Two-Dimensional Echocardiograms. J Am Soc Echocardiogr 1989;2:358–367 [DOI] [PubMed] [Google Scholar]
- 7.Bellotti P, Fioretti P, Forster T, et al. Reproducibility of the dobutamine-atropine echocardiography stress test. Echocardiography 1993;10:93–97 [Google Scholar]
- 8.Poldermans D, Fioretti PM, Boersma E, et al. Long-term prognostic value of dobutamine-atropine stress echocardiography in 1737 patients with known or suspected coronary artery disease: A single-center experience. Circulation 1999;99:757–762 [DOI] [PubMed] [Google Scholar]
- 9.Arnese M, Fioretti PM, Cornel JH, Postma-Tjoa J, Reijs AE, Roelandt JR. Akinesis becoming dyskinesis during high-dose dobutamine stress echocardiography: a marker of myocardial ischemia or a mechanical phenomenon? Am J Cardiol 1994;73:896–899 [DOI] [PubMed] [Google Scholar]
- 10.Bigi R, Desideri A, Cortigiani L, Bax JJ, Celegon L, Fiorentini C. Stress echocardiography for risk stratification of diabetic patients with known or suspected coronary artery disease. Diabetes Care 2001;24:1596–1601 [DOI] [PubMed] [Google Scholar]
- 11.D’Andrea A, Severino S, Caso P, et al. Prognostic value of pharmacological stress echocardiography in diabetic patients. Eur J Echocardiogr 2003;4:202–208 [DOI] [PubMed] [Google Scholar]
- 12.Cortigiani L, Bigi R, Sicari R, Landi P, Bovenzi F, Picano E. Prognostic value of pharmacological stress echocardiography in diabetic and nondiabetic patients with known or suspected coronary artery disease. J Am Coll Cardiol 2006;47:605–610 [DOI] [PubMed] [Google Scholar]
- 13.Grundy SM, Benjamin IJ, Burke GL, et al. Diabetes and cardiovascular disease: a statement for healthcare professionals from the American Heart Association. Circulation 1999;100:1134–1146 [DOI] [PubMed] [Google Scholar]
- 14.Douglas PS, Khandheria B, Stainback RF, et al. ; American College of Cardiology Foundation Appropriateness Criteria Task Force; American Society of Echocardiography; American College of Emergency Physicians; American Heart Association; American Society of Nuclear Cardiology; Society for Cardiovascular Angiography and Interventions; Society of Cardiovascular Computed Tomography; Society for Cardiovascular Magnetic Resonance ACCF/ASE/ACEP/AHA/ASNC/SCAI/SCCT/SCMR 2008 appropriateness criteria for stress echocardiography: a report of the American College of Cardiology Foundation Appropriateness Criteria Task Force, American Society of Echocardiography, American College of Emergency Physicians, American Heart Association, American Society of Nuclear Cardiology, Society for Cardiovascular Angiography and Interventions, Society of Cardiovascular Computed Tomography, and Society for Cardiovascular Magnetic Resonance: endorsed by the Heart Rhythm Society and the Society of Critical Care Medicine. Circulation 2008;117:1478–1497 [DOI] [PubMed] [Google Scholar]


