Abstract
KCNE2 functions as an auxiliary subunit in voltage-gated K and HCN channels in the heart. Genetic variations in KCNE2 have been linked to long QT syndrome. The underlying mechanisms are not entirely clear. One of the issues is whether KCNE2 protein is expressed in ventricles. We use adenovirus-mediated genetic manipulations of adult cardiac myocytes to validate two antibodies (termed Ab1 and Ab2) for their ability to detect native KCNE2 in the heart. Ab1 faithfully detects native KCNE2 proteins in spontaneously hypertensive rat and guinea pig hearts. In both cases, KCNE2 protein is more abundant in ventricles than in atria. In both ventricular and atrial myocytes, KCNE2 protein is preferentially distributed on the cell surface. Ab1 can detect a prominent KCNE2 band in human ventricular muscle from nonfailing hearts. The band intensity is much fainter in atria and in failing ventricles. Ab2 specifically detects S98 phosphorylated KCNE2. Through exploring the functional significance of S98 phosphorylation, we uncover a novel mechanism by which KCNE2 modulates the human ether-a-go-go related gene (hERG) current amplitude: by accelerating hERG protein degradation and thus reducing the hERG protein level on the cell surface. S98 phosphorylation appears to be required for this modulation, so that S98 dephosphorylation leads to an increase in hERG/rapid delayed rectifier current amplitude. Our data confirm that KCNE2 protein is expressed in the ventricles of human and animal models. Furthermore, KCNE2 can modulate its partner channel function not only by altering channel conductance and/or gating kinetics, but also by affecting protein stability.
Keywords: cardiac electrophysiology, long QT syndrome, rapid delayed rectifier channel, pulse-chase experiments
kcne2 (also called mink-related peptide 1 or MiRP1) is a member of the KCNE subfamily of auxiliary subunits (Fig. 1A). KCNE2 was cloned and characterized by Abbott et al. (1). The authors proposed that KCNE2 could associate with the channel encoded by human ether-a-go-go related gene (hERG) to form the native rapid delayed rectifier K+ channel (IKr) in the heart (1). Genetic variations in KCNE2 have been linked to long QT syndrome (LQT6) (1, 25), pointing to its role in maintaining the electrical stability of human ventricles. However, the underlying mechanisms are not clear. Some (2, 14), although not all (21), studies have shown that the mRNA level of KCNE2 is much lower than those of the other KCNE subunits in human hearts, and the KCNE2 mRNA level is much lower in ventricles than in atria. These, and several other studies (19, 20), have created the impression that KCNE2 expression in human heart is limited to pacemaker regions (sinoatrial node and Purkinje fiber) and atrial myocytes. Consequently, it is proposed that KCNE2 expression in human ventricular myocytes is very low and functionally insignificant, making it difficult to explain why genetic variations in KCNE2 are linked to LQT6.
Fig. 1.
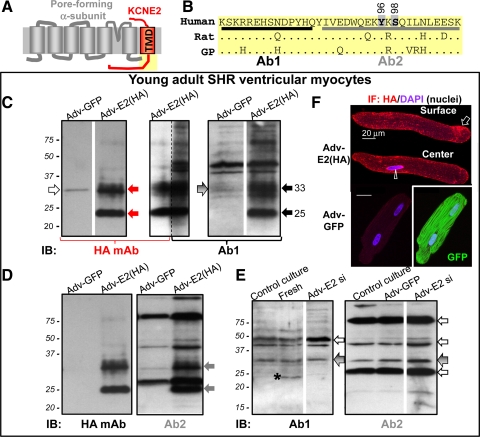
Detecting KCNE2 by 2 antibodies, Ab1 and Ab2. A: transmembrane topology of KCNE2 and a pore-forming α-subunit. B: Ab1 and Ab2 epitopes in the human KCNE2 post-transmembrane domain (TMD) region (yellow shading in A). The human sequence is aligned with those of rat and guinea pig (GP); dot (.) denotes same residue as in the human sequence. Two potential phosphorylation sites in the Ab2 epitope region, Y96 and S98, are marked. C–F: probing KCNE2 expression in young adult (4 to 5 mo) spontaneously hypertensive rat (SHR) ventricular myocytes. SHR myocytes are cultured in serum-free medium for 3 days under the control conditions (control culture) or after overnight incubation with adenovirus carrying green fluorescent protein (Adv-GFP), HA-tagged KCNE2 [Adv-E2 (HA)], or a short hairpin sequence targeting rat KCNE2 nucleotides 319–340 (Adv-E2 si). C–E: immunoblots (IB) of whole cell lysates (WCL) from myocytes in control culture or incubated with adenovirus marked on top. Fresh in E is whole tissue lysate (WTL) prepared from freshly isolated SHR ventricular myocardium. The antibodies used for IB are marked below the images. In C, the central lane is split into 2 and probed with HA mAb (left half) and Ab1 (right half). Size marker positions are marked at left. Solid arrows point to the 2 major HA-tagged KCNE2 bands of 33 and 25 kDa, detected by HA mAb (red arrows; C), Ab1 (black arrows; C), and Ab2 (gray arrows; D). Open arrows point to unrelated proteins detected by HA mAb (C) and by Ab1 or Ab2 (E). Arrows with gradient shade point to the 33-kDa band seen in SHR ventricular myocytes not expressing HA-tagged KCNE2 (C, right, and E). *Highlights the 24-kDa band in WTL from freshly isolated myocardium that is missing in ventricular myocytes after culture under the control conditions (in E). Some lanes are cut and pasted together to avoid showing irrelevant lanes (marked by white stripes between pasted lanes). F: HA immunofluorescence (IF; stained with Alexa647) and 4',6-diamidino-2-phenylindole (DAPI) fluorescence (nuclei) from a myocyte expressing HA-tagged KCNE2 (top) and a myocyte expressing GFP (bottom). In the former case, arrow and arrowhead point to HA IF on cell surface and in perinuclear region. In the latter case, there is no Alexa647 signal but strong GFP signal.
Previously, we used a homemade antibody and a commercial antibody (Alomone catalog No. APC-054) to probe KCNE2 protein expression in the ventricles of human and animal models (rat and dog) (10). We called these antibodies Ab1 and Ab2, respectively. Their epitope sequences are shown in Fig. 1B [based on the human sequence, well conserved in rat, dog, guinea pig, and other species (10)]. We showed that both Ab1 and Ab2 detected a major 25-kDa band in human and rat ventricles, but a 20-kDa band in dog ventricles. In the case of Ab2, the bands can be abolished by preincubating the antibody with excess antigen. We further used Ab2 immunoblot quantification to suggest that KCNE2 expression in the ventricle can be differentially remodeled under different diseased conditions. This implies that aberrant KCNE2 expression may play a role in acquired ventricular arrhythmias.
The aforementioned uncertainty in the literature about KCNE2 protein expression in the ventricle prompted us to revisit this issue. In particular, we want to know whether indeed KCNE2 protein is mainly or preferentially expressed in atria but not or very low in ventricles. We are further motivated by two other concerns. The first one is the variation in the apparent KCNE2 molecular mass in immunoblots. Core KCNE2 proteins in different species are 123 aa in length, and the molecular masses range from 14.4 to 14.6 kDa. As mentioned above, the major band detected by Ab2 is 25 kDa in human and rat ventricles but 20 kDa in dog ventricles. Does KCNE2 experience species- or cell type-dependent posttranslational modifications, or could there be artifact(s)? The second concern is about Ab2 validation by antigen preabsorption: unrelated proteins may share sequence homology or conformation similarities with the epitope region in KCNE2, and specifically bind to the antibody.
Our strategy to reinvestigate the issues of KCNE2 protein expression in the heart is to use adenovirus-mediated genetic manipulations of adult cardiac myocytes. We overexpress hemagglutinin (HA) epitope-tagged KCNE2 in adult cardiac myocytes, where native-like posttranslational modifications can occur. The HA epitope allows us to use a monoclonal antibody (HA mAb) to unequivocally detect the exogenously expressed KCNE2 protein with native-like posttranslational modifications. This can then be used to check whether Ab1 and Ab2 can detect the same band(s). If the results are positive, we then check whether the native KCNE2 is at a level detectable by Ab1 and Ab2, noting that the native KCNE2 band(s) should be 1 kDa lighter than its HA-tagged counterpart and is expected to be fainter. To help distinguish between native KCNE2 band(s) and unrelated bands, we use adenovirus-mediated expression of small interfering RNA to knock down the expression of native KCNE2 in adult cardiac myocytes. By comparing the immunoblot banding patterns between control myocytes and myocytes with KCNE2 knockdown, we hope to unequivocally validate (or refute) KCNE2 band(s) detected by Ab1 and Ab2.
Our data show that Ab1 can detect native KCNE2 proteins in rat and guinea pig hearts, and in both cases, the KCNE2 protein level is more abundant in ventricles than in atria. Ab1 can also detect native KCNE2 protein in ventricles of nonfailing human hearts. On the other hand, although Ab2 can detect native KCNE2 proteins in the heart, it also detects a major unrelated protein right above the 24 kDa validated KCNE2 band. Despite this problem, Ab2 is useful in another way: it can detect the phosphorylation status of a serine residue (S98) in the epitope region of KCNE2. We show that KCNE2 can suppress hERG current amplitude by accelerating hERG protein degradation, and S98 phosphorylation seems necessary for this effect of KCNE2.
MATERIALS AND METHODS
Human and animal subjects.
Use of human heart specimens and laboratory animals [guinea pigs, spontaneously hypertensive rats (SHR), and dogs] was reviewed annually and approved by the Institutional Review Board and Institutional Animal Care and Use Committee of Virginia Commonwealth University. We use right atrial appendages from patients undergoing elective surgery (removed for lung-heart bypass surgery) and ventricular specimens from end-stage heart failure patients (removed for implantation of left ventricular assist device) or nonfailing donor hearts (not suitable for transplantation).
Cardiac myocyte isolation, culture, adenovirus infection, and canine model of microembolization.
Atrial and ventricular myocytes are isolated from guinea pig and SHR hearts using enzymatic digestion followed by gentle trituration as described previously (9). Isolated myocytes are plated on laminin-coated coverslips and maintained in serum-free medium 199, supplemented with BSA, l-carnitine, creatine, taurine, penicillin-streptomycin as described previously (3) in a moist 5% CO2 incubator at 36°C for up to 3 days. Approximately 6 h after isolation, adenovirus carrying green fluorescent protein (GFP) reporter (Adv-GFP), HA-tagged KCNE2 [Adv-E2(HA)], or a short hairpin construct targeting rat KCNE2 nucleotides 319–440 (Adv-E2 si) are added to reach ∼5 × 10⁶ plaque-forming units (PFU)/ml and incubated overnight. Afterward, adenoviruses are removed and the myocyte culture is continued for another 24 h before experiments.
A canine model of microembolization is produced using male mongrels of 23–27 kg, by repetitive intracoronary injections of ∼4 × 10⁴ microspheres (77–102 μm diameter, in 0.5–1 ml saline) once every 2 to 3 wk, alternating between left anterior descending and left circumflex coronary arteries, until left ventricular ejection fraction drops to ≤35%. About 3 mo after the last injection, left ventricular ejection fraction is decreased from 60 ± 5% to 28 ± 7%. Tissue samples are removed from the left ventricular apex of microembolized and control dogs for immunoblotting analysis.
Molecular biology: mutations, cRNA, and cDNA preparation.
The following channel subunits are used: human KCNE2, hERG, and rat Kv4.3. Point-mutations of KCNE2 are created using oligonucleotide-directed method with a commercial kit (Alter site II in vitro Mutagenesis System; Promega). All mutations are confirmed by direct DNA sequencing. cRNAs are in vitro transcribed using the mMessage mMachine kit (Ambion). For coexpression experiments, the concentrations of cRNAs or cDNAs are quantified by densitometry on ethidium bromide gels using known amounts of size markers as references. The amount of nanograms cRNA injected per oocyte or micrograms cDNA transfected per dish is divided by the cRNA or cDNA band size (in kb), and the ratio of such parameters represents the cRNA or cDNA molar ratio.
COS-7 culture, cDNA transfection, and patch clamp experiments.
COS-7 cells are maintained in DMEM (Gibco) supplemented with 10% fetal calf serum (Hyclone) and penicillin-streptomycin, in a moist 5% CO2 incubator at 36°C. Cells are plated at a subconfluence level the day before transfection. cDNA transfection is facilitated by lipofectamine 2000 (Invitrogen) based on manufacturer's instructions. COS-7 cells destined for patch clamp experiments are cotransfected with CD8 cDNA. COS-7 cells are incubated with CD8 mAb-coated beads at room temperature for 10 min, trypsin-digested, plated on poly-L-lysine coated coverslip placed in a cell chamber mounted on the stage of Nikon inverted microscope, and continuously superfused at room temperature with normal Tyrode's solution of (in mM) 146 NaCl, 4 KCl, 2 CaCl2, 0.5 MgCl2, 5 HEPES, and 5.5 dextrose (pH 7.3). Cells decorated with beads are used for patch clamp recording using an AxoClamp 200B amplifier. Pipette solution contains (in mM) 105 K-aspartate, 20 KCl, 5 ATP(K), 1 MgCl2, 5 EGTA, and 5 HEPES (pH 7.3). Data acquisition is controlled by Clampex of pClamp10 via a DigiData 1440A interface. Current traces are low-pass (1 kHz) filtered and digitized. Offline data analysis is done using Clampfit in conjunction with Microsoft Excel, SigmaPlot, and SigmaStat.
Oocyte preparation, cRNA injection, and two-electrode voltage clamp experiments.
Oocytes are isolated as described before (27) and incubated in an ND96-based medium containing (in mM) 96 NaCl, 2 KCl, 1.8 CaCl2, 1 MgCl2, 5 HEPES, and 2.5 Na-pyruvate (pH 7.5) supplemented with 4% horse serum and penicillin-streptomycin at 16°C. Two to six hours after isolation, oocytes are injected with cRNA(s) using a Drummond digital microdispenser.
Oocytes are incubated in the above medium at 16°C and studied 3–5 days after isolation. Whole oocyte membrane currents are recorded using the 2-cushion pipette voltage clamp method (24). Both current-passing and voltage-recording pipettes have tip resistance 0.1–0.3 MΩ. During recordings, the oocyte is continuously superfused with a low-Cl ND96 solution to reduce interference from endogenous Cl channels. Voltage clamp is done at room temperature with OC-725B or OC-725C amplifier (Warner Instruments). Data acquisition and analysis are the same as those described for COS-7 patch clamp experiments.
Pulse chase experiments.
Twenty-four hours after transfection, COS-7 cells are depleted of methionine (Met) by incubation in serum-free, Met-free DMEM medium for 30 min at 36°C. 35S-Met (200 uCi/ml, [Met] ∼0.2 mM) is then added, and cells are incubated for 60 min at 36°C. Afterward, cells are washed and incubated in DMEM containing 2 mM unlabeled Met for different amounts of chase time. At the end of specified chase times, cells are washed, lysed, and solubilized (described below). The whole cell lysate (WCL) is subjected to immunoprecipitation as described previously (9). The original WCLs and immunoprecipitates are fractionated by SDS-PAGE (described below). Part of the proteins is blotted to polyvinylidene difluoride (PVDF) membrane and probed by suitable Abs. The radioactivity of proteins in the gels is quantified by Phosphoimager.
Biotinylation experiments.
Forty-eight hours after cDNA transfection of COS-7 cells, or cRNA injection of oocytes, cells or oocytes are washed with cold PBS twice, followed by incubation in 0.25 mg/ml amine-reactive, disulfide bond containing biotin derivative (EZ-link sulfo-NHS-SS-biotin; Pierce) on ice for 30 min. The biotinylation reaction is quenched by 25 mM Tris·HCl. Cells or oocytes are washed and lysed as described below. The protein concentrations in WCLs are measured. For each sample, 10% of WCL is saved as direct input for the following immunoblot experiments. To the remaining WCL, a slurry of NeutrAvidin agarose beads is added at 50 μl beads/200 μg protein, and the mixture is incubated at 4°C overnight. The beads are collected and washed with lysis buffer six times. Biotinylated proteins are eluted by incubating beads in sample buffer containing mercaptoethanol. Biotinylated fractions and direct inputs are fractionated by SDS-PAGE.
SDS-PAGE, immunoblotting, and related experiments.
Cultured myocytes or COS-7 cells are sonicated, and the suspension is centrifuged at slow speed to remove nuclei and particles. The supernatant is solubilized in a buffer containing 1% Triton X-100, 50 mM Tris·HCl (pH 8.0), 150 mM NaCl, 1 mM EDTA, 1 mg/ml BSA, and protease inhibitor cocktail. After centrifugation to remove debris, the supernatant is collected as WCL. Oocytes are homogenized with a loose-fit glass homogenizer in a buffer containing protease inhibitors. After low-speed centrifugation to remove nuclei and particles, the supernatant is solubilized by 1% Triton X-100. After centrifugation to remove debris, the supernatant is collected as WCL. Frozen cardiac tissue chunks are pulverized in 10 vol of lysis buffer containing (in mM) 145 NaCl, 0.1 MgCl2, 15 HEPES, 10 EGTA (pH 7), and 0.5 Triton X-100, with protease inhibitor cocktail, and solubilized for 30 min on ice. The above is homogenized by tip sonicator (2 of 15-s bursts) and then centrifuged to pellet nuclei and particles. The supernatant is collected as whole tissue lysate (WTL) (18). Protein concentrations in WCL and WTL are quantified using BCA kit (Pierce).
In vitro translation is carried out using a rabbit reticulocyte lysate system in the presence of canine pancreatic microsomes (Promega), according to the manufacturer's instructions. Deglycosylation with PNGase F (Sigma-Aldrich) is carried out based on manufacturer's instructions. Dephosphorylation is carried out by adding 20 μl of reaction buffer containing (in mM) 50 Tris·HCl, 10 MgCl2, 100 NaCl, and 1 DTT to 20 μg of protein (in 5 μl Tris-EDTA buffer). The mix is incubated with 2 units of calf intestinal phosphatase (Sigma P-7640) per milligram of protein at 37°C for 1 h.
Immunoblotting experiments are as described previously (10). Protein samples are boiled for 5 min in sample buffer and loaded onto 4–20% gradient or 15% polyacrylamide gel. After fractionation, the proteins are blotted onto PVDF membranes (Amersham). Residual proteins in the gel are stained with Coomassie blue to serve as loading control or, in the case of radioactively labeled proteins, exposed to phosphoimager screen for detection of radioactive bands. The PVDF membranes are blocked in PBS with 5% dried milk-0.1% Tween 20 for 1 h at room temperature and subsequently incubated with primary antibody at a suitable dilution at 4°C overnight. This is followed by three 10-min rinses in PBS with 0.1% Tween 20. The membrane is then incubated in diluted alkaline phosphatase-conjugated secondary antibody (Amersham) for 1 h at room temperature. Immunoreactivity is visualized using an ECL detection kit (Amersham) and quantified using densitometry (α-Innotech, ChemiImager model 4400).
Immunofluorescence and confocal microscopy.
Myocytes are fixed in 4% paraformaldehyde, permeabilized by 0.2% Triton X-100, and incubated with primary and then secondary antibodies with rinses in between 1) HA mouse mAb/Alexa647-conjugated anti-mouse or 2) Ab1 rabbit pAb/Alexa488-conjugated anti-rabbit. Nuclei are stained by 4',6-diamidino-2-phenylindole (DAPI). Myocytes are viewed with a Zeiss 510 Meta confocal laser-scanning microscope.
Antibodies.
The following antibodies are used: KCNE2 Ab1 (made by ourselves) and Ab2 (Alomone), HA mAb (Covance), actin mAb (Sigma), hERG pAb (Alomone), ERG1a pAb (a kind gift from Dr. Gail A. Robertson, University of Wisconsin at Madison) (11), and Kv4.3 mAb (NeuroMab).
Statistical analysis.
Statistical tests are carried out using SigmaStat version 2. Two groups are compared by t-test. Multiple groups are compared by one-way ANOVA and, if a significant difference is found, followed by Tukey's or Dunn's pair-wise comparisons.
RESULTS
Validating Ab1 and Ab2 for detecting native KCNE2 in adult ventricular myocytes.
The HA mAb detects two strong bands of 33 and 25 kDa in cultured SHR ventricular myocytes that have been treated with Adv-E2 (HA) overnight, followed by 24 h culture. HA mAb does not detect these bands in cultured SHR myocytes treated with Adv-GFP (Fig. 1C, left, although a faint nonspecific 33-kDa band is seen). Both Ab1 and Ab2 detect the same prominent 33 and 25-kDa HA-KCNE2 bands (Fig. 1, C and D), confirming that they can detect KCNE2 with native-like posttranslational modification(s). However, both Ab1 and Ab2 also detect other bands, some of which are as strong as the HA-KCNE2 bands. Given that the HA epitope adds a mass of 1 kDa, we predict that the native KCNE2 counterparts should be 32 and 24 kDa in size and likely fainter than the highly expressed HA-KCNE2 bands. Do the other prominent bands detected by Ab1 and Ab2 represent highly abundant native KCNE2 protein, or do they represent unrelated proteins recognized by these antibodies? We reason that if they represent highly abundant native KCNE2 protein, they should be suppressed by knocking down KCNE2 expression using RNA interference. We use adenovirus to introduce a short hairpin construct targeting rat KCNE2 nucleotides 319–340 (Adv-E2 si) into cultured SHR ventricular myocytes. The adenovirus also carries a GFP reporter, allowing us to confirm that >40% of the myocytes are infected (GFP+) after overnight Adv-E2 si incubation followed by 24 h culture. We are surprised to see that, relative to control culture or culture after incubation with Adv-GFP, Adv-E2 si does not alter the banding pattern detected by either Ab1 or Ab2 (Fig. 1E). We hypothesize that culturing rat ventricular myocytes in the serum-free medium for 3 days may have downregulated the native KCNE2 protein, so that Adv-E2 si does not have any further effect. Therefore, we compare the banding pattern detected by Ab1 between fresh SHR ventricular myocardium and cultured SHR ventricular myocytes (fresh and control culture in Fig. 1E). Indeed, Ab1 detects a clear 24-kDa band in the fresh myocardium (asterisk in Fig. 1E), which is missing in myocytes after culture. This observation supports part of our hypothesis: culturing rat ventricular myocytes under the control conditions downregulates the 24-kDa native KCNE2 protein species. This validates the 24-kDa native KCNE2 band (highlighted by solid black arrows in Figs. 2–5).
Fig. 2.
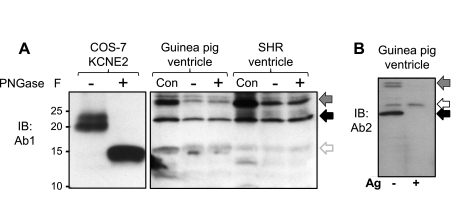
Ab1 and Ab2 detect similar banding patterns of native KCNE2 proteins in SHR and guinea pig hearts, which are not N-glycosylated. A: PNGase F treatment collapses the ≥20-kDa KCNE2 bands expressed in COS-7 cells into the core unglycosylated 15-kDa band, but does not alter the banding pattern of native proteins in guinea pig and SHR ventricles detected by Ab1. Con, original WTL; +, PNGase F treated; −, similarly processed in the absence of enzyme. B: WTL from guinea pig ventricle probed with Ab2, without or with preincubation of Ab2 with excess Ag (− and +, marked below the image). In both A and B, the solid back arrows point to the 24-kDa native KCNE2 band and arrows with gradient gray point to the 32-kDa putative KCNE2 band. In A, the open gray arrow points to the 15-kDa unglycosylated KCNE2 band. In B, the open black arrow points to a band detected by Ab2 that likely represents an unrelated protein.
Fig. 3.
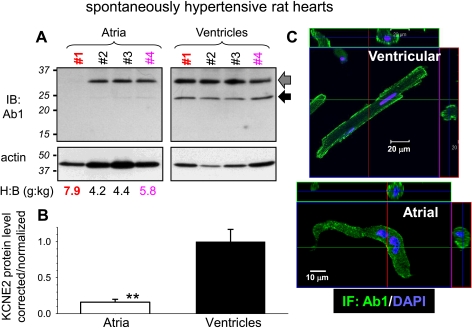
Quantifying KCNE2 in atria and ventricles of SHR hearts. A: IB of WTL from 4 old (20 mo) SHRs (No. 1-No. 4) with heart-to-body weight ratios (H:B) listed below. After blotting proteins from the gel to a polyvinylidene difluoride (PVDF) membrane, the membrane is probed for KCNE2 (Ab1), stripped, and reprobed for actin. Arrows point to the 2 major 32- and 24-kDa native KCNE2 bands. B: densitometry quantification of KCNE2 protein level. Background-subtracted KCNE2 band intensities are combined, corrected for uneven loading (by dividing the combined KCNE2 band intensities by the actin band intensity of respective lane), and normalized by the mean value of ventricle lanes. **P < 0.01, atria vs. ventricles. C: Ab1 immunofluorescence in SHR ventricular (top) and atrial (bottom) myocytes. Orthogonal dissection of stacks of IF images through the thickness of cells confirms the preferential cell surface KCNE2 localization.
Fig. 4.
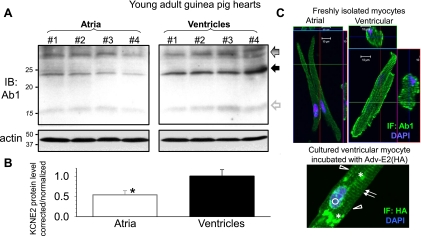
Quantifying KCNE2 in atria and ventricles of young adult (3 to 4 mo) guinea pig hearts. A: IB of WTL from 4 guinea pigs (No. 1-No. 4). The membrane is probed for KCNE2 with Ab1 (top), stripped, and reprobed for actin. Arrows point to the major 32- and 24-kDa KCNE2 bands. The gray open arrow points to a faint 15-kDa band corresponding to the size of core guinea pig KCNE2 (14.6 kDa). B: densitometry quantification of KCNE2 protein level. Data analysis is the same as that described for Fig. 3B. *P < 0.05, atria vs. ventricles. C, top: Ab1 IF in freshly isolated guinea pig atrial and ventricular myocytes. C, bottom: HA IF in a cultured guinea pig ventricular myocyte expressing HA-KCNE2 by overnight incubation with Adv-E2 (HA) followed by 24 h culture. Features of HA IF distribution: arrows, striation pattern in cytosol; open triangles, lateral cell surface; open circle, perinuclear; asterisks, punctate.
Fig. 5.
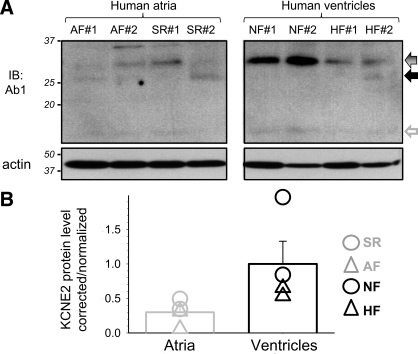
Quantifying KCNE2 in 4 human atrial specimens [2 from patients in atrial fibrillation and 2 from patients in sinus rhythm (AF and SR), respectively] and 4 human ventricular specimens [2 from nonfailing and 2 from failing hearts (NF and HF), respectively]. A: membrane is probed for KCNE2 (Ab1), stripped, and reprobed for actin. Coomassie blue (CB) stain confirms even loading (not shown). B: densitometry quantification of KCNE2 protein level. Data analysis is the same as that described for Fig. 3B. Mean values are shown as histogram bars with SE, and data from individual specimens are shown as symbols.
The band intensities in the 32 to 33 kDa range (expected for the 32-kDa native KCNE2 band) are similar between fresh and control culture. There are two possible explanations. The 33-kDa HA-KCNE2 band detected by HA mAb, Ab1, and Ab2 represents a posttranslational modification seen under the overexpression conditions. Alternatively, the putative 32-kDa native KCNE2 protein species may be much more stable than the 24-kDa species, so that it is neither downregulated in myocytes after culture nor suppressed by Adv-E2 si. We note that the effects of Adv-E2 si depend on the stability of native KCNE2 protein and the duration of RNA interference. The 32 to 33-kDa band detected by both Ab1 and Ab2 in SHR myocytes not overexpressing HA-KCNE2 is highlighted by arrows with gradient gray in Fig. 1E (and in Fig. 2–5, the corresponding bands detected by Ab1 in SHR, guinea pig, and human hearts).
The mass of core KCNE2 protein is 15 kDa. Why do we detect native KCNE2 as 24 and 32-kDa bands? KCNE2 has two N-glycosylation sites (N6 and N29). We showed previously that in vitro translated KCNE2 migrates as 25-, 20-, and 15-kDa bands, and PNGase F treatment (to remove N-glycosylation) collapses the 25- and 20-kDa bands into the 15-kDa band (10). We therefore test whether PNGase F treatment can collapse the 24- and 32-kDa native KCNE2 bands into a 15-kDa band. In view of the uncertainty about the effectiveness of PNGase F treatment (per manufacturer's manual), WCL from COS-7 cells expressing KCNE2 is treated with PNGase F in a parallel experiment to serve as a positive control (Fig. 2A). Furthermore, the original WTLs are included in the immunoblot to show that overnight incubation at 37°C without PNGase F does not alter the banding pattern (although the band intensities are reduced). Although the parallel experiment on COS-7-expressed KCNE2 clearly supports the effectiveness of PNGase F deglycosylation, this enzyme does not collapse the 24- or 32-kDa native KCNE2 band detected by Ab1 to the 15-kDa band. Therefore, the shift of the native KCNE2 mass from 15 to 24 and 32 kDa is not due to N-glycosylation. More experimentation is needed to test other possibilities, including O-glycosylation, tight association with other native proteins (not dissociated by the SDS buffer used in immunoblotting), or dimerization (i.e., 2 of the 15-kDa species to form the 32-kDa species).
Open arrows in Fig. 1E highlight the strong bands detected by Ab1 or Ab2 that we suspect to be nonspecific bands. The most troubling one is the prominent band detected by Ab2 right above the 25-kDa HA-KCNE2 band (Fig. 1D, right). Ab2 also detects a similar nonspecific band in the guinea pig ventricle (Fig. 2B, open arrow). Because Ab1 does not have this problem in the relevant molecular weight range (<37-kDa size marker), we use Ab1 to examine native KCNE2 expression in atria and ventricles of animal models and human hearts.
Using Ab1 to compare native KCNE2 protein expression in atria and ventricles and to examine KCNE2 subcellular distribution.
SHR is a good animal model to study cardiac electrical and structural remodeling during aging with chronic hypertension. Based on Ab2 immunoblotting we previously have proposed that KCNE2 upregulation is involved in ventricular electrical remodeling in old SHRs (18–22 mo of age) (10). We now use Ab1 to probe native KCNE2 expression in four old (20 mo) SHR hearts that have experienced different degrees of hypertrophy [Fig. 3A, heart-to-body (H:B) weight ratios listed below the immunoblots]. Ab1 detects 24- and 32-kDa bands in ventricles but mainly the 32-kDa band in atria. Interestingly, in atria from the failing heart (No. 1, H:B weight ratio 7.9), the 32-kDa KCNE2 band is missing despite the confirmation of protein loading by the actin immunoblot of the same membrane. Densitometry analysis shows that on average KCNE2 protein level in atria is only 20% of that in ventricles in old SHRs (Fig. 3B; P < 0.01). Among these four ventricular specimens from old SHRs, the native KCNE2 band intensities are stable, i.e., there is no increase in KCNE2 protein level with a higher H:B weight ratio. This apparent discrepancy with our previous finding using Ab2 (10) will be discussed below (see discussion).
Guinea pig is a widely used animal model for the rapid and slow delayed rectifier K channels (IKr and IKs, respectively), two major KCNE2 partner channels in the heart (1, 28). It is not clear whether KCNE2 is expressed in guinea pig hearts. This needs to be considered when using guinea pigs to study native IKr and IKs. We use Ab1 to probe native KCNE2 protein expression in young adult guinea pig hearts. Ab1 detects 32- and 24-kDa, and sometimes very faint 15-kDa, bands in guinea pig atria and ventricles (Fig. 4A). The banding pattern is similar to that seen in SHR ventricles (Fig. 2A). On average, the KCNE2 protein level in guinea pig atria is ∼50% of that in guinea pig ventricles (Fig. 4B).
The functional role of KCNE2 does not just depend on the protein expression level. Its subcellular distribution pattern also matters: to be functional, KCNE2 needs to be where its partner channels are, i.e., the cell surface membrane. We use Ab1 to probe KCNE2 protein distribution in atrial and ventricular myocytes of SHR and guinea pig hearts. Despite the caveat that in SHR ventricular myocytes Ab1 detects unrelated proteins in the >37-kDa range (Fig. 1E), the Ab1 immunofluorescence shows preferential cell surface distribution in both ventricular and atrial myocytes of SHR heart (Fig. 3C). This is consistent with the cell surface localization of HA-KCNE2 detected by the HA mAb (Fig. 1F). Ab1 immunofluorescence also exhibits a preferential cell surface localization in both atrial and ventricular myocytes of guinea pig hearts (Fig. 4C, top). There is also a clear striation pattern of Ab1 immunofluorescence in the guinea pig cardiac myocytes. This striation pattern is confirmed by HA immunofluorescence in cultured guinea pig ventricular myocytes expressing HA-KCNE2 (Fig. 4C, bottom). The strong punctate and perinuclear staining in the cytosol of Adv-E2(HA)-treated SHR and guinea pig ventricular myocytes reflects the overexpression of HA-KCNE2. The data presented in Fig. 3 and Fig. 4 show that KCNE2 protein is expressed in ventricular and atrial myocytes of SHR and guinea pig hearts, with preferential cell surface localization and higher abundance in ventricles than in atria.
We use Ab1 to probe native KCNE2 protein in human hearts: atrial specimens from patients in atrial fibrillation or in sinus rhythm, and ventricular specimens from patients in heart failure or nonfailing (NF) (2 each; Fig. 5). Although the actin immunoblot and Coomassie blue stain both confirm even protein loading among the lanes, the KCNE2 band intensities are quite variable. The strongest band is seen in the two nonfailing ventricular specimens (32 kDa; Fig. 5A). A similar but fainter band can be detected in both ventricular specimens from failing hearts. Ab1 detects very faint bands in all four human atrial specimens in the relevant molecular mass range. Although the very limited sample number and large variations in band intensities preclude statistical comparison, densitometry analysis does suggest that the putative KCNE2 protein band in human ventricles is more abundant than that in human atria (Fig. 5B). Therefore, in both human and animal models (old SHR, young guinea pig) KCNE2 protein expression exhibits a gradient of ventricle > atrium.
Ab2 detecting S98-phosphorylated KCNE2.
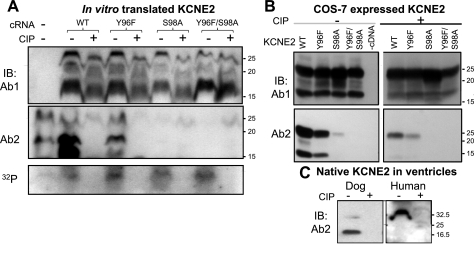
We have made a serendipitous finding that the ability of Ab2 to detect KCNE2 is prevented by pretreating the protein sample with calf intestinal phosphatase (CIP), a nonspecific protein and nucleic acid phosphatase. This suggests that Ab2 detection of KCNE2 requires phosphorylation of its epitope. The confirmation experiment is shown in Fig. 6. Wild-type (WT) KCNE2 is in vitro translated in the presence of γ-32P-ATP, so that the protein can be 32P-labeled via phosphorylation by protein kinases present in the components of the in vitro translation kit. The translation product is divided into two aliquots; one is treated with CIP and the other is similarly processed in the absence of CIP. The two aliquots are fractionated by SDS-PAGE and probed with Ab1 and Ab2. Effective dephosphorylation by CIP is confirmed by the abolishment of 32P-radioactivity in the relevant molecular mass range (10–30 kDa; Fig. 6A, bottom). CIP treatment largely abolishes the WT-KCNE2 bands detected by Ab2 (Fig. 6A, middle). On the other hand, Ab1 can detect dephosphorylated WT-KCNE2, although the mobility is slightly faster than without dephosphorylation (Fig. 6A, top).
Fig. 6.
Detection of KCNE2 by Ab2 requires phosphorylation of serine at position 98 (S98). A: KCNE2 wild-type (WT) and 3 mutants (Y96F, S98A, and Y96F/S98A) are in vitro translated in the presence of γ-32P-ATP to label proteins phosphorylated during translation. The translation products are divided into 2 aliquots, 1 treated with calf intestinal phosphatase (CIP) and the other processed in the same manner without CIP. The aliquots are fractionated by 2 separate SDS-PAGE; 1 is used to probe with Ab1 (top) and the other with Ab2 (middle). Remaining 32P-radioactivity in the gel (in the 10–30 kDa range) is revealed by phosphoimager (bottom). The farthest left lane is no cRNA negative control. B: WCL from COS-7 cells expressing KCNE2 WT or mutants (listed on top), without or with CIP dephosphorylation (− and +, respectively), probed with Ab1 (top) and Ab2 (bottom). C: WTL from dog and human ventricles are divided into 2 aliquots, 1 treated with CIP and the other processed in the same manner without CIP. The 2 aliquots are fractionated side by side and probed with Ab2. CB stain confirms even loading (not shown). In all 3 panels, size marker positions are marked on the right.
There are two potential phosphorylation sites in the Ab2 epitope, tyrosine at position 96 (Y96) and serine at position 98 (S98) (Fig. 1B). We remove the phosphorylation site(s) by mutating Y96 to phenylalanine (Y96F) and S98 to alanine (S98A), singly or together. Y96F behaves like WT KCNE2: Ab2 detects the bands before, but not after, dephosphorylation, and Ab1 detects both with slightly higher mobility after dephosphorylation (Fig. 6A). On the other hand, S98A and Y96F/S98A, although clearly detected by Ab1, escape the detection by Ab2 (Fig. 6A). These data indicate that S98 is a phosphorylation site in KCNE2, and S98 phosphorylation is required for Ab2 detection. S98A and Y96F/S98A are 32P-labeled, and the 32P-radioactivity is abolished by CIP (Fig. 6A, bottom), indicating that there is at least one other KCNE2 phosphorylation site in addition to S98.
COS-7 expression confirms the above in a cellular environment: Ab2 can detect WT and Y96F but not S98A or Y96F/S98A, and CIP dephosphorylation greatly reduces the WT and Y96 band intensities detected by Ab2. On the other hand, Ab1 can detect all bands without or with CIP treatment (Fig. 6B). Importantly, the Ab2 immunoreactivity in dog (20-kDa band) and human (32-kDa band) ventricles is also abolished by dephosphorylation with CIP (Fig. 6C), indicating that native KCNE2 in the heart is at least partially S98-phosphorylated.
Phosphorylation status of S98 impacting on KCNE2 modulation of hERG current amplitude and protein level.
To explore the consequence(s) of S98 phosphorylation in terms of KCNE2 function, we mutate S98 to aspartate (S98D, mimicking S98 phosphorylation), with S98A mimicking S98 dephosphorylation. The WT and mutant KCNE2 are coexpressed with a partner channel, hERG, in oocytes. To monitor the effects of an auxiliary subunit on its partner channel function (such as KCNE2 modulation of hERG) using voltage clamp of individual cells, oocytes provide an important advantage: by controlling the amounts of cRNAs injected into each oocyte we can control the relative expression levels of KCNE2 and hERG. This avoids the issue of heterogeneous KCNE2-to-hERG ratios, which can impact on the degree of channel modulation (28, 31). We use a cRNA molar ratio (hERG:KCNE2) of 1:5 to ensure that hERG is fully associated with, and thus modulated by, KCNE2 even with S98 mutations.
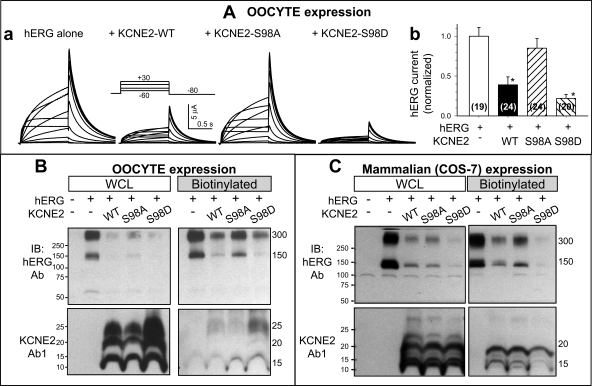
Figure 7A shows that hERG current amplitude is reduced when coexpressed with KCNE2-WT [as reported previously (1)]. S98A attenuates, while S98D accentuates, this hERG current-suppressing effect of KCNE2. There are no changes in the hERG gating kinetics among the four groups of oocytes. These data suggest that S98 phosphorylation is necessary for KCNE2 suppression of hERG current amplitude.
Fig. 7.
Effects of S98 mutations on KCNE2 modulation of human ether-a-go-go related gene (hERG) current amplitude and protein level. A, a: representative current traces recorded from oocytes injected with cRNA(s) marked on top. A, inset: voltage clamp protocol. A, b: hERG current amplitudes measured from the peak tail currents at −80 mV elicited by 1-s depolarizing pulses to +30 mV and normalized by the mean value from oocytes expressing hERG alone. Data are pooled from 2 independent oocyte expression experiments, with numbers of oocytes studied listed in parentheses. *P < 0.05, vs. hERG alone. B and C: effects of KCNE2 WT, S98A, and S98D on hERG protein levels at the WCL and on the cell surface (biotinylated fraction) in oocytes and in COS-7 cells. Far left lanes are no cRNA or no cDNA negative controls. B and C, top: hERG IB. B and C, bottom: KCNE2 IB using Ab1. CB stain confirms even loading (not shown). hERG migrates as 150- and 300-kDa bands (monomer and dimer). KCNE2 migrates as 15-, 20-, and 25-kDa bands. Each oocyte is injected with 10 ng hERG cRNA and, for coexpression, 6.55 ng KCNE2 cRNA, reaching a cRNA molar ratio (hERG:KCNE2) of 1:5. For COS-7 expression, 2 μg each of hERG and KCNE2 cDNAs are added to 35-mm dish, reaching a cDNA molar ratio (hERG:KCNE2) of 1:1.5.
We use biotinylation to quantify oocyte cell surface hERG protein level when the channel is expressed alone or coexpressed with KCNE2 WT, S98A, or S98D. Figure 7B shows that KCNE2-WT reduces the cell surface hERG protein. S98A attenuates, while S98D mimics, this effect of KCNE2. Therefore, the changes in cell surface hERG protein level mirror the changes in hERG current amplitude. Because a similar pattern of changes is seen in whole oocyte hERG protein level, we propose that KCNE2 does not hinder hERG trafficking to the cell membrane. Instead, KCNE2 reduces hERG protein translation and/or accelerates hERG degradation.
KCNE2 accelerating hERG protein degradation.
We pursue the issue of whether/how KCNE2 affects hERG translation and/or degradation by pulse-chase experiments using the COS-7 expression system. Figure 7C confirms that, similar to the oocyte data, in COS-7 expression the hERG protein levels on cell surface and in WCL are reduced by coexpression with KCNE2 WT; S98A attenuates while S98D accentuates these effects.
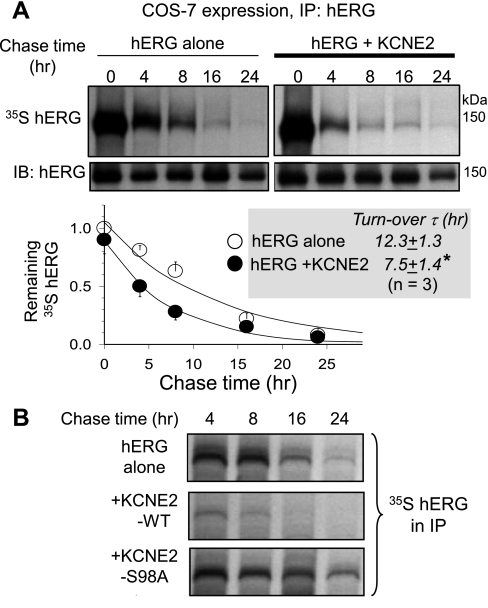
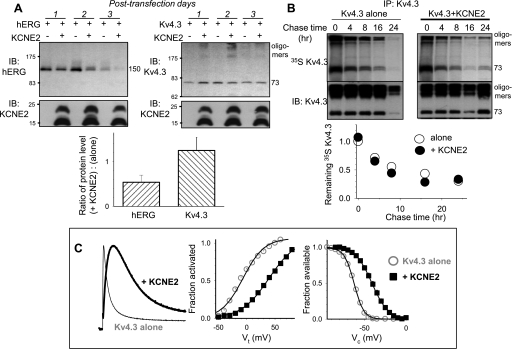
For the pulse-chase experiments, 24 h after cDNA transfection we starve COS-7 cells of Met to stop protein translation. We then introduce 35S-Met to synchronize the start of protein translation with all newly translated proteins radioactively labeled with 35S-Met (the pulse). After pulsing for 1 h, the 35S-Met is replaced by high concentration (2 mM) of cold Met, and the newly synthesized cold KCNE2 will dilute the radioactive counterpart in the KCNE2 pool (the chase). After different chase durations, the hERG protein is immunoprecipitated from the WCLs. The immunoprecipitates are fractionated by SDS-PAGE. The proteins are partially blotted to a PVDF membrane, and the membrane is used for immunoblotting with a hERG Ab (IB: hERG, second row). The radioactivity of hERG protein remaining in the gel is measured by phosphoimager (35S hERG, first row). The radioactivity is normalized by the immunoblot band intensity of respective chase time point. Figure 8A shows that at zero chase time, the level of 35S radioactivity is similar between hERG alone and hERG coexpressed with KCNE2. This suggests that the hERG protein translation efficiency during the pulse period is similar without versus with KCNE2. The normalized radioactivity in the hERG protein pool decays with longer chase times, and the time course can be used to estimate the time constant of hERG turnover or degradation. KCNE2 coexpression significantly shortens the hERG turnover time (n = 3, P < 0.05), indicating that KCNE2 coexpression accelerates hERG protein degradation. Figure 8B shows that, in a parallel pulse-chase experiment, KCNE2 WT accelerates hERG degradation while S98A prevents this effect. This supports the notion that S98 phosphorylation is needed for KCNE2 acceleration of hERG protein degradation.
Fig. 8.
Effect of KCNE2 on hERG turnover rate and the impact of S98A mutation. Details of pulse-chase experiments in COS-7 cells and data interpretation are provided in text. A: quantifying hERG turnover rates when expressed alone or coexpressed with KCNE2. A, top: autoradiographs (35S hERG) and IB of immunoprecipitates from WCL using hERG Ab (IP: hERG) after chase times marked on top. A, bottom: time courses of decay of hERG 35S-radioactivity in immunoprecipitates. Data are normalized by the 0 chase time data point of hERG expressed alone and fit with a single exponential function to estimate the time constants (τ) of hERG turnover (inset, *P < 0.05). B: S98A negates the KCNE2 effect of accelerating hERG turnover. Shown are 35S-autoradiographs of hERG immunoprecipitates from WCL prepared from COS-7 cells expressing the cDNA(s) listed on the left and subjected to pulse-chase experiments using the same procedures as in A. The chase times are listed on top.
Figure 9A shows that coexpressing hERG with KCNE2 versus hERG alone in COS-7 cells reduces the hERG protein level in WCL in a time-dependent manner: the degree of decrease is more severe by posttransfection day 2 than day 1. This is consistent with data shown in Fig. 8A: KCNE2 does not hinder hERG protein translation, but accelerates hERG protein degradation. By day 3, hERG alone shows much reduced protein level in WCL, and KCNE2 coexpression reduces the hERG protein to an even lower level. Interestingly, KCNE2 protein level in the same WCLs is well maintained even by day 3. This suggests that although KCNE2 can accelerate hERG protein degradation, KCNE2 itself is not rapidly degraded. Alternatively, the rate of KCNE2 translation may be well maintained to keep up with degradation even on day 3.
Fig. 9.
Differential effects of KCNE2 on hERG and Kv4.3 protein levels in COS-7 expression. A: KCNE2 reduces whole cell protein level of hERG, but not Kv4.3, in a time-dependent manner. A, top: representative immunoblot images of WCLs, with cDNA(s) transfected and number of posttransfection days listed above. A, bottom: ratios of α-subunit protein level when coexpressed with KCNE2 to when expressed alone, (+KCNE2):(alone), measured on posttransfection day 1. B: pulse-chase experiment in COS-7 cells showing that KCNE2 coexpression does not accelerate Kv4.3 turnover. The format is the same as that of Fig. 8A. As has been reported previously (8), Kv4.3 tends to form high-molecular weight oligomers in addition to the monomer 73-kDa band; the band intensities are combined in quantification. C: Kv4.3 coexpressed with KCNE2 in COS-7 cells is modulated by KCNE2. C, left: KCNE2 slows Kv4.3 activation and inactivation (slowing time to reach peak and decay, currents are recorded at +60 mV). C, middle: KCNE2 shifts the voltage dependence of Kv4.3 activation in the positive direction. C, right: KCNE2 shifts the voltage dependence of Kv4.3 inactivation in the positive direction. Protocols and data analysis have been described previously (31).
KCNE2 modulating Kv4.3 gating kinetics but not reducing Kv4.3 protein level.
Is the above an overexpression artifact? If so, we expect to see it occur to KCNE2 modulation of other partner Kv channels. We test the effects of KCNE2 on Kv4.3 expressed in COS-7 cells. KCNE2 coexpression leads to clear changes in the Kv4.3 gating kinetics: slowing the time to peak and inactivation, and shifting the voltage-dependence of activation and inactivation in the positive direction (Fig. 9C) (31). However, KCNE2 does not reduce the Kv4.3 protein level in WCLs even by day 3 (Fig. 9A, top right), and pulse-chase experiment shows that KCNE2 does not accelerate Kv4.3 turnover (Fig. 9B). These observations are clearly different from KCNE2 modulation of hERG (Fig. 9A, bottom).
Testing whether hERG and KCNE2 proteins are degraded by the proteasome or lysosome pathway.
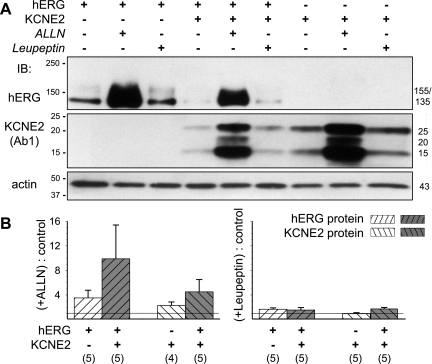
It has been shown that in mammalian cell expression systems hERG degradation mainly occurs by the proteasome pathway (4, 6). On the other hand, a previous study showed that KCNE2 uniquely clusters to the lysosomal compartment, where protein degradation occurs (30). Is it possible that hERG, when associated with KCNE2, also traffics to lysosomes at a high rate and becomes degraded there? We test the effects of proteasome inhibitor [N-acetyl-L-leucyl-L-norleucinal (ALLN), 20 μM] (6) and lysosome inhibitor (leupeptin; 100 μM) on the hERG protein level in COS-7 WCLs when hERG is expressed alone or coexpressed with KCNE2. Treatment with ALLN or leupeptin commences right after transfection and continues for another 48 h before analysis. We confirm that ALLN treatment markedly increases the hERG protein level, whereas leupeptin treatment has very little effect (Fig. 10). Importantly, this pattern is not altered by KCNE2 coexpression, although the hERG protein level is markedly reduced by KCNE2. Figure 10 further shows that KCNE2 degradation also occurs by the proteasome pathway, either expressed alone or coexpressed with hERG.
Fig. 10.
Effects of proteasome and lysosome inhibitors [N-acetyl-L-leucyl-L-norleucinal (ALLN) 20 μM and leupeptin 100 μM] on hERG and KCNE2 protein levels in COS-7 WCLs, when the 2 are expressed separately or coexpressed. A: representative immunoblot images of hERG (top) and KCNE2 (with Ab1; middle). The latter is stripped and reprobed for actin (bottom). The cDNA(s) and treatment (control, ALLN, or leupeptin) are marked on top. Size markers are marked on left; hERG- and KCNE2-specific bands are marked on the right (in kDa). B: summary of densitometry quantification. The intensities of background-subtracted hERG- and KCNE2-specific bands are normalized by those of actin bands of respective lanes, and the ratios of ALLN-treated to control (left) or leupeptin-treated to control (right) are calculated for each of the groups. Listed below are transfected cDNA(s) and the numbers of independent COS-7 transfection/immunoblot experiments included in the analysis.
DISCUSSION
Our major findings can be summarized as follows. First, both Ab1 and Ab2 can detect two prominent HA-tagged KCNE2 bands (25 and 33 kDa) expressed in adult ventricular myocytes and validated by HA-mAb. Second, Ab1 detects corresponding native KCNE2 bands of 24 and 32 kDa without interference in the appropriate molecular mass range (<37 kDa), whereas Ab2 recognizes an unrelated band right above the 25-kDa HA-tagged (or the corresponding 24-kDa native) KCNE2 band. Third, Ab1 is used to quantify native KCNE2 protein, and the data show that KCNE2 protein is more abundant in ventricles than in atria of old SHR, young adult guinea pig, and, likely, human hearts. Fourth, Ab1 immunofluorescence suggests that native KCNE2 protein is preferentially expressed in the cell surface membrane of both atrial and ventricular myocytes. Fifth, KCNE2 suppresses hERG current amplitude by accelerating hERG protein degradation, and phosphorylation of serine at position 98 (S98) in the epitope region for Ab2 is necessary for this KCNE2 effect. Sixth, Ab2 detects S98-phosphorylated KCNE2. Finally, both hERG and KCNE2 proteins are degraded by the proteasome pathway, either when they are expressed separately or together.
Comparison with previous studies.
The 24-kDa KCNE2 band size matches the values reported by others in the literature using different KCNE2 antibodies: (1) 24 kDa, KCNE2 in mouse heart, detected by a commercial Ab (Sigma) and by a homemade Ab (22), (2) 25 kDa, KCNE2 in canine Purkinje fiber, by a commercial Ab (Santa Cruz) (19); however, we detect KCNE2 as a 20-kDa band in canine ventricular muscle by both Ab1, Fig. 10, and Ab2 (10). Although the 32-kDa putative KCNE2 band is more consistently seen than the 24-kDa band in SHR hearts (Fig. 3A) and in human hearts (Fig. 5A), this band is not downregulated in SHR ventricular myocytes after culture (as is the case for the 24-kDa band), nor is it suppressed by RNA interference targeting KCNE2 (Fig. 1E). Despite this uncertainty, we note that excluding the 32-kDa band from our analysis will not alter the conclusion that KCNE2 protein is more abundant in ventricles than in atria.
Our conclusion appears to be in conflict with previous reports showing that in human (14) and mouse (5) hearts KCNE2 mRNA level is much lower in ventricles than in atria. Mismatches between mRNA and protein levels have been described for KCNE1 and several other cardiac ion channel genes (15, 16). However, in these cases, the protein levels are disproportionately low relative to the corresponding mRNAs due to microRNA repression of translation, a situation apparently different from that of KCNE2. Furthermore, bioinformatics analysis has suggested that KCNE2 is one of very few genes in the heart that is not subjected to microRNA repression (16). It is possible that the KCNE2 protein is translated with a higher rate and/or degraded at a slower rate in ventricles relative to atria, creating a mismatch between mRNA gradient (atria > ventricles) and protein gradient (atria < ventricles).
A novel mechanism by which KCNE2 modulates the hERG/IKr current density.
We have uncovered a novel mechanism by which KCNE2 modulates hERG current amplitude: KCNE2 accelerates hERG protein degradation, reducing whole cell and thus cell surface hERG protein level and suppressing hERG current amplitude. This is different from a previous report suggesting that KCNE2 suppresses hERG current amplitude by decreasing the single channel conductance (1). However, these two mechanisms are not mutually exclusive. This mechanism is not shared by KCNE2 modulation of Kv4.3, another KCNE2 partner channel in the heart. Therefore, KCNE2 can modulate partner channels by modulating their gating kinetics (31), single channel conductance (1), and/or the rate of protein degradation.
S98 phosphorylation appears to be necessary for the suppressing effects of KCNE2 on hERG current amplitude and protein level. S98 is in the cytoplasmic domain of KCNE2. Its phosphorylation status may impact on the interactions between vesicles containing KCNE2 as a cargo and other cytosolic proteins involved in cargo recognition and vesicular translocation (7). Because S98 phosphorylation seems critical for KCNE2 modulation of hERG and appears to be altered in diseased hearts (discussed below), identifying the signaling pathway(s), including the participating protein kinase(s) and phosphatase(s), will be of importance.
There is a precedent for KCNE subunit involved in partner Kv channel turnover/degradation: Xu et al. (29) have shown that KCNE1 acts as an endocytic chaperone for KCNQ1, and the trafficking cue may reside in the intracellular COOH-terminal domain of KCNE1. KCNE1 and KCNE2 are closely related, and each can regulate both hERG (1, 17) and KCNQ1 (23, 28). However, although KCNE2 coexpression reduces the KCNQ1 protein level in oocytes (13) and in COS-7 cells (unpublished results), our preliminary data suggest that this effect does not seem to depend on the phosphorylation of S98.
Implications for the role of KCNE2 in arrhythmias.
Our conclusion that KCNE2 protein is relatively abundant in ventricles is consistent with the linkage between genetic variations in KCNE2 and LQT6. Heterologous expression experiments have shown that KCNE2 can engage in quite promiscuous partnerships with voltage-gated K channels [hERG (1), KCNQ1 (26), KCNQ1/KCNE1 (28), and Kv4.x (31), × = 2 and 3] and, unique among KCNE subunits, with HCN channels that mediate the pacemaking currents (20). Experiments conducted in animal models have provided support for KCNE2 modulation of dERG (dog equivalent of hERG) in canine ventricular myocytes (10), KCNQ1/KCNE1 in guinea pig ventricular myocytes (9), and Kv4.2 and Kv1.5 in mouse ventricular myocytes (22). However, direct evidence for such (and potentially other) KCNE2 functions in human heart is still lacking. This important question needs to be addressed before we can fully understand LQT6.
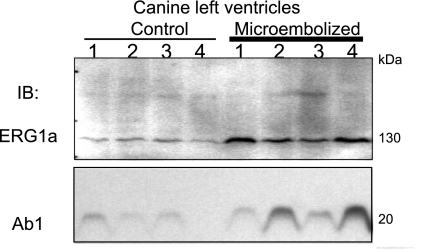
We showed previously that ventricular myocytes from chronically infarcted [myocardial infarction (MI)] canine hearts manifested a higher IKr current density than ventricular myocytes isolated from the equivalent region of control canine hearts (10). There was a decrease in Ab2 immunoreactivity in MI versus control hearts (10). However, the Ab1 immunoblot indicates that this was not due to a downregulation of the total KCNE2 protein level during chronic MI (Fig. 11). Furthermore, there was an increase in dERG1a (11) protein level in chronic MI (Fig. 11). In view of the new revelation that Ab2 detection of KCNE2 requires S98 phosphorylation, we suggest that during chronic MI, S98 phosphorylation is reduced despite a modest increase in total KCNE2 protein level. S98 dephosphorylation attenuates the ability of KCNE2 to accelerate dERG1a degradation, leading to an increase in dERG1a protein level and subsequently a rise in IKr current density in the ventricular myocytes.
Fig. 11.
KCNE2 and rapid delayed rectifier K channels (IKr) remodeling during chronic myocardial infarction in canine ventricular myocytes. Chronic myocardial infarction is created by microembolizations as described previously (12). Whole tissue lysates from 4 control and 4 microembolized canine left ventricles are probed with an ERG1a-specific Ab (11) and Ab1 (antibodies listed on the left). The ERG1a-specific Ab recognizes a major 130-kDa dERG1a band, and Ab1 recognizes a major 20-kDa KCNE2 band in canine heart.
We showed previously that Ab2 detected stronger KCNE2 bands in old SHR ventricles with higher H:B weight ratios (10). However, we do not observe such a correlation between Ab1 immunoblot of old SHR ventricles and the H:B weight ratio (Fig. 3A). It is possible that the increase in Ab2 reactivity reported previously reflected an increase in the degree of S98 phosphorylation in aging SHR ventricles. More experimentation is needed to explore the functional consequences and the partner channels involved.
GRANTS
This study is supported by RO1 HL-67840 from the National Heart, Lung, and Blood Institute of the National Institutes of Health, by a Grant-in-Aid award from the American Heart Association/Mid-Atlantic Affiliate (to G.-N. Tseng), and by a Postdoctoral Fellowship from the American Heart Association/Mid-Atlantic Affiliate (to D. P. Zankov).
DISCLOSURES
No conflicts of interest, financial or otherwise, are declared by the author(s).
AUTHOR CONTRIBUTIONS
Author contributions: M.Z., Y.H.W., M.J., D.P.Z., S.C., and G.-N.T. performed experiments; M.Z., Y.H.W., M.J., D.P.Z., S.C., and G.-N.T. analyzed data; M.Z., Y.H.W., M.J., D.P.Z., S.C., V.K., and G.-N.T. approved final version of manuscript; V.K. and G.-N.T. conception and design of research; G.-N.T. interpreted results of experiments; G.-N.T. prepared figures; G.-N.T. drafted manuscript; G.-N.T. edited and revised manuscript.
ACKNOWLEDGMENTS
Confocal microscopy was performed at the Virginia Commonwealth University Department of Neurobiology and Anatomy Microscopy Facility, supported in part by National Institutes of Health- National Institute of Neurological Disorders and Stroke Center Core Grant 5P30NS047463. We thank Dr. Gail Robertson (University of Wisconsin at Madison) for the ERG1a antibody.
REFERENCES
- 1. Abbott GW, Sesti F, Splawski I, Buck ME, Lehmann MH, Timothy KW, Keating MT, Goldstein SAN. MiRP1 forms IKr potassium channels with HERG and is associated with cardiac arrhythmia. Cell 97: 175–187, 1999 [DOI] [PubMed] [Google Scholar]
- 2. Bendahhou S, Marionneau C, Haurogne K, Larroque MM, Derand R, Szuts V, Escande D, Demolombe S, Barhanin J. In vitro molecular interactions and distribution of KCNE family with KCNQ1 in the human heart. Cardiovasc Res 67: 529–538, 2005 [DOI] [PubMed] [Google Scholar]
- 3. Ellingsen O, Davidoff AJ, Prasad SK, Berger HJ, Springhorn JP, Marsh JD, Kelly RA, Smith TW. Adult rat ventricular myocytes cultured in defined medium: phenotype and electromechanical function. Am J Physiol Heart Circ Physiol 265: H747–H754, 1993 [DOI] [PubMed] [Google Scholar]
- 4. Ficker E, Dennis AT, Wang L, Brown AM. Role of the cytosolic chaperones Hsp70 and Hsp90 in maturation of the cardiac potassium channel hERG. Circ Res 92: e87–e100, 2003 [DOI] [PubMed] [Google Scholar]
- 5. Franco D, Demolombe S, Kupershmidt S, Dumaine R, Dominguez JN, Roden D, Antzelevitch C, Escande D, Moorman AFM. Divergent expression of delayed rectifier K+ channel subunits during mouse heart development. Cardiovasc Res 52: 65–75, 2001 [DOI] [PubMed] [Google Scholar]
- 6. Gong Q, Keeney DR, Molinari M, Zhou Z. Degradation of trafficking-defective long QT syndrome type II mutant channels by the ubiquitin-proteasome pathway. J Biol Chem 280: 19419–19425, 2005 [DOI] [PubMed] [Google Scholar]
- 7. Grosshans BL, Ortiz D, Novick P. Rabs and their effectors: achieving specificity in membrane traffic. Proc Natl Acad Sci USA 103: 11821–11827, 2006 [DOI] [PMC free article] [PubMed] [Google Scholar]
- 8. Jia Y, Takimoto K. Mitogen-activated protein kinases control cardiac KChIP2 gene expression. Circ Res 98: 386–393, 2006 [DOI] [PMC free article] [PubMed] [Google Scholar]
- 9. Jiang M, Xu XL, Wang YH, Toyoda F, Liu XS, Zhang M, Robinson RB, Tseng GN. Dynamic partnership between KCNQ1 and KCNE1 and influence on cardiac IKs current amplitude by KCNE2. J Biol Chem 284: 16452–16462, 2009 [DOI] [PMC free article] [PubMed] [Google Scholar]
- 10. Jiang M, Zhang M, Tang DG, Clemo HF, Liu J, Holwitt D, Kasirajan V, Higgins RS, Wettwer E, Tseng GN. KCNE2 protein is expressed in ventricles of different species and changes in its expression contribute to electrical remodeling in diseased hearts. Circulation 109: 1783–1788, 2004 [DOI] [PubMed] [Google Scholar]
- 11. Jones EMC, RotiRoti EC, Wang J, Delfosse SA, Robertson GA. Cardiac IKr channels minimally comprise hERG 1a and 1b subunits. J Biol Chem 279: 44690–44694, 2004 [DOI] [PubMed] [Google Scholar]
- 12. Liu XS, Jiang M, Zhang M, Tang D, Higgins RSD, Tseng GN. Electrical remodeling in a canine model of ischemic cardiomyopathy. Am J Physiol Heart Circ Physiol 292: H560–H571, 2007 [DOI] [PubMed] [Google Scholar]
- 13. Liu XS, Zhang M, Jiang M, Wu DM, Tseng GN. Probing the interaction between KCNE2 and KCNQ1 in the transmembrane region. J Membr Biol 216: 117–127, 2007 [DOI] [PubMed] [Google Scholar]
- 14. Lundquist AL, Manderfield LJ, Vanoye CG, Rogers CS, Donahue BS, Chang PA, Drinkwater DC, Murray KT, George AL., Jr Expression of multiple KCNE genes in human heart may enable variable modulation of IKs. J Mol Cell Cardiol 38: 277–287, 2005 [DOI] [PubMed] [Google Scholar]
- 15. Luo X, Xiao J, Lin H, Li B, Lu Y, Yang B, Wang Z. Transcriptional activation by stimulating protein 1 and post-transcriptional repression by muscle-specific microRNAs of IKs-encoding genes and potential implications in regional heterogeneity of their expression. J Cell Physiol 212: 358–367, 2007 [DOI] [PubMed] [Google Scholar]
- 16. Luo X, Zhang H, Xiao J, Wang Z. Regulation of human cardiac ion channel genes by microRNAs: theoretical perspective and pathophysiological implications. Cell Physiol Biochem 25: 571–586, 2010 [DOI] [PubMed] [Google Scholar]
- 17. McDonald TV, Yu Z, Ming Z, Palma E, Meyers MB, Wang KW, Goldstein SAN, Fishman GI. A minK-HERG complex regulates the cardiac potassium current IKr. Nature 388: 289–292, 1997 [DOI] [PubMed] [Google Scholar]
- 18. O′Rourke B, Kass DA, Tomaselli GF, Kaab S, Tunin R, Marban E. Mechanisms of altered excitation-contraction coupling in canine tachycardia-induced heart failure. I. Experimental studies. Circ Res 84: 562–570, 1999 [DOI] [PubMed] [Google Scholar]
- 19. Pourrier M, Zicha S, Ehrlich J, Han W, Nattel S. Canine ventricular KCNE2 expression resides predominantly in Purkinje fibers. Circ Res 93: 189–191, 2003 [DOI] [PubMed] [Google Scholar]
- 20. Qu J, Kryukova Y, Potapova IA, Doronin SV, Larsen M, Krishnamurthy G, Cohen IS, Robinson RB. MiRP1 modulates HCN2 channel expression and gating in cardiac myocytes. J Biol Chem 279: 43497–43502, 2004 [DOI] [PubMed] [Google Scholar]
- 21. Radicke S, Dotella D, Graf EM, Banse U, Jost N, Varro A, Tseng GN, Ravens U, Wettwer E. Functional modulation of the transient outward current Ito by KCNE β-subunits and regional distribution in human non-failing and failing hearts. Cardiovasc Res 71: 695–703, 2006 [DOI] [PubMed] [Google Scholar]
- 22. Roepke TK, Kontogoergis A, Ovanez C, Xu X, Young JB, Purtell K, Goldstein PA, Christini DJ, Peters JS, Akar FG, Gutstein DE, Lerner DJ, Abbott GW. Targeted deletion of kcne2 impairs ventricular repolarization via disruption of IK,slow1 and Ito,f. FASEB J 22: 3648–3660, 2008 [DOI] [PMC free article] [PubMed] [Google Scholar]
- 23. Sanguinetti MC, Curran ME, Zou A, Shen J, Spector PS, Atkinson DL, Keating MT. Coassembly of KvLQT1 and minK (IsK) proteins to form cardiac IKs potassium channel. Nature 384: 80–83, 1996 [DOI] [PubMed] [Google Scholar]
- 24. Schreibmayer W, Lester HA, Dascal N. Voltage clamping of Xenopus laevis oocytes utilizing agarose-cushion electrodes. Pflügers Arch 426: 453–458, 1994 [DOI] [PubMed] [Google Scholar]
- 25. Splawski I, Shen J, Timothy KW, Lehmann MH, Priori SG, Robinson JL, Moss AJ, Schwartz PJ, Towbin JA, Vincent GM, Keating MT. Spectrum of mutations in long-QT syndrome genes KvLQT1, HERG, SCN5A, KCNE1, and KCNE2. Circulation 102: 1178–1185, 2000 [DOI] [PubMed] [Google Scholar]
- 26. Tinel N, Diochot S, Borsotto M, Lazdunski M, Barhanin J. KCNE2 confers background current characteristics to the cardiac KCNQ1 potassium channel. EMBO J 19: 6326–6330, 2000 [DOI] [PMC free article] [PubMed] [Google Scholar]
- 27. Tseng-Crank JCL, Tseng GN, Schwartz A, Tanouye MA. Molecular cloning and functional expression of a potassium channel cDNA isolated from a rat cardiac library. FEBS Lett 268: 63–68, 1990 [DOI] [PubMed] [Google Scholar]
- 28. Wu DM, Jiang M, Zhang M, Liu XS, Korolkova YV, Tseng GN. KCNE2 is colocalized with KCNQ1 and KCNE1 in cardiac myocytes and may function as a negative modulator of IKs current amplitude in the heart. Heart Rhythm 3: 1469–1480, 2006 [DOI] [PubMed] [Google Scholar]
- 29. Xu X, Kanda VA, Choi E, Panaghie G, Roepke TK, Gaeta SA, Christini DJ, Lerner DJ, Abbott GW. MinK-dependent internalization of the IKs potassium channel. Cardiovasc Res 82: 430–438, 2009 [DOI] [PMC free article] [PubMed] [Google Scholar]
- 30. Yu YH, Warnatz HJ, Vanhecke D, Wagner F, Fiebitz A, Thamm S, Kahlem P, Lehrach H, Yaspo ML, Janitz M. Cell array-based intracellular localization screening reveals novel functional features of human chromosome 21 proteins. BMC Genomics 17: 155, 2006 [DOI] [PMC free article] [PubMed] [Google Scholar]
- 31. Zhang M, Jiang M, Tseng GN. MinK-related peptide 1 associates with Kv4.2 and modulates its gating function. A potential role as β subunit of cardiac transient outward channel. Circ Res 88: 1012–1019, 2001 [DOI] [PubMed] [Google Scholar]


