Background: Excess oleate induces triacylglycerol synthesis and proliferation of lipid particles (LP) in yeast.
Results: Oleate-induced LP formation is dependent on the glycerol-3-phosphate acyltransferase (GPAT) isoform Gat1p, which physically interacts with LPs.
Conclusion: Formation of oleate-induced LPs depends on active Gat1p (but not Gat2p).
Significance: Fatty acid surplus is controlled at the GPAT step with unique contributions from different isoforms.
Keywords: Endoplasmic Reticulum (ER), Glycerolipid, Lipid Droplets, Phosphorylation, Triacylglycerol, Saccharomyces cerevisiae, Glycerol-3-phosphate Acyltransferase, Glycerolipid Metabolism, Lipid Particle, Oleate
Abstract
The ability to channel excess fatty acids into neutral lipids like triacylglycerol (TAG) is a critical strategy used by cells to maintain lipid homeostasis. Upon activation to acyl-CoA, fatty acids become readily available as substrates for acyltransferases involved in neutral lipid synthesis. Neutral lipids are then packed into organelles derived from the endoplasmic reticulum called lipid particles (LPs). The first acylation step in the de novo pathway for TAG synthesis is catalyzed by glycerol-3-phosphate acyltransferases (GPATs). Two isoforms, Gat1p/Gpt2p and Gat2p/Sct1p, are present in the yeast Saccharomyces cerevisiae. Previous evidence indicated that these enzymes contribute differentially to the synthesis of TAG in actively growing cells. In this work we studied the role of the yeast GPATs in the formation of LPs induced by a surplus of oleic acid. Yeast lacking Gat1p (but not Gat2p) were sensitive to oleate and failed to accumulate LPs induced by this unsaturated fatty acid. It is shown that oleate induces dephosphorylation of Gat1p as well as an increment in its levels. Most importantly, we identified novel Gat1p crescent structures that are formed in the presence of oleate. These structures are connected with the endoplasmic reticulum and are intimately associated with LPs. No such structures were observed for Gat2p. A crucial point of control of lipid fluxes at the GPAT step is proposed.
Introduction
How cells manage excess fatty acids is a current and relevant question directly related to the etiology of diseases like obesity and diabetes. Many organisms evolved means to ensure uptake of fatty acids whenever available in the environment, with the possibility of storing them largely in the form of triacylglycerols (TAG).3 TAG can be efficiently packed into the core of lipid particles (LPs, also called lipid droplets), cell compartments that can accumulate in large quantities within cells as diverse as yeast and human adipocytes.
In recent years, LPs have gained the status of an organelle. This implies LPs are not just a static storage compartment but a dynamic structure that actively participates in maintaining lipid homeostasis (1–3). LPs have a signature proteome and lipidome that responds to environmental and nutritional conditions of cells (4, 5). Unique LP resident proteins include enzymes catalyzing the degradation of steryl esters and TAG, whereas most anabolic enzymes shuttle between the endoplasmic reticulum (ER) and LPs. It has been suggested that this differential localization of anabolic and catabolic enzymes may reflect separate routes leading to the association of these proteins with LPs (2). All enzymes catalyzing the steps implicated in TAG synthesis are initially located in the ER. Thus, it is not surprising that the ER is functionally connected and directly involved in LP biogenesis (6). The predominant metabolic pathway for the de novo biosynthesis of TAG is initiated at the first committed and rate-limiting step catalyzed by a glycerol-3-phosphate acyltransferase (GPAT). This enzyme transfers an activated fatty acid (acyl-CoA) to the sn-1 position of glycerol 3-phosphate to produce lysophosphatidic acid. Subsequently, lysophosphatidic acid is acylated at the sn-2 position by a separate acyltransferase yielding phosphatidic acid. Phosphatidic acid can be converted to CDP-diacylglycerol for glycerophospholipid synthesis or dephosphorylated to produce diacylglycerol for the synthesis of TAG or phospholipids through the Kennedy pathway (2, 7). A unique gene pair in Saccharomyces cerevisiae, GAT1/GPT2 and GAT2/SCT1, code for the GPATs in this organism (8, 9). Yeast Gat1p and Gat2p differentially contribute to TAG and phospholipid biosynthetic pathways (8). Steady state metabolic labeling of cells with [14C]acetate during exponential growth showed an ∼30% increase and a 50% decrease in the rate of TAG synthesis in gat1Δ and gat2Δ mutants, respectively. In addition, a 5-fold increase in glycerophosphocholine production through deacylation of phosphatidylcholine synthesized through the CDP-choline pathway was detected in gat1Δ, whereas gat2Δ displayed a 10-fold decrease. This led to our conclusion that Gat2p is a major contributor to TAG and phosphatidylcholine synthesis via the Kennedy pathway (8). We are particularly interested in understanding lipid pathway partitioning at the mechanistic level. It is well known that synthesis of lipids is spatially restricted by the localization of biosynthetic systems. Intriguingly, evidence points to Gat1p (but not Gat2p) as an LP resident protein, although this has only been detected during stationary phase in cells cultured in the presence of glucose (5, 10, 11). In addition, localization studies in actively growing cells showed that both Gat1p and Gat2p are localized to the ER, possibly enriched in distinct ER regions (12). In line with this, recent evidence from plant GPATs further supports the existence of ER subdomains enriched in different acyltransferase isoforms (13).
Considering the previously detected differences in TAG biosynthesis in gat mutants, we decided to study the contribution of Gat1p and Gat2p to LP formation in a condition where TAG synthesis is augmented. Excess availability of fatty acids, like oleate, provides such an experimental condition (5, 14). Interestingly, in a recent screening of the haploid yeast deletion collection, cells lacking Gat1p (but not Gat2p) were identified to be sensitive to oleate (15). Here, we demonstrate that Gat1p is indeed a major player in the cellular response to oleic acid, markedly contrasting with Gat2p. Accumulation of LPs was dependent on the presence of active Gat1p. In addition, the response to oleate included an increment in Gat1p levels and changes in its phosphorylation status. Most importantly, our study unveiled the formation of unique Gat1p-enriched ER structures that adopted ring and crescent shapes intimately associated with LPs.
Our results indicate that lipid fluxes are controlled at the GPAT step. Unique roles for different isoforms in channeling the incorporation of specific fatty acids into complex glycerolipids are proposed.
EXPERIMENTAL PROCEDURES
Yeast Strains, Plasmids, and Culture Conditions
Yeast cells were grown in synthetic minimal medium containing 0.67% yeast nitrogen base without amino acids, 2% glucose and 0.1% tyrosine, 0.1% methionine, 0.1% leucine, 0.1% lysine, 0.1% arginine, 0.1% histidine, 0.02% adenine, and 0.02% uracil to fulfill strain auxotrophies. Once reaching the mid-log phase, cells were transferred to oleate synthetic media where glucose was replaced by 0.05% yeast extract, 1% TergitolTM, and the indicated concentration of oleate or palmitate (at its maximum solubility of 0.5 mm) from an ethanol stock. For every experiment, fresh oleic acid from a −20 °C stock (Sigma) was dissolved in warm 10% Tergitol, filter-sterilized, and then diluted into autoclaved warm medium.
All strains used in this study are listed in Table 1. Haploid strains expressing Gat1-GFP and Gat2-GFP from the endogenous locus and native promoter (Invitrogen) were mated with strains expressing Erg6-RFP, Pex3-RFP, or Sec13-RFP (16) to generate diploid strains that were selected by plating on double selection plates lacking methionine and lysine, followed by replica plating onto plates containing G418 (Roche Applied Science) and plates lacking histidine to complete their characterization.
TABLE 1.
Strains used in this study
| Strain | Genotype | Ref. |
|---|---|---|
| YKR067W-GFP | Mata his3 leu2 met15 ura3 GAT1::GFP HIS3 | Invitrogen |
| YBL011W-GFP | Mata his3 leu2 met15 ura3 GAT2::GFP HIS3 | Invitrogen |
| VZY 21 | Matα his3 leu2 ura3 GAT1::GFP HIS3 gat2Δ:: kanMX4 | 12 |
| VZY 31 | Matα his3 leu2 ura3 GAT2::GFP HIS3 gat1Δ: kanMX4 | 12 |
| BY4741 | Mata his3 leu2 met15 ura3 | EUROSCARF |
| Y05983 | Mata his3 leu2 met15 ura3 gat1Δ::kanMX4 | EUROSCARF |
| Y03037 | Mata his3 leu2 met15 ura3 gat2Δ::kanMX4 | EUROSCARF |
| ERG6-RFP | Matα his3 leu2 lys2 ura3 ERG6::RFP kanMX4 | 16 |
| SEC13-RFP | Matα his3 leu2 lys2 ura3 SEC13::RFP kanMX4 | 16 |
| PEX3-RFP | Matα his3 leu2 lys2 ura3 PEX3::RFP kanMX4 | 16 |
| VZY 64 | Mata/α his3/his3, leu2/leu2, met15/MET15, LYS2/lys2, ura3/ura3 GAT1::GFP HIS3/GAT1, ERG6/ERG6::RFP kanMX | This study |
| VZY 65 | Mata/α his3/his3, leu2/leu2, met15/MET15, LYS2/lys2, ura3/ura3 GAT2::GFP HIS3/GAT1, ERG6/ERG6::RFP kanMX | This study |
| VZY 66 | Mata/α his3/his3, leu2/leu2, met15/MET15, LYS2/lys2, ura3/ura3 GAT1::GFP HIS3/GAT1, PEX3/PEX3::RFP kanMX | This study |
| VZY 67 | Mata/α his3/his3, leu2/leu2, met15/MET15, LYS2/lys2, ura3/ura3 GAT2::GFP HIS3/GAT1, PEX3/PEX3::RFP kanMX | This study |
| VZY 68 | Mata/α his3/his3, leu2/leu2, met15/MET15, LYS2/lys2, ura3/ura3 GAT1::GFP HIS3/GAT1, SEC13/SEC13::RFP kanMX | This study |
| VZY 69 | Mata/α his3/his3, leu2/leu2, met15/MET15, LYS2/lys2, ura3/ura3 GAT2::GFP HIS3/GAT1, SEC13/SEC13::RFP kanMX | This study |
The mutation G261L was introduced into plasmid pYES-GAT1 (2μ, URA3, GAL promoter) (8) by site-directed mutagenesis using QuikChange II (Stratagene). This mutation was predicted to yield a catalytically dead protein (17), and in fact was unable to support life of a gat1Δ gat2Δ double knock-out strain (data not shown). Empty pYES was from Invitrogen.
Growth and Viability
For viability tests, yeast were pre-grown to mid-log phase (A600 = 0.3) in synthetic minimal medium containing glucose. Cells were then pelleted and resuspended in the same medium + 1% Tergitol (control) or medium containing 1% Tergitol and 0.1% (3.5 mm) oleic acid. Growth was monitored every 2 h for the first 6 h and at 24 h once all cultures reached stationary phase. For viability analysis, cell density was determined using a Neubauer chamber, and 150 cells were plated onto YPD agar plates (1% yeast extract, 2% bactopeptone, 2% glucose, and 2% agar). Plates were incubated at 30 °C for 3 days; colonies were counted, and results were expressed relative to control plates. For plate growth assays, yeast were grown to mid-log phase in synthetic medium containing 2% glucose and serially diluted 1:10 starting with an A600 of 1. The growth of the cells was monitored by spotting 5 μl of each dilution onto solid medium in the absence or presence of oleate. Plates were incubated at 30 °C for 3 days. Plates were imaged using a GelDoc system (Bio-Rad) and Adobe Photoshop 7.0 software for image alignment and labeling.
Cell Lysis, Microsomal Fractionation, Phosphatase Treatment, and Western Blot Analysis
Twenty five A600 units of cells grown under the indicated conditions were harvested, washed once with water, and resuspended in cold 350 μl of TNE lysis buffer (50 mm Tris-HCl, pH 7.4, containing 150 mm NaCl, 5 mm EDTA, Complete EDTA-free protease inhibitor mixture (Roche Applied Science), 1 mm PMSF, 3 μg/ml pepstatin, and 1 mm phosphatase inhibitor mix (Sigma)). A 1:1 volume of acid-washed glass beads was added to each sample and bead beat (two times, 1 min each) at 4 °C, followed by removal of unbroken cells and debris by centrifugation at 500 × g in a pre-cooled microcentrifuge (Eppendorf) for 5 min at 4 °C.
For phosphatase treatment, samples were enriched in Gat1-GFP by preparing microsomal fractions as described previously (8). Briefly, cells from a 250-ml culture of 0.5–0.7 A600 of cells were lysed using glass beads in 0.7 ml of GTE buffer (20% glycerol, 50 mm Tris-HCl, pH 7.4, 1 mm EDTA, Complete EDTA-free protease inhibitor mixture (Roche Applied Science), 1 mm PMSF, 3 μg/ml pepstatin, and 1 mm phosphatase inhibitor mix (Sigma)). Lysis was done by vortexing samples five times for 30 s with 30-s intervals on ice in-between. After transfering the lysate to a new tube, beads were washed with 0.5 ml of GTE buffer. The combined lysate was centrifuged at 16,000 × g for 15 min at 4 °C. The supernatant was then centrifuged at 450,000 × g for 15 min at 4 °C in a Beckman benchtop ultracentrifuge. The pellet was resuspended in GTE buffer lacking phosphatase inhibitors, as the microsomal samples were going to be subjected to phosphatase treatment.
For phosphatase assay, 40 μg of total protein from each microsomal preparation was acetone-precipitated in the presence of 5 μg of BSA (Sigma). Dried pellets were resuspended in phage λ-phosphatase buffer (50 mm Tris-HCl, pH 7.5, 0.1 mm EDTA, 5 mm dithiothreitol, 0.01% Brij 35, and 2 mm MnCl2). Samples were split in two and incubated for 15 min at 37 °C, with or without the addition of 400 units of λ-phosphatase (New England Biolabs). The reaction was stopped by addition of SDS-PAGE loading buffer.
Protein concentration was determined by the Lowry method (18) in the presence of 0.09% sodium deoxycholate using bovine serum albumin as a standard. Cell lysates were stored at −40 °C. For Western blot analysis, samples containing 50 μg of total protein were heated at 37 °C for 15 min, separated by 8% SDS-PAGE, and followed by transfer to polyvinylidene fluoride (PVDF) membrane (Millipore). An antibody directed against GFP (Roche Applied Science) and a peroxidase-conjugated secondary antibody were used to visualize GFP-tagged proteins by chemiluminescent signal detection (enhanced chemiluminescence kit (ECL), GE Healthcare). Densitometry of the blots was performed using ImageJ (Wayne Rasband, National Institutes of Health). Experiments were repeated at least four times.
Isolation and Characterization of Subcellular Fractions
Cells expressing Gat1p-GFP were grown to late stationary phase (38 h) on oleic acid medium and washed once with 0.5% BSA solution prior to application of the protocol for spheroplast and organelle preparation. Spheroplasts were prepared by treatment with zymolyase as described by Daum et al. (19). LPs were obtained at high purity by the method of Leber et al. (20). Mitochondria and microsomal fractions were obtained by following the protocol of Zinser et al. (21).
Prior to protein analysis, the LP fraction was delipidated. Nonpolar lipids were extracted with 2 volumes of diethyl ether. The organic phase was withdrawn, and residual diethyl ether was removed under a stream of nitrogen. Proteins from all fractions were precipitated from the aqueous phase with trichloroacetic acid at a final concentration of 10%. Protein pellets were solubilized in 0.1% SDS, 0.1 m NaOH at 37 °C. Protein quantification was performed by the method of Lowry et al. (18) using bovine serum albumin as a standard.
SDS-PAGE was carried out by the method of Laemmli (22). Samples were incubated at 37 °C to preserve proteins, and Western blot analysis was performed as described by Haid and Suissa (23) using antibodies against GFP (1:1,000; for Gat1-GFP detection; Roche Applied Science), Erg6p (1:10,000; LP), Ayr1p (1:5,000; LP), Wbp1p (1:10,000; ER), and Por1p (1:10,000; mitochondria). Peroxidase-conjugated secondary antibody and enhanced chemiluminescent signal detection reagents (Super-SignalTM, Pierce) were used to visualize immunoreactive bands.
Microscopy
For microscopic analysis, cells were concentrated and placed on slabs of solid medium made as described in Ref. 24. Coverslips were sealed, and cells were analyzed using an epifluorescence microscope (DMR; Leica, Germany) fitted with a Plan Apo ×100 oil immersion objective lens. Images were captured using a cooled CCD camera (Retiga 1350 EX, QImaging, Burnaby, British Columbia, Canada) and Volocity Software 5.0.2. For tridimensional analysis, fluorescent microscopy was performed in a Leica DI6000 microscope stand equipped with a piezo stage and connected to an ImagEM-1K camera, Hamamatsu and Quorum Technology, Canada. Z-stacks were acquired each 0.2 μm with a ×100 objective 1.4 NA. Micrographs were deconvolved and three-dimensionally rendered utilizing the software Volocity. Image J (National Institutes of Health) and Adobe Photoshop 7.0 were used for image analysis and preparation of figures.
Nile Red (1 mg/ml stock in DMSO) was added to live cells at a final concentration of 1 μg/ml and incubated for 30 min at 30 °C to allow uptake. Cells were then washed with synthetic minimal medium, concentrated by brief centrifugation, and imaged live immediately. Nile Red was visualized using RFP filters (λEx 553 nm; λEm 574 nm). Cells that showed bright fluorescence always corresponded to dark (dead) cells seen in the bright field and were therefore cropped from the images.
Transmission Electron Microscopy
Cells (1.5–2 A600) were pelleted and washed once with 1 m sorbitol, 0.5% BSA (fat-free Sigma). The cells were then fixed with 1.6% paraformaldehyde and 2.5% glutaraldehyde in 0.1 m cacodylate buffer, pH 7.4, for 30 min at 4 °C. They were then treated with 0.15 mg/ml Zymolyase (T20) in 50 mm Tris-HCl, 1 m sorbitol for 10 min at RT. After washing cells twice with PBS, the cells were post-fixed in 2% aqueous potassium permanganate for 1 h and then stained in 1% uranyl acetate for 1 h. The samples were dehydrated through a series of solutions containing increasing concentrations of ethanol and then embedded in Spurr's resin. Ultrathin sections were cut in a Reichert-Jung Ultracut E microtome using a diamond knife and stained with lead citrate. The sections were observed under a Hitachi H7650 TEM at 80 kV. The images were taken through an AMT 16000 digital camera mounted on the microscope.
Data Analysis
GraphPad Prism 3.03 software was used for statistical analysis of data and preparation of figures.
RESULTS
Cells Lacking Gat1p Do Not Accumulate Lipid Particles Induced by Oleic Acid
It is well known that oleate preferentially induces TAG synthesis and its accumulation in LPs in yeast (5, 14). Because radiolabeling studies have indicated that Gat1p and Gat2p differentially contribute to TAG synthesis (8), we decided to study their role in response to oleate. Therefore, in this work we investigated the effect of oleate in gat1Δ and gat2Δ mutants as well as their cellular localization during the induction of LP formation. For this purpose, a set of strains was used containing GAT1 or GAT2 C-terminally tagged with GFP, which was expressed from the endogenous locus and under control of the native promoter. The same set of wild type and mutant strains was previously utilized to study Gat1p and Gat2p localization during exponential growth in the presence of glucose (12).
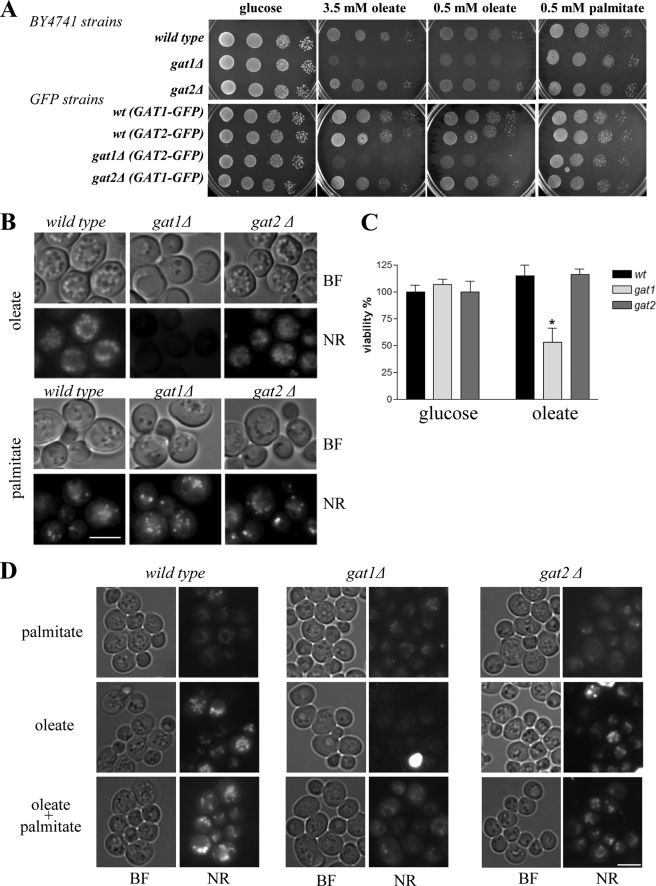
We found that cells lacking Gat1p, but not Gat2p, were sensitive to oleic acid (Fig. 1A). These findings are in agreement with those from a genome-wide screen performed with yeast cells of a closely related genetic background (15). In addition, wild type cells carrying Gat1-GFP were able to grow in the presence of oleic acid confirming that the fusion protein is functional (12). Furthermore, gat1Δ sensitivity to oleic acid was independent of the genetic background used as similar results were obtained with BY4741- (Fig. 1A) and W303-derived strains (data not shown). Microscopic inspection of cells treated with oleic acid for 24 h revealed that wild type cells were filled with large LPs, which were positively stained with Nile Red (Fig. 1, B and D). In great contrast, cells lacking Gat1p failed to accumulate large LPs, whereas LP formation in cells depleted of Gat2p was indistinguishable from wild type cells. It is important to note that under oleate culturing conditions, all cells studied were able to divide once after 24 h. Despite the lack of growth, no significant changes in cell viability were observed for wild type or gat2Δ cells at this time point. In contrast, ∼50% of cells lacking Gat1p lost viability (Fig. 1C). No such sensitivity was detected when gat1Δ cells were challenged with palmitate (Fig. 1A). Importantly, cells lacking Gat1p accumulated LPs to a similar number and size as wild type and gat2Δ strains in the presence of palmitate (Fig. 1, B and D). Moreover, small lipid droplets appeared in gat1Δ cells cultured in a mixture of palmitate and oleate (Fig. 1D). Altogether, these results point to a distinct role of Gat1p in the generation of LPs in response to oleic acid. The fact that cells lacking Gat1p are able to make LPs in the presence of palmitate suggests that the mechanism underlying LP formation in response to oleate directly depends on the presence of Gat1p and cannot be efficiently fulfilled by Gat2p.
FIGURE 1.
Differential effect of oleate on gat mutants. Deletion of mutants derived from the BY4741 genetic background or GFP strains were compared with their isogenic wild type strains. A, cells were grown to mid-log phase in defined medium containing glucose, serially diluted (1:10) starting from an A600 of 1, and spotted onto control plates containing the same medium plus 1% Tergitol and plates containing the indicated concentrations of oleate or palmitate plus 1% Tergitol. Plates were incubated at 30 °C for 3 days. B, same GFP strains from A were pre-grown in defined medium containing glucose and subsequently transferred to medium containing oleate or palmitate for 24 h. Cells were then stained with Nile Red (NR) and pictures taken using the same exposure time to allow direct comparison. Note: a 4-fold increase in exposure time allows detection of a faint Nile Red signal in gat1Δ cells grown in oleate (data not shown). BF, bright field; scale bar, 5 μm. C, to determine cell viability, an equal number of cells grown either on glucose- or oleate-containing medium (24 h) were plated onto rich medium plates (YPD), incubated for 3 days at 30 °C, and colonies counted. Results are expressed as percentage of wild type glucose control plates. Mean values were calculated from at least three independent experiments. *, p < 0.01 versus control. D, mutant strains derived from the BY4741 wild type strain were pre-grown in defined medium containing glucose to mid-log phase and then transferred to medium containing 0.5 mm palmitate, 3.5 mm oleate, or both combined (0.5 mm palmitate plus 3.5 mm oleate) for 24 h. Cells were then stained with Nile Red, and pictures were taken using the same exposure time to allow direct comparison. BF, bright field. Scale bar, 5 μm.
Distinct Response of Gat1p to Oleic Acid
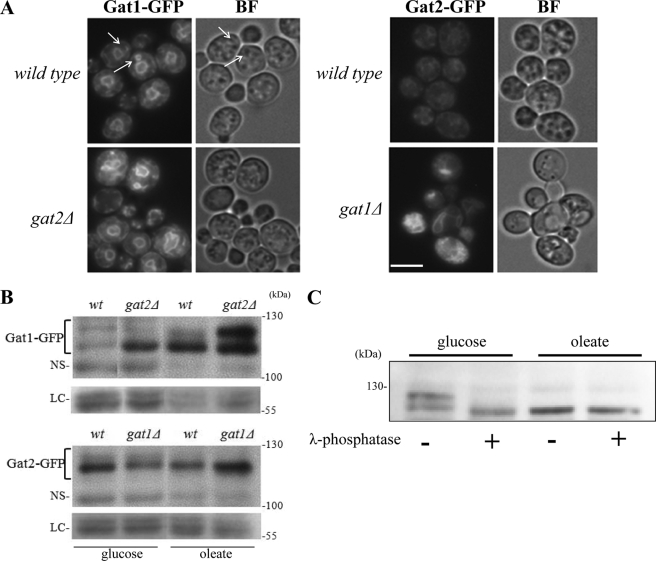
Next we examined the cellular localization of Gat1p and Gat2p after 24 h of treatment with oleic acid. Microscopy sections of wild type cells expressing Gat1p-GFP showed a bright signal demarking the perinuclear ER with several cytoplasmic extensions and connections with the cortical ER (Fig. 2A). Interestingly, the perinuclear ER was more irregular than in actively growing cells in the presence of glucose (Figs. 2A versus 5A), and the intensity of the signal was increased in cells lacking Gat2p (Fig. 2A, wild type Gat1-GFP versus gat2Δ Gat1-GFP). In great contrast with Gat1p, Gat2p signal was weaker and scattered throughout the cell in wild type yeast (Fig. 2A wild type Gat1-GFP versus wild type Gat2-GFP). Gat2p localization in gat1Δ cells was dramatically different, displaying a brighter signal associated with an aberrant membranous mesh, probably ER, considering that Gat2p is a microsomal protein (Fig. 2A, wild type Gat2-GFP versus gat1Δ Gat2-GFP).
FIGURE 2.
Cellular localization and protein analysis of yeast GPATs after treatment with oleic acid. A, strains expressing endogenous levels of Gat1-GFP or Gat2-GFP either in wild type or gat single knock-out mutants were incubated with 0.1% oleic acid for 24 h. Upper panels show live imaging of GAT1-GFP GAT2 and GAT2-GFP GAT1 (wild type background) and images in the lower panels correspond to single knock-out GAT1-GFP gat2 and GAT2-GFP gat1 strains. Arrows point to crescent and ring structures observed for Gat1p. BF, bright field. Scale bar, 5 μm. B, cells from the same cultures as used in A were collected and lysed in the presence of protease and phosphatase inhibitors. Cells were pre-grown in glucose-containing medium to mid-log phase (glucose) and then were transferred to medium containing 3.5 mm oleic acid for 24 h (oleate). Fifty μg of total protein was loaded onto an 8% SDS-PAGE. Proteins were transferred to a PVDF membrane and blotted against GFP. NS denotes the detection of a nonspecific band used as loading control. In addition, bands detected by staining the membranes with Red Ponceau before blotting are also shown to serve as an independent loading control (LC). Predicted molecular mass: Gat1p, 83.6 kDa; Gat1-GFP, 114 kDa; Gat2p, 85.7 kDa; Gat2-GFP, 116 kDa. C, microsomal fractions from wt-GAT1-GFP cells grown to log phase in defined medium containing 2% glucose or after transferred to 3.5 mm oleate medium for 4 h were prepared as indicated under “Experimental Procedures.” Twenty μg of total protein were then treated or not with λ-phosphatase followed by SDS-PAGE and Western blot analysis using anti-GFP antibodies.
FIGURE 5.
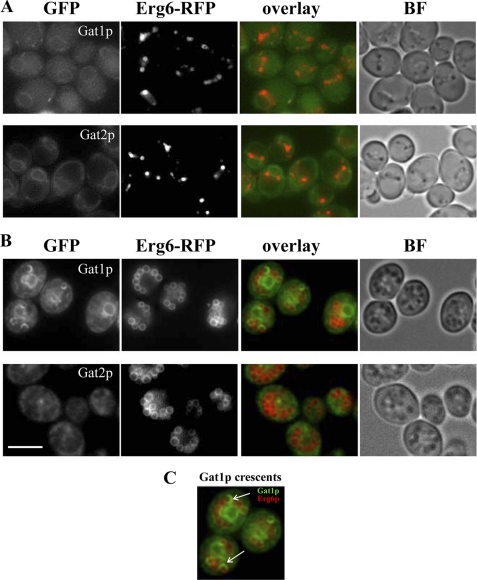
Co-localization studies of yeast GPATs with the ER/lipid droplet marker Erg6p before and after induction of lipid particle accumulation by oleic acid. Wild type cells expressing endogenous levels of Gat1-GFP or Gat2-GFP were crossed with a strain expressing endogenous levels of Erg6-RFP. The selected diploids were pre-grown to mid-log phase in defined medium containing 2% glucose (A, upper panels) and then transferred to medium containing 3.5 mm oleic acid for 48 h (B, lower panels). Live imaging of cells on agarose pads was done as indicated under “Experimental Procedures.” BF, bright field. Scale bar, 8 μm. C, enlargement of cells from B showing Gat1p crescent structures (arrows) following the curvature of the LP periphery.
Western blot analysis of these cells confirmed that the differences in GFP intensity observed between Gat1p and Gat2p after treatment with oleate corresponded in fact to differences in protein levels (Fig. 2B). An estimated 3.6 ± 1.1 (average ± S.E., n = 3)-fold increase in Gat1p levels was observed, although a 2.3 ± 0.5 (average ± S.E., n = 3)-fold decrease was registered for Gat2p after 24 h of treatment (wild type glucose versus oleate). Interestingly, the opposite behavior was observed for Gat2p in the absence of Gat1p, i.e. an increase in its protein levels (Fig. 2B gat1Δ glucose versus oleate). In addition to changes in protein levels, oleate also induced a clear change in the mobility of Gat1p. In fact, the change resembles the one we have previously described for cells lacking Gat2p, where Gat1p is mostly hypophosphorylated (see Ref. 12 and Fig. 2B, gat2Δ glucose versus wild type oleate). Phosphatase treatment of glucose- and oleate-treated samples (Fig. 2C) strongly supports that de-phosphorylation of Gat1p accounts for the mobility shift observed upon treatment with oleate. In summary, our results revealed a unique role of Gat1p in the cellular response to oleic acid that clearly differs from Gat2p. Gat1p is necessary for the cell to cope with excess oleic acid, which induces its de-phosphorylation, an increase in Gat1p protein levels as well as its expansion to ER extensions.
Accumulation of Lipid Particles in Response to Oleate Depends on Active Gat1p
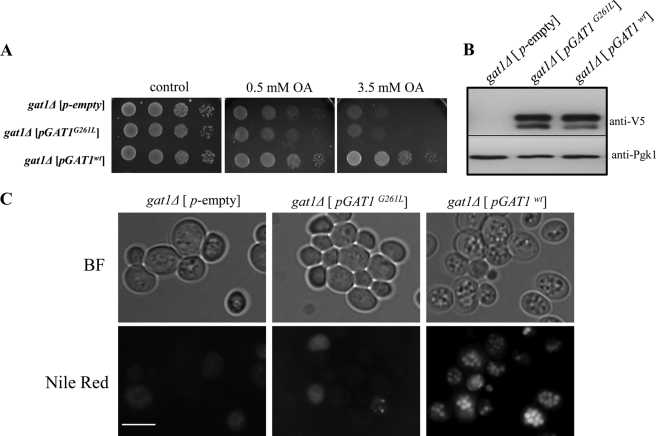
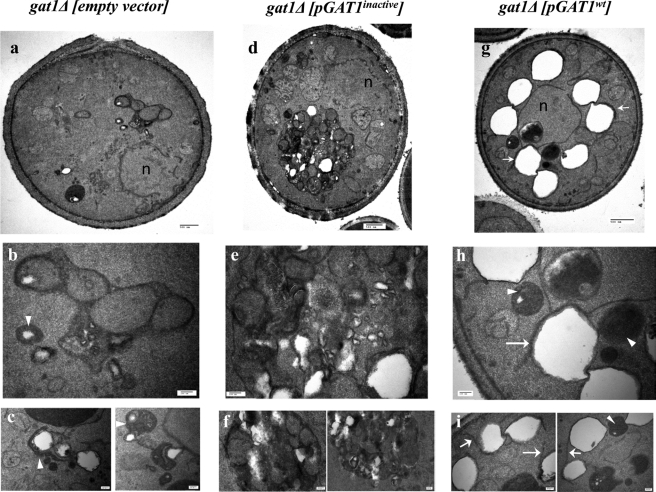
Next, we asked whether Gat1p activity is required for the accumulation of lipid particles induced by an excess of oleate. To test this, gat1Δ cells were transformed with plasmids containing the wild type GAT1 gene or a catalytically dead mutant G261L (see “Experimental Procedures”). Although expression of the wild type Gat1p protein reverted the oleate sensitivity phenotype of gat1Δ (Fig. 3A), cells remained sensitive in the case of the inactive mutant, despite being expressed at similar levels (Fig. 3B). Concomitantly, accumulation of lipid particles was restored when the wild type protein was present, as observed by Nile Red staining of LPs (Fig. 3C). Transformants from the same cultures used for fluorescence microscopy were fixed and processed for transmission electron microscopy inspection (Fig. 4). Few small LPs were observed in gat1Δ cells carrying the empty vector. These LPs were usually surrounded or in close association with electrodense structures of currently unknown origin (Fig. 4, b and c). In addition, dilated ER lumen and vesicles were often seen in these cells (Fig. 4a). Similar features were observed in gat1Δ cells from another genetic background (data not shown). Interestingly, the morphology of gat1Δ cells expressing the catalytically dead Gat1p was quite different. Small to very small LPs were “locked” in a heterogeneous large compartment, which is a signature of these cells (Fig. 4, d–f). This compartment was surrounded by a membrane and inside were clustered not only LPs but other round structures of diverse electrodensity. A closer look at these structures often revealed membranes or membrane tubules delimiting them (Fig. 4e). Additionally, dilation of the ER lumen was also seen in these cells (Fig. 4d). In great contrast, cells expressing active Gat1p displayed large LPs surrounding the nucleus (Fig. 4g). Some LPs were detected interacting with round electrodense compartments while close to the nucleus (Fig. 4, h and i, arrowheads). Additionally, LPs were often partially wrapped by membranes directly extending from the ER (Fig. 4h, arrow) or in other cases membranes connecting two or more LPs (Fig. 4i, arrows). Similar features were displayed by wild type and gat2Δ cells from a different genetic background grown on oleate (data not shown). Taken together, these results indicate that the accumulation of LPs induced by oleate depends on active Gat1p. In addition, the mere presence of Gat1p induces the formation of a unique structure that seems to lock LPs away from other cellular compartments.
FIGURE 3.
Dependence on active Gat1p for lipid particle accumulation in response to oleate. Cells lacking Gat1p (VZY31) were transformed with empty vector (pYES) or vector carrying wild type GAT1 or the catalytically dead mutant allele GAT1G261L. Transformants were grown to log phase in selective medium containing 2% galactose and then were used in serial dilution assays (A) or transferred to liquid medium containing 3.5 mm oleate (OA) for 24 h. Aliquots of oleate cultures were used for Western blot analysis using 5 μg of total protein from cell lysates (B) or cells were stained with Nile Red for fluorescence microscopy inspection (C). BF, bright field. Scale bar, 5 μm.
FIGURE 4.
Lipid droplet morphology of gat1Δ transformants. Electron micrographs of gat1Δ transformants grown 24 h in the presence of 3.5 mm oleate cultures were used in Fig. 3. Cells were transformed with empty vector (a–c), catalytically dead GAT1G261L (d–f), or wild type GAT1 (g–i). Close up of structures present in a, d, and g are shown in b, e, and h, respectively. Bottom panels show additional structures seen in other cells from the same samples. Arrowheads in b, c, h, and i indicate electrodense structures that interact with LPs close to the ER. Arrows in g–i point to membranes interacting with LPs. Scale bar in the top panels (a, d, and g) is 500 nm. In the rest of the panels the scale bar is 100 nm. Nucleus (n).
Unique Gat1p-enriched Structures Interact with Lipid Particles
From our microscopy observations, we noticed the presence of circular and semi-circular ER extensions enriched in Gat1p that were juxtaposed or forming part of lipid particles, based on bright field images (Fig. 2A, arrows). Similar extensions were also observed in electron microscopy images (Fig. 4, h and i, arrows). To further examine the localization of Gat1p with respect to LPs in more detail, we generated strains expressing Gat1-GFP and the LP marker Erg6 fused with RFP, and both were expressed from their endogenous loci (see under “Experimental Procedures”). Gat1p and Gat2p were mainly localized to the nucleus-associated ER in cells grown in glucose-containing medium (late log phase, Fig. 5A). In addition, they displayed two or more Erg6p containing LPs predominantly located at the corner formed between the ER and the vacuole membranes (Fig. 5A). Dramatic morphological changes were observed after treatment with oleic acid. Cells were filled with large LPs encircled by Erg6p (Fig. 5B). In the majority of the cells, LPs formed a collar decorating the nucleus-associated ER defined by a strong Gat1p signal. In addition, Gat1p was found in crescent structures closely associated with part of the circumference of LPs as delineated by Erg6p (Fig. 5, B and C). These structures were unique to Gat1p and were not observed for Gat2p (Fig. 5B).
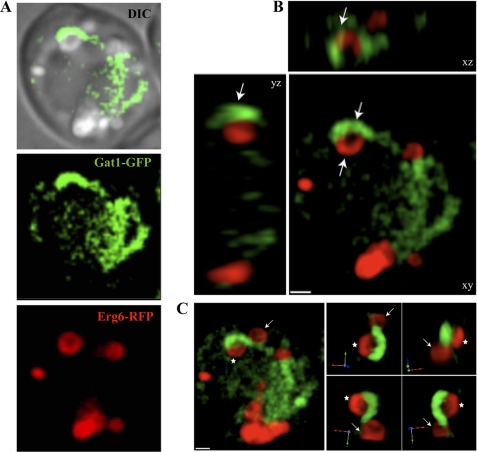
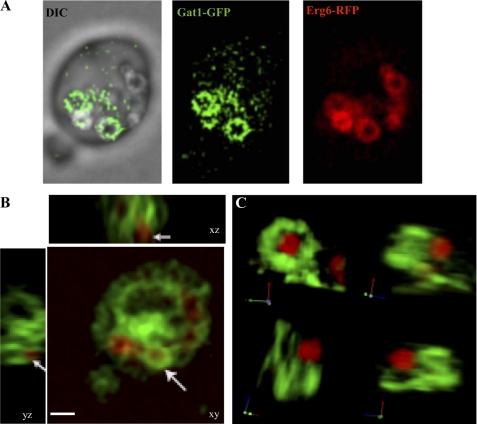
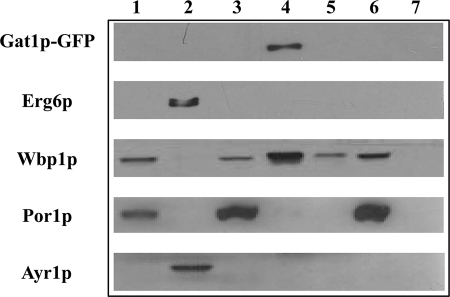
A three-dimensional analysis of Gat1p crescents revealed that these structures are juxtaposed to LPs and seem to be connected to the perinuclear ER through extensions with irregular Gat1p content (Fig. 6 and supplemental movie 1). Noteworthy, most LPs were not associated with Gat1p crescents but showed smaller points of contact with the perinuclear ER or traces of cortical ER containing Gat1p (Fig. 6). We especially want to point out the fine ring protruding from a crescent structure shown in supplemental movie 1. As a matter of fact, ring structures were also detected in some cells but not as often as crescents. An irregular Gat1p distribution was observed along the ring, although the void area inside complemented that of the LP (Fig. 7 and supplemental movie 2). Importantly, none of the various Gat1p structures analyzed from different cells and samples ever showed co-localization with LPs despite their clear association. In agreement with our microscopy results, subcellular fractionation failed to detect Gat1p in the LP fraction that was definitely enriched in Erg6p. Instead, Gat1p was found to be associated with 30,000 × g microsomes corresponding to the ER (Fig. 8).
FIGURE 6.
Juxtaposition of Gat1p crescents with lipid particles. A, diploid cells expressing endogenous levels of Gat1-GFP (green) and Erg6-RFP (red) were grown in medium containing 0.1% oleic acid for 24 h and analyzed by fluorescence microscopy. DIC, differential interference contrast. B, deconvolved xyz projections of the cell depicted in A showing details of the area of interaction between the Gat1p crescent and LP. Arrows point to the crescent structure in juxtaposition with LPs. C, three-dimensional rendering from the cell shown in A (left) and Gat1p crescent enlargement captured from different angles to appreciate the juxtaposition of the Gat1p crescent with LPs. For better orientation, an arrow and an asterisk were integrated into the picture. Scale, 1 μm.
FIGURE 7.
Three-dimensional analysis of Gat1p rings. Diploid cells expressing endogenous levels of Gat1-GFP and Erg6-RFP were grown in medium containing 0.1% oleic acid for 24 h and analyzed by fluorescence microscopy (A and B). DIC, differential interference contrast. B, xyz projections from deconvolved z-stacks of the cell depicted in A. Arrows point to the Gat1p crescent ring and LP. C, three-dimensional rendering of the Gat1 ring from B projected from different viewing angles. Note the lack of co-localization between the LP and the Gat1p ring. Scale, 1.5 μm.
FIGURE 8.
Subcellular localization of Gat1p-GFP in cells grown on oleic acid-containing minimal medium. Western blot analyses were performed with homogenate (lane 1), LPs (lane 2), the pellet fraction of LP isolation (lane 3), 30,000 × g microsomes (lane 4), 100,000 × g microsomes (lane 5), mitochondria (lane 6), and cytosol (lane 7) from Gat1p-GFP containing cells (wild type background; see “Experimental Procedures”). Antisera used were reacting with GFP, Erg6p, sterol-Δ24-methyltransferase, Ayr1p, 1-acyl dihydroxyacetone phosphate reductase (LP marker), Wbp1p, β subunit of the oligosaccharyltransferase glycoprotein complex (microsomal marker), and Por1p, mitochondrial porin (mitochondrial marker).
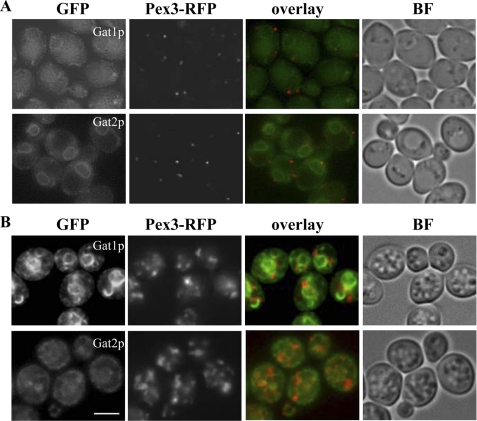
It is well known that oleic acid induces the proliferation of peroxisomes in yeast. Using the peroxisomal protein Pex3p fused to RFP as a marker clearly showed the effect of oleic acid resulting in a noticeable increase in the number of peroxisomes per cell (Fig. 9). Although partial overlap or points of contact of Pex3-RFP, with both Gat1p and Gat2p, were observed, Pex3-RFP and Gat1p did not co-localize in crescent structures. Thus, these structures seem to be dedicated to the interaction with LPs.
FIGURE 9.
Gat1p crescents do not co-localize with peroxisomes. Wild type cells expressing endogenous levels of Gat1-GFP or Gat2-GFP were crossed with a strain expressing endogenous levels of Pex3-RFP. The selected diploids were pre-grown to mid-log phase in defined medium containing 2% glucose (A, upper panels) and then transferred to medium containing 0.1% oleic acid for 48 h (B, lower panels). Live imaging of cells on agarose pads was done as indicated under “Experimental Procedures.” BF, bright field. Scale bar, 8 μm.
Oleate Induces Changes in Gat1p Localization and Phosphorylation Status at Early Time Points
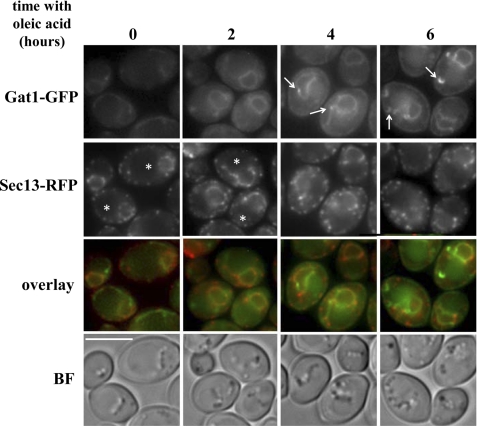
We next analyzed Gat1p and Gat2p localization during LP formation induced by oleate at early time points. For comparison, we used the coatomer (nuclear pore complex and COPII) protein Sec13p fused to RFP as another ER-associated protein that has been linked to the control of the flux of fatty acid into TAG or phospholipids (2, 25). Before induction, Gat1p and Gat2p uniformly labeled the ER membrane (Figs. 5A, 9A, and 10). In contrast, Sec13p showed a punctated distribution along the entire ER boundary (Fig. 10). After incubating cells for 2 h with oleate, no changes were observed for Gat2p (data not shown), although fluorescence intensity appreciably increased for Gat1p. Interestingly, Sec13p seemed to disappear from the ER area that is in close proximity to the vacuolar membrane. By 4 h, Gat1p signal increased and lost its uniform distribution displaying one or two small punctate structures associated with the ER (Fig. 10, arrows). These structures did not coincide with Sec13p enriched domains. After 6 h in the presence of oleate, small crescent structures were spotted in 28% of the cells. These Gat1p crescents coincided with lipid droplets (visualized by bright field) and did not co-localize with Sec13p. Although Gat2p signal was weaker at this time point, it was still possible to detect that Gat2p was confined to the perinuclear ER, maintaining its initial uniform distribution (data not shown).
FIGURE 10.
Gat1p crescents are detected at early time points after exposure to oleate. Wild type cells expressing endogenous levels of Gat1-GFP or Gat2-GFP were crossed with a strain expressing endogenous levels of the ER-Golgi marker Sec13-RFP. The selected diploids were pre-grown to mid-log phase in defined medium containing 2% glucose (time 0), transferred to medium containing 3.5 mm oleic acid, and inspected after growth in this medium for the indicated time. Live imaging of cells on agarose pads was done as described under “Experimental Procedures.” BF, bright field. It is interesting to note how Sec13p gets polarized to the nonvacuolar side (asterisk) of the ER upon incubation with oleate. Arrows point to ER regions enriched in Gat1p (4 h) and small Gat1p crescent structures (6 h). Scale bar, 8 μm.
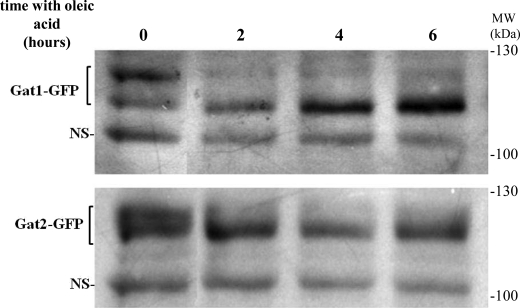
Western blot analysis of samples taken at early time points after transfer of cells from glucose to oleate-containing medium showed an apparent increase in Gat1p protein levels by 4 and 6 h. In addition a mobility shift was detected for both Gat1p and Gat2p as early as 2 h, indicative of de-phosphorylation (Figs. 11 and 2C) (12).
FIGURE 11.
Oleate induces dephosphorylation of yeast GPAT- Western blot analysis of Gat1-GFP or Gat2-GFP from wild type cells incubated for the indicated time points with 0.1% oleate. Prior to the shift, cells were pre-grown to the mid-log phase in glucose-containing medium (time 0). NS denotes the detection of a nonspecific band used as loading control.
Altogether, these results show a differential response to oleic acid at the GPAT level. At early time points, oleate induces changes in Gat1p distribution in the ER leading to the genesis of crescent structures tightly associated with LPs. These changes were not observed for Gat2p or Sec13p. In addition, oleate had a drastic effect on the phosphorylation status of GPATs, inducing their dephosphorylation at early time points.
DISCUSSION
The results of this study reveal a unique role of Gat1p in the response to oleic acid that clearly differs from that of Gat2p, supporting the idea that lipid fluxes are controlled at the GPAT step in yeast. This first committed and rate-limiting step in the biosynthesis of all glycerolipids is redundant in eukaryotes, and we and others have hypothesized that distinct GPAT isoforms contribute differentially to lipid pathway partitioning (8, 11, 12, 26, 27). Cells lacking Gat1p, but not Gat2p, are sensitive to oleic acid (this study and Ref. 15). Staining of oleate-grown gat1Δ cells with Nile Red followed by fluorescence microscopy revealed a failure in LP accumulation contrasting to wild type and gat2Δ strains. This was confirmed by electron microscopy (data not shown). In addition, gat1Δ cells treated with oleate displayed abnormal membranous structures associated with Gat2p. A similar aberrant ER morphology has been observed when Gat2p was overproduced in the absence of endogenous GPATs (12). In fact, Gat2p levels were increased in gat1Δ cells after treatment with oleate in comparison with wild type cells (see Fig. 2B). These results suggest that cells lacking Gat1p fail to accumulate neutral lipids (as per Nile Red staining) and thus try to accommodate oleate excess into membrane lipids. It is not clear at this point if this could be the reason behind the observed decrease in viability. Similarly, a growth defect in oleate-containing medium and enlarged ER membrane structures were observed in dga1Δ lro1Δ are1Δ are2Δ cells unable to produce LPs because of mutations in enzymes catalyzing the final acylation step in the synthesis of TAG and steryl esters (14). However, unlike the quadruple mutant, gat1Δ cells are capable of forming LPs during stationary phase or in response to palmitate (Fig. 1, B and D)4 revealing that all structural and functional components of LPs are present in gat1Δ mutant. Because accumulation of LPs induced by oleate depends on active Gat1p, we hypothesize that it is the inability of Gat2p to efficiently handle or channel oleic acid into TAG synthesis that causes the lack of LPs in gat1Δ cells. This assumption is supported by the fact that in vitro as well as in vivo Gat2p displays a clear preference for C16 fatty acids, whereas Gat1p reveals a broader substrate specificity also using C18 fatty acids as a substrate (9), meaning that Gat1p can use oleoyl-CoA efficiently but Gat2p cannot. Based on these biochemical data, it is conceivable that Gat1p is the preferred GPAT to deal with oleate when it becomes the predominant fatty acid in the cell. Interestingly, during exponential growth and in the presence of glucose, gat1Δ cells revealed a 30% increase in TAG synthesis compared with control as determined by [14C]acetate labeling (8). This indicates that Gat2p has an enhanced capacity for TAG formation from de novo synthesized fatty acids, and furthermore, it explains the presence of LPs in gat1Δ cells grown in the presence of glucose or palmitate. In addition to substrate preference, other molecular determinants may account for the differences observed between gat1Δ and gat2Δ cells grown in excess oleate. The fact that the catalytically dead Gat1p mutant displays a unique structure where LPs are trapped suggests that Gat1p-specific protein-protein or protein-lipid interactions may govern LP biogenesis and/or distribution within the cell. It is not clear how saturated and unsaturated fatty acids are made available to acyltransferases especially when their catalytic site is facing the ER lumen, as in the case proposed for Slc1p by Conzelmann and co-workers (28). Differences in Gat1p and Gat2p topology (active site facing cytosol or ER lumen) could also be critical for channeling certain fatty acids into TAG. All these possibilities are currently being assessed.
A combination of molecular and cellular events affecting Gat1p is triggered by a surplus of oleic acid in yeast. Among them are an increase in Gat1p level and the unique localization of this protein in crescent structures interacting with LPs, not observed for Gat2p. The increment in Gat1p levels became obvious as early as 4 h after shifting cells from glucose- to oleate-containing medium, reaching close to a 3-fold rise after 24 h. In agreement with our findings, a steady increase in GAT1 expression was detected by microarray analyses aimed at identifying genes with an expression profile responding to oleic acid (25). In this study, a peak in GAT1 expression was detected 9 h after shifting cells to oleate.
A drastic mobility shift of Gat1p as observed by Western blot analyses preceded the change in its protein level. A predominant band corresponding to a hypo-phosphorylated form of Gat1p appeared at early time points after transferring cells from glucose- to oleate-containing medium (Fig. 2C). Our previous work has correlated de-phosphorylation of GPATs with an enhancement of their function (12). Studies are underway to understand how phosphorylation may be regulating GPAT activity, protein life, and/or protein localization. Thus, an early response to oleate involves de-phosphorylation of the protein and a concomitant activation of gene expression that differentiates between GAT1 and GAT2. The net result of these changes is a significant increase in Gat1p levels during the time LPs are being formed and grow in number and size.
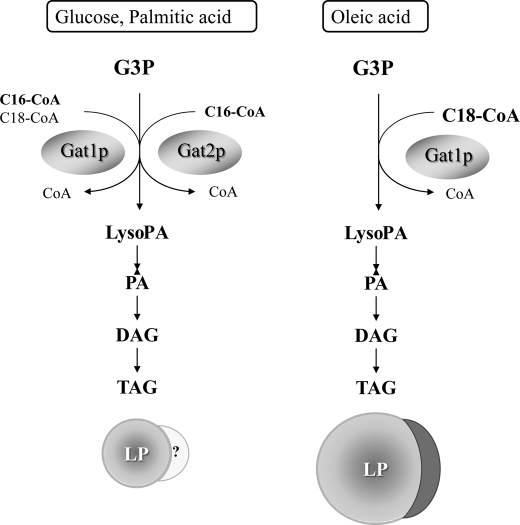
Unique Gat1p crescent structures were unveiled by live imaging of wild type cells treated with oleic acid. These structures were not detected for Gat2p or the NPC and COPII protein Sec13p (ER/Golgi) and did not co-localize with the peroxisomal marker Pex3p. Gat1p crescents partially overlapped with the lipid droplet marker Erg6p. Tridimensional analysis indicated that Gat1p semicircular structures are juxtaposed on top of LPs while still connected to the ER network. A recent study investigating the mechanism by which diacylglycerol acyltransferase Dga1p and the sterol-Δ24-methyltransferase Erg6p partition between the ER and LPs has shown a functional connection between these two organelles in yeast (6). Interestingly, electron microscopy analyses indicated that the ER is often seen in close association with LPs, following the curvature of the LP periphery over some distance (6). This morphological description corresponds well with that of Gat1p crescent structures we describe herein. We have noticed that the size of Gat1p crescents directly correlates with that of the LP with which they interact (compare Gat1p crescent from 4, 6, and 48 h, Fig. 10 versus Fig. 5). Jacquier et al. (6) were not able to detect similar structures in live imaging, probably because Dga1p and Erg6p are true LP resident proteins distributed along the entire surface of LPs (14). Our own fractionation study revealed that Gat1p is missing from purified LPs and associates with the ER (30,000 × g microsomes) further supporting our microscopy analysis. The fact that Gat1p crescents appear early in the response to oleate suggests that these structures play an important role in LP biogenesis. It would also position Gat1p in close proximity to a rich source of fatty acids once lipolysis is triggered. While this work was under revision, Kohlwein and co-workers (29) describe crescent ER structures associated with LPs formed in 5-day stationary phase cells. These crescent structures presumably drive inheritance of LPs to the daughter cells upon growth resumption (lipolytic conditions). In addition, Kohlwein and co-workers (29) demonstrated that cells lacking Fld1p (yeast seipin ortholog) have impaired lipolysis and LP inheritance. In these fld1 mutants the LPs appeared “entangled” in a network of ER membranes that resembled the structures seen in gat1Δ cells by transmission EM (Fig. 4, a and b). In the case of cells expressing a catalytically dead Gat1p, these structures seem to grow out of proportion, suggesting Gat1p interactions with other proteins or lipids induce its formation but generation of LysoPA (or downstream lipids) is required for its normal development. We propose a model where Gat1p and Gat2p contribute differentially to channel fatty acids into TAG, depending on the nature of the fatty acid as well as on the presence of glucose (Fig. 12). Importantly, both Gat1p and Gat2p can fulfill each other's role when palmitate is the predominant fatty acid in the cell. In clear contrast, channeling of oleate and LP formation are dependent on active Gat1p.
FIGURE 12.
Control of fatty acid fluxes by yeast GPATs. The model proposes a different role for Gat1p and Gat2p in the synthesis of TAG and formation of LPs depending on the nature of the fatty acid (palmitate versus oleate) and the presence of glucose. Absolute dependence of LP formation on Gat1p in the presence of oleate is highlighted with the formation of crescent structures associated with LPs. Although no crescent structures or LP association has been described for Gat2p, so far the fact that Gat2p contributes to TAG synthesis during log phase (8) opens this possibility for further investigation. G3P, glycerol-3-phosphate; DAG, diacylglycerol; PA, phosphatidic acid.
Supplementary Material
Acknowledgments
The thoughtful comments of G. Bertolesi and P. F. Murray are gratefully acknowledged. V. Z. and M. T. thank S. Moreno de Colonna for mentorship and encouragement. We thank J. Kearley for technical assistance.
This work was supported by operating grants from the National Sciences and Engineering Research Council (to V. Z. and M. T.), a University Faculty Award from National Sciences and Engineering Research Council (to V. Z.), and by Austrian Science Fund Project P21251 (to K. A.).

This article contains supplemental Movies 1 and 2.
V. Zaremberg, unpublished results.
- TAG
- triacylglycerol
- GPAT
- glycerol-3-phosphate acyltransferase
- LP
- lipid particle
- ER
- endoplasmic reticulum.
REFERENCES
- 1. Goodman J. M. (2009) Demonstrated and inferred metabolism associated with cytosolic lipid droplets. J. Lipid Res. 50, 2148–2156 [DOI] [PMC free article] [PubMed] [Google Scholar]
- 2. Kohlwein S. D. (2010) Triacylglycerol homeostasis. Insights from yeast. J. Biol. Chem. 285, 15663–15667 [DOI] [PMC free article] [PubMed] [Google Scholar]
- 3. Zweytick D., Athenstaedt K., Daum G. (2000) Intracellular lipid particles of eukaryotic cells. Biochim. Biophys. Acta 1469, 101–120 [DOI] [PubMed] [Google Scholar]
- 4. Athenstaedt K., Jolivet P., Boulard C., Zivy M., Negroni L., Nicaud J. M., Chardot T. (2006) Lipid particle composition of the yeast Yarrowia lipolytica depends on the carbon source. Proteomics 6, 1450–1459 [DOI] [PubMed] [Google Scholar]
- 5. Grillitsch K., Connerth M., Köfeler H., Arrey T. N., Rietschel B., Wagner B., Karas M., Daum G. (2011) Lipid particles/droplets of the yeast Saccharomyces cerevisiae revisited. Lipidome meets Proteome. Biochim. Biophys. Acta 1811, 1165–1176 [DOI] [PMC free article] [PubMed] [Google Scholar]
- 6. Jacquier N., Choudhary V., Mari M., Toulmay A., Reggiori F., Schneiter R. (2011) Lipid droplets are functionally connected to the endoplasmic reticulum in Saccharomyces cerevisiae. J. Cell Sci. 124, 2424–2437 [DOI] [PubMed] [Google Scholar]
- 7. Czabany T., Athenstaedt K., Daum G. (2007) Synthesis, storage, and degradation of neutral lipids in yeast. Biochim. Biophys. Acta 1771, 299–309 [DOI] [PubMed] [Google Scholar]
- 8. Zaremberg V., McMaster C. R. (2002) Differential partitioning of lipids metabolized by separate yeast glycerol-3-phosphate acyltransferases reveals that phospholipase D generation of phosphatidic acid mediates sensitivity to choline-containing lysolipids and drugs. J. Biol. Chem. 277, 39035–39044 [DOI] [PubMed] [Google Scholar]
- 9. Zheng Z., Zou J. (2001) The initial step of the glycerolipid pathway. Identification of glycerol 3-phosphate/dihydroxyacetone phosphate dual substrate acyltransferases in Saccharomyces cerevisiae. J. Biol. Chem. 276, 41710–41716 [DOI] [PubMed] [Google Scholar]
- 10. Athenstaedt K., Daum G. (1997) Biosynthesis of phosphatidic acid in lipid particles and endoplasmic reticulum of Saccharomyces cerevisiae. J. Bacteriol. 179, 7611–7616 [DOI] [PMC free article] [PubMed] [Google Scholar]
- 11. Athenstaedt K., Weys S., Paltauf F., Daum G. (1999) Redundant systems of phosphatidic acid biosynthesis via acylation of glycerol 3-phosphate or dihydroxyacetone phosphate in the yeast Saccharomyces cerevisiae. J. Bacteriol. 181, 1458–1463 [DOI] [PMC free article] [PubMed] [Google Scholar]
- 12. Bratschi M. W., Burrowes D. P., Kulaga A., Cheung J. F., Alvarez A. L., Kearley J., Zaremberg V. (2009) Glycerol-3-phosphate acyltransferases gat1p and gat2p are microsomal phosphoproteins with differential contributions to polarized cell growth. Eukaryot. Cell 8, 1184–1196 [DOI] [PMC free article] [PubMed] [Google Scholar]
- 13. Gidda S. K., Shockey J. M., Falcone M., Kim P. K., Rothstein S. J., Andrews D. W., Dyer J. M., Mullen R. T. (2011) Hydrophobic domain-dependent protein-protein interactions mediate the localization of GPAT enzymes to ER subdomains. Traffic 12, 452–472 [DOI] [PubMed] [Google Scholar]
- 14. Connerth M., Czabany T., Wagner A., Zellnig G., Leitner E., Steyrer E., Daum G. (2010) Oleate inhibits steryl ester synthesis and causes liposensitivity in yeast. J. Biol. Chem. 285, 26832–26841 [DOI] [PMC free article] [PubMed] [Google Scholar]
- 15. Lockshon D., Surface L. E., Kerr E. O., Kaeberlein M., Kennedy B. K. (2007) The sensitivity of yeast mutants to oleic acid implicates the peroxisome and other processes in membrane function. Genetics 175, 77–91 [DOI] [PMC free article] [PubMed] [Google Scholar]
- 16. Huh W. K., Falvo J. V., Gerke L. C., Carroll A. S., Howson R. W., Weissman J. S., O'Shea E. K. (2003) Global analysis of protein localization in budding yeast. Nature 425, 686–691 [DOI] [PubMed] [Google Scholar]
- 17. Lewin T. M., Wang P., Coleman R. A. (1999) Analysis of amino acid motifs diagnostic for the sn-glycerol-3-phosphate acyltransferase reaction. Biochemistry 38, 5764–5771 [DOI] [PubMed] [Google Scholar]
- 18. Lowry O. H., Rosebrough N. J., Farr A. L., Randall R. J. (1951) Protein measurement with the Folin phenol reagent. J. Biol. Chem. 193, 265–275 [PubMed] [Google Scholar]
- 19. Daum G., Böhni P. C., Schatz G. (1982) Import of proteins into mitochondria. cytochrome b2 and cytochrome c peroxidase are located in the intermembrane space of yeast mitochondria. J. Biol. Chem. 257, 13028–13033 [PubMed] [Google Scholar]
- 20. Leber R., Zinser E., Zellnig G., Paltauf F., Daum G. (1994) Characterization of lipid particles of the yeast, Saccharomyces cerevisiae. Yeast 10, 1421–1428 [DOI] [PubMed] [Google Scholar]
- 21. Zinser E., Sperka-Gottlieb C. D., Fasch E. V., Kohlwein S. D., Paltauf F., Daum G. (1991) Phospholipid synthesis and lipid composition of subcellular membranes in the unicellular eukaryote Saccharomyces cerevisiae. J. Bacteriol. 173, 2026–2034 [DOI] [PMC free article] [PubMed] [Google Scholar]
- 22. Laemmli U. K. (1970) Cleavage of structural proteins during the assembly of the head of bacteriophage T4. Nature 227, 680–685 [DOI] [PubMed] [Google Scholar]
- 23. Haid A., Suissa M. (1983) Immunochemical identification of membrane proteins after sodium dodecyl sulfate-polyacrylamide gel electrophoresis. Methods Enzymol. 96, 192–205 [DOI] [PubMed] [Google Scholar]
- 24. Tatchell K., Robinson L. C. (2002) Use of green fluorescent protein in living yeast cells. Methods Enzymol. 351, 661–683 [DOI] [PubMed] [Google Scholar]
- 25. Gaspar M. L., Jesch S. A., Viswanatha R., Antosh A. L., Brown W. J., Kohlwein S. D., Henry S. A. (2008) A block in endoplasmic reticulum-to-Golgi trafficking inhibits phospholipid synthesis and induces neutral lipid accumulation. J. Biol. Chem. 283, 25735–25751 [DOI] [PMC free article] [PubMed] [Google Scholar]
- 26. Gimeno R. E., Cao J. (2008) Thematic review series. Glycerolipids. Mammalian glycerol-3-phosphate acyltransferases. New genes for an old activity. J. Lipid Res. 49, 2079–2088 [DOI] [PubMed] [Google Scholar]
- 27. Coleman R. A. (2007) How do I fatten thee? Let me count the ways. Cell Metab. 5, 87–89 [DOI] [PMC free article] [PubMed] [Google Scholar]
- 28. Pagac M., de la Mora H. V., Duperrex C., Roubaty C., Vionnet C., Conzelmann A. (2011) Topology of 1-acyl-sn-glycerol-3-phosphate acyltransferases SLC1 and ALE1 and related membrane-bound O-acyltransferases (MBOATs) of Saccharomyces cerevisiae. J. Biol. Chem. 286, 36438–36447 [DOI] [PMC free article] [PubMed] [Google Scholar]
- 29. Wolinski H., Kolb D., Hermann S., Koning R. I., Kohlwein S. D. (2011) A role for seipin in lipid droplet dynamics and inheritance in yeast. J. Cell Sci. 124, 3894–3904 [DOI] [PubMed] [Google Scholar]
Associated Data
This section collects any data citations, data availability statements, or supplementary materials included in this article.


