Abstract
Cerebral microbleeds (CMBs) are findings in patients with neurological disorders such as cerebral amyloid angiopathy and Alzheimer's disease, and are indicative of an underlying vascular pathology. A diagnosis of CMBs requires an imaging method that is capable of detecting iron-containing lesions with high sensitivity and spatial accuracy in the presence of potentially confounding tissue abnormalities. In this study, we investigated the feasibility of quantitative magnetic susceptibility mapping (QSM), a novel technique based on gradient-recalled echo (GRE) phase data, for the detection of CMBs in the arcAβ mouse, a mouse model of cerebral amyloidosis. Quantitative susceptibility maps were generated from phase data acquired with a high-resolution T2*-weighted GRE sequence at 9.4 T. We examined the influence of different regularization parameters on susceptibility computation; a proper adjustment of the regularization parameter minimizes streaking artifacts and preserves fine structures. In the present study, it is shown that QSM provides increased detection sensitivity of CMBs and improved contrast when compared with GRE magnitude imaging. Furthermore, QSM corrects for the blooming effect observed in magnitude and phase images and depicts both the localization and spatial extent of CMBs with high accuracy. Therefore, QSM may become an important tool for diagnosing CMBs in neurological diseases.
Keywords: Alzheimer's disease, cerebral amyloid angiopathy, magnetic resonance imaging, phase, quantitative susceptibility mapping, susceptibility-weighted imaging
Introduction
Cerebral microbleeds (CMBs) are histopathologic and radiologic findings observed in patients with cerebrovascular and neurodegenerative diseases, and also in the normal aging population (Jellinger et al, 2007; Pettersen et al, 2008; Greenberg et al, 2009). CMBs have been implicated in the pathophysiology of cerebral amyloid angiopathy (CAA) and Alzheimer's disease (AD), where they have a prevalence of 80% and 30%, respectively (Pettersen et al, 2008). The frequency of CMBs is correlated with the degree of cognitive decline, although the relation depends on both the extent and the location of the CMBs (Pettersen et al, 2008). The detection of CMBs in AD patients may have therapeutic implications: CMBs may be considered a counterindication for novel therapies in view of the putative risk of developing hemorrhage or encephalopathy (Cordonnier and van der Flier, 2011). Therefore, knowledge of both the load and spatial distribution of CMBs in patients with CAA and AD is critical for diagnosis and management of patients.
A diagnosis of CMBs requires an imaging method that is capable of detecting iron-containing lesions with high sensitivity and spatial accuracy in the presence of potentially confounding tissue abnormalities. Today, magnetic resonance imaging (MRI) using T2*-weighted gradient-recalled echo (GRE) sequences is applied routinely because of their high sensitivity to paramagnetic iron compounds such as hemosiderin found in blood degradation products (Andrews et al, 1987; Greenberg et al, 2009). The GRE magnitude images are analyzed for identification of CMBs, which typically occur as round or ovoid areas displaying decreased signal intensity (Greenberg et al, 2009). However, information derived from magnitude images lacks the ability to differentiate between iron and other sources that induce changes in susceptibility, e.g., calcifications. Furthermore, because of the blooming effect, the true size of the CMB is overestimated which impedes diagnostic assessment of the extent of CMBs and discrimination of multiple CMBs in close vicinity to each other.
The MRI signal is governed by the dynamics of the transverse component of the magnetization vector, which is defined by both its magnitude and phase. The signal phase is proportional to the local resonance frequency and therefore directly reflects magnetic field variations induced by the local magnetic susceptibility distribution. Hence, mapping phase values yields images with tissue contrast complementary to the contrast observed in magnitude images (Rauscher et al, 2005; Duyn et al, 2007; Deistung et al, 2008; Marques et al, 2009).
Magnitude and phase information may be combined in the so-called susceptibility-weighted imaging (SWI), which amplifies the contrast of iron-loaded brain structures present in magnitude images (Reichenbach et al, 1997). Both phase imaging and SWI have been applied to probe changes in iron content and blood products in patients with neurological diseases (Essig et al, 1999; Reichenbach et al, 2000; Schad, 2001; Barth et al, 2003). Furthermore, SWI was applied to patients with mild cognitive impairment and CAA for detecting CMBs and was found to be more sensitive than GRE magnitude imaging (Ayaz et al, 2010). One limitation of GRE phase imaging and SWI is the nonlocal nature of phase effects. The signal phase will also be affected in areas that extend beyond the actual size of the dia- or paramagnetic inclusion. Moreover, phase values depend on the geometry of the lesion and its relative orientation to the main magnetic field (Schäfer et al, 2009). With SWI, the blooming effect is enhanced when compared with magnitude images, which can lead to an overestimation of the CMB size of up to 300% (Schrag et al, 2010).
These limitations may be overcome by converting GRE phase images into susceptibility maps that represent an intrinsic tissue property and are therefore (1) independent of data acquisition parameters and (2) should reflect the actual spatial extent of lesions. The feasibility of quantitative susceptibility mapping (QSM) has been shown for tissue phantoms and human brain (Shmueli et al, 2009; Schweser et al, 2010; de Rochefort et al, 2010; Wharton and Bowtell, 2010). It has, e.g., recently been shown that QSM enables discrimination between diamagnetic and paramagnetic inclusions (Schweser et al, 2010). Therefore, QSM may be more suitable to accurately identify CMBs than magnitude and phase imaging or SWI. Moreover, because magnetic susceptibility of an iron-containing lesion is related to the concentration of iron, QSM may also be applied to noninvasively quantify iron concentration in CMBs and other lesions (Schenk, 1996; Schweser et al, 2011).
In the current study, we investigated the feasibility of using QSM for detection of CMBs in the arcAβ mouse, a genetic mouse model of cerebral amyloidosis (Knobloch et al, 2007). Data were acquired with a high-resolution T2*-weighted GRE sequence at 9.4 T. The QSMs were computed using a regularization procedure, minimizing the difference between the measured phase values and those simulated on the basis of an a priori unknown magnetic susceptibility distribution (de Rochefort et al, 2010). We investigated the influence of choosing different values of the QSM regularization parameter on the susceptibility computation. To explore the full diagnostic value of QSM for CMB detection, we investigated image quality and lesion conspicuity and compared both with magnitude image, phase, and SWI reconstruction. For validation, we compared QSM with histologic analyses.
Materials and methods
Animals
All experimental procedures conformed to the national guidelines of the Swiss Federal Act on Animal Protection and were approved by an official committee (license 172-2008, Cantonal Veterinary Office, Zurich, Switzerland). The arcAβ mice were generated, which express the human APP 695 containing both the Swedish and the Arctic mutation under the control of the prion protein promoter as described previously (Knobloch et al, 2007). Three transgenic (arcAβ) mice and six wild-type (wt) littermates (Division of Psychiatry Research, University of Zurich) at 18 months of age were used. Animals were kept at standard housing conditions with a 12-hour dark/light cycle and were provided with water and food ad libitum.
Magnetic Resonance Imaging
Animal experiments were carried out on a Bruker BioSpec 94/30 (Bruker BioSpin GmbH, Ettlingen, Germany) small animal MR system operating at 400 MHz. A cryogenic quadrature radiofrequency surface coil probe (Bruker BioSpin AG, Fällanden, Switzerland) was used for radiofrequency signal transmission and reception. For the MRI measurements, anesthesia was induced by using 3% isoflurane (Abbott, Cham, Switzerland) in a 4:1 air/oxygen mixture and maintained with 1.2% isoflurane. Mice were endotracheally intubated and mechanically ventilated with 90 breaths/min, applying a respiration cycle of 25% inhalation and 75% exhalation (MRI-1 Volume Ventilator, CWI Inc., Ardmore, PA, USA). Body temperature was monitored with a rectal temperature probe (MLT415, ADInstruments, Spechbach, Germany). Temperature was kept at 36.0±0.5°C using a warm-water circuit integrated into the animal support (Bruker BioSpin AG). Anatomical reference data were acquired in coronal and sagittal directions. Fieldmap-based shimming was performed using the automated MAPshim routine to improve the homogeneity of the magnetic field. Subsequently, 3D velocity compensated GRE data sets were collected with a TE of 12 ms and TR of 250 ms, a radiofrequency pulse angle of α=15°, and no averaging. A horizontal slab of 15 × 12 × 2.2 mm3 was recorded using a matrix of 248 × 199 × 36, resulting in isotropic voxel dimensions of 60 × 60 × 60 μm3. The acquisition time was 29 minutes and 51 seconds.
Data Processing
Complex images were obtained after 3D inverse Fourier transform of complex GRE k-space data. Low spatial frequency signal variations in GRE magnitude images arising from inhomogeneous radiofrequency excitation by the surface coil (bias field) were estimated using FSL (FMRIB, Oxford, England) and compensated for by subtracting the estimated bias field from the original intensity values (Zhang et al, 2001). Subsequently, brain tissue of mice was manually segmented using MRIcro (Rorden and Brett, 2000). This brain tissue mask was applied to all MR images to remove extracranial structures.
Phase aliasing was resolved by using a 3D phase unwrapping algorithm (Abdul-Rahman et al, 2007). Background phase contributions were eliminated for brain tissue using the projection onto dipole field technique (de Rochefort et al, 2010; Liu et al, 2011). The brain tissue mask was applied to discriminate field contributions from susceptibility sources inside and outside of the brain. A triangular weighting function was applied to the background-corrected phase to generate a phase mask. Susceptibility-weighted images were then computed by fourfold multiplication of the phase mask with the corresponding magnitude image (Reichenbach and Haacke, 2001).
Quantitative susceptibility maps were computed based on the relative difference field, which is the background-corrected phase divided by TE, gyromagnetic ratio for protons, and the magnetic field strength of the MRI system. Afterwards, the measured relative difference field values were reformatted into a vector 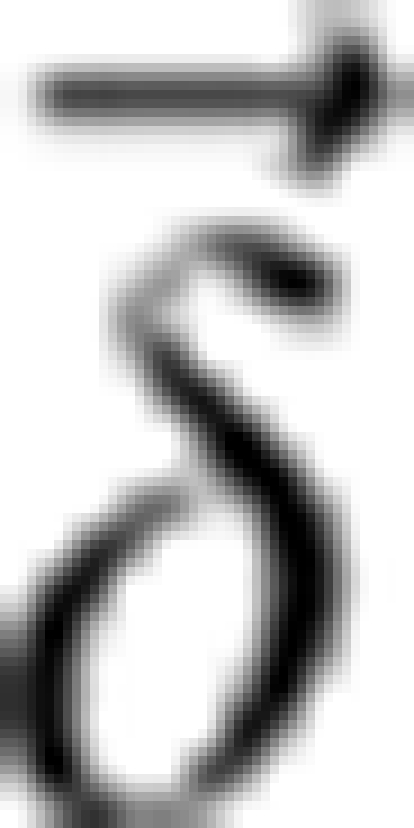 and the following optimization problem was solved:
 |
The first term is the squared Euclidean distance between the relative difference field and the simulated field  , where
 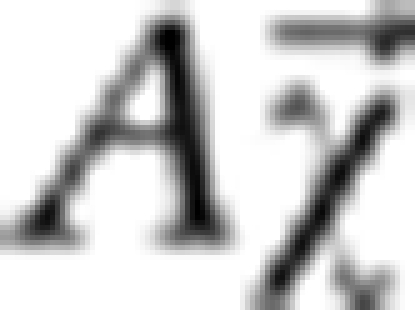 replicates the relative difference field due to the susceptibility distribution
 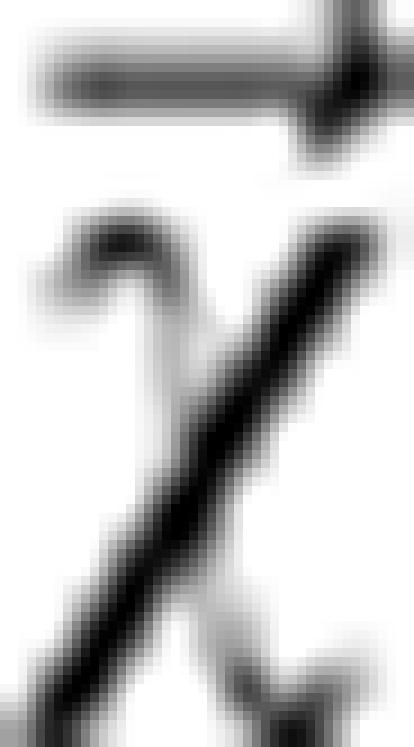 , and
, and 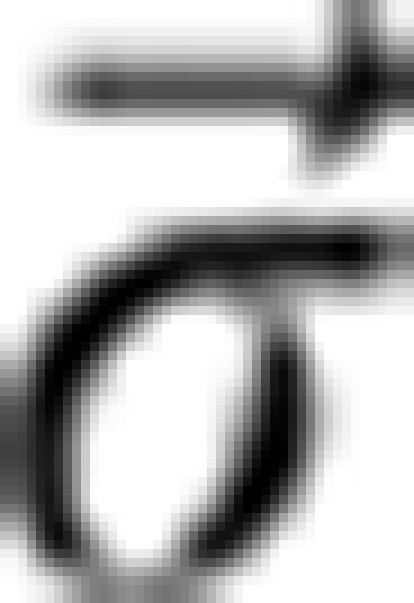 denotes a local offset (Schweser et al, 2010). The weighting parameter α was set to unity. The second term is the regularization term, which incorporates edge information from the magnitude images into the susceptibility calculation. Here, G is the discrete 3D gradient operator, W the inverse of the Euclidean norm of the gradient of the GRE magnitude image, and β is the regularization parameter that controls the smoothness of the solution (de Rochefort et al, 2010). The 3D median filtering with a kernel size of 300 × 300 × 300 μm3 was applied to the inverse of the Euclidian norm of the gradient of magnitude data before the maximum value was calculated to normalize W in the range of 0 and 1. Remaining values of W above 1 were set to unity. For the animal data, β values were chosen on a logarithmic scale within the range of 0.01 and 100.
Data Analysis
Mean and s.d. of several volumes of interest were computed for β ranging from 0.01 to 100. Symmetrical gray-level co-occurrence matrices of a representative slice were computed in horizontal, diagonal, and vertical in-plane direction using a distance of 60 μm (Haralick et al, 1973). The gray-level co-occurrence matrix analysis was performed by measuring signal variations between a pixel and its neighbor over representative regions (Haralick et al, 1973). With the assumption that susceptibility maps obtained with β=0.01 reveal the correct mean susceptibility, the influence of the regularization parameter β on the relative accuracy was calculated as the ratio of the mean susceptibility for a given value of β and the mean susceptibility calculated for the reference value β=0.01. This was done for 33 CMBs.
The number of CMBs was estimated on magnitude, phase, SWI, and QSM reconstructed images by counting regions of isolated circular shape in three horizontal slices for each arcAβ mouse using MRIcron (www.sph.sc.edu/comd/rorden/mricron/). Additional slices above and below the slice of interest were reviewed to ensure that a suspected CMB was not a vessel cross-section. Regions of interest (ROI) were manually drawn around the CMBs. The areas of the CMBs were measured. Contrast-to-noise (CNR) ratios were determined by calculating the differences in signal intensity between ROIs of CMBs and adjacent tissue, divided by s.d. of the noise. For estimating the noise, the ROI was placed over a homogeneous region in the ventricle. The CNR values were calculated for four regions separately and then averaged.
Volumes of interest were identified for different cerebral regions (cortex, hippocampus, striatum, white matter, and ventricle), excluding CMBs. The ROI analysis was performed for CMBs. Volumes of interest and ROIs were transferred to susceptibility maps to determine susceptibility differences between cerebral regions and CMBs to cerebrospinal fluid.
Immunohistochemistry
All animals were deeply anesthetized by intraperitoneal injection of ketamine/xylazine (100/20 mg/kg body weight) and perfused transcardially with phosphate-buffered saline (PBS, pH 7.4), followed by 4% paraformaldehyde containing 15% picric acid in PBS (Sigma-Aldrich, St Louis, MO, USA). Brains were postfixed for 24 hours at 4°C and cryoprotected for 24 hours in 30% sucrose. Serial sections (40 μm) were collected and stored at −20°C in cryoprotectant solution. A 15 minute pepsin pretreatment (0.15 mg/ml in 0.2 mol/L HCl at 37°C) was applied to the free-floating sections for epitope unmasking and reduction of nonspecific staining. Sections were then washed three times in PBS and incubated overnight at 4°C in the primary antibody solution containing mouse anti-human Aβ1-17 monoclonal antibodies (Covance, Princeton, NJ, USA, clone 6E10, SIG-39320, 1:2,000) diluted in PBS containing 2% normal goat serum and 0.2% Triton X-100. After three washes in PBS, sections were incubated for 30 minutes in biotinylated secondary goat-anti-mouse antibodies (Jackson ImmunoResearch Laboratories, West Grove, PA, USA, 1:500) at room temperature, followed by three rinses in PBS, incubation with Vectastain Kit (Vector Laboratories, Burlingame, CA, USA), and the 3,3-diaminobenzidine (DAB; Sigma-Aldrich) staining for 10 minutes. For Prussian blue staining, sections were mounted on gelatinized glass slides, air-dried, and then immersed for 20 minutes in aqueous hydrochloride acid (10%) and potassium ferrocyanide (5%, Sigma-Aldrich, 1:1 mix prepared immediately before use). After three washes in distilled water, sections were counterstained with Eosin (Sigma-Aldrich) for 3 minutes, dehydrated through ethanol, cleared in xylene, and coverslipped with resinous mounting medium (Eukitt, Sigma-Aldrich).
Histologic sections were analyzed with bright-field microscopy. Digital images were acquired with a × 20 Apochromate objective (N.A. 0.75. Zeiss, Jena, Germany) and a color digital camera (AxioCam, Zeiss) controlled by AxioVision 4.1 software (Zeiss). For visual display, images were cropped, and adjusted for brightness and contrast using Adobe Photoshop (Adobe Systems, San Jose, CA, USA). For quantitative analyses of the size of the CMBs, a threshold was applied to Prussian blue-labeled sections using ImageJ software (ImageJ; NIH, Bethesda, MD, USA). The resulting binary images were segmented to outline the individual CMBs. The corresponding masks were analyzed with regard to the total area covered by the histologic dye.
Statistical Analysis
Data are presented as mean±s.d. Student's t-test and Mann–Whitney rank-sum tests were used for comparison of diagnostic readouts (number of detected CMBs, estimated extent of CMB) and values of differences in magnetic susceptibility, where appropriate.
Results
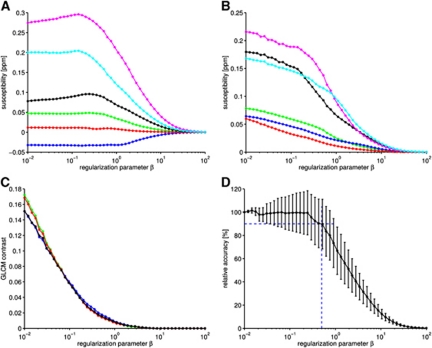
One critical aspect in the computation of QSMs is the proper adjustment of the regularization parameter β in equation (1) (Wharton and Bowtell, 2010). We first quantitatively assessed the influence of choosing different values of β in the regularization procedure on the quality of the computed susceptibility map. Plotting susceptibility values of several anatomical regions as a function of β (Figure 1A) reveals that for large homogeneous brain structures characterized by relatively low spatial frequencies (white matter, gray matter, and ventricles) magnetic susceptibility values remain approximately constant for β⩽0.5 and asymptotically converge to χ=0 for β>0.5. In contrast, for small structures represented by relatively high spatial frequencies, such as CMBs, magnetic susceptibility values χ begin to deviate from the reference value β=0.01 already for β⩾0.2. With increasing β, the standard deviations (Figure 1B) and gray-level cooccurrence matrix contrast (Figure 1C) rapidly decrease, showing increasing suppression of streaking artifacts. Slightly increased gray-level co-occurrence matrix contrast was obtained for horizontal and vertical directions compared with diagonal directions for β⩽0.1 because streaking artifacts are oriented 54.74° and 125.26° compared with the magnetic field (Shmueli et al, 2009). The direction of the magnetic field of the analyzed data was oriented nearly completely along the horizontal axis. The relative accuracy for 33 CMBs, expressed as the ratio between susceptibility values obtained with β⩾0.01 and β=0.01, is plotted as a function of β (Figure 1D). For β>0.2, the median values rapidly decrease, indicating increasing deviation from the reference values. Restricting the median susceptibility value to deviate no more than 10% from the reference value (β=0.01) leads to an upper limit of β<0.5, which guarantees minimal streaking artifacts and small standard deviations of the susceptibility. Consequently, β=0.5 was chosen for the computation of susceptibility maps.
Figure 1.
Influence of the regularization parameter β on the computed susceptibility based on a data set of an 18-month-old arcAβ mouse brain. The means and s.d. of susceptibilities of different cerebral regions (blue, gray matter; red, white matter; green, cerebrospinal fluid; black, vein; cyan, cerebral microbleed 1; magenta, cerebral microbleed 2) are plotted as a function of the regularization parameter β in (A) and (B), respectively. The contrast feature of gray-level cooccurrence matrices (GLCM contrast) obtained for different in-plane directions (ν: green, ν=0° blue, ν=45° red, ν=90° and black, ν=135°) is plotted against the regularization parameter β in (C). The plot in (D) reveals the influence of the regularization parameter β on relative accuracy (median and s.d. of 33 cerebral microbleeds (CMBs)). The horizontal dashed blue line indicates 90% of relative accuracy, whereas the vertical dashed blue line refers to β=0.5.
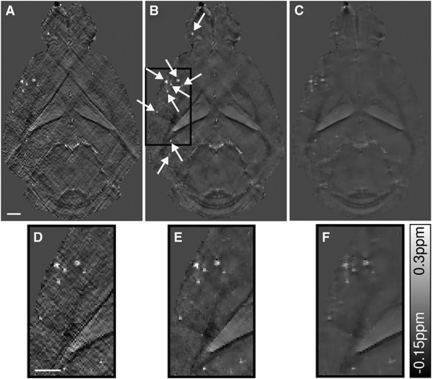
The effect of regularization is illustrated in the susceptibility maps of an arcAβ mouse computed with different values of β (Figure 2). Choosing β=0.05 results in a susceptibility map with clear delineation of anatomical structures and suspected CMBs, which however exhibits pronounced streaking artifacts (Figures 2A and 2D). In comparison, a value of β=2.3 yields decreased contrast between adjacent tissue structures in the susceptibility maps (Figures 2C and 2F). As a compromise, using a value of β=0.5 yields susceptibility maps with largely preserved fine structures and significantly reduced artifacts (Figures 2B and 2E).
Figure 2.
Quantitative susceptibility maps of an 18-month-old arcAβ mouse brain data set computed with β=0.05, β=0.5, and β=2.3 are presented in (A, D), (B, E), and (C, F), respectively. The bottom row (D–F) illustrates enlarged sections of the susceptibility maps, highlighted by the black box in (B). The scale bar indicates 1 mm.
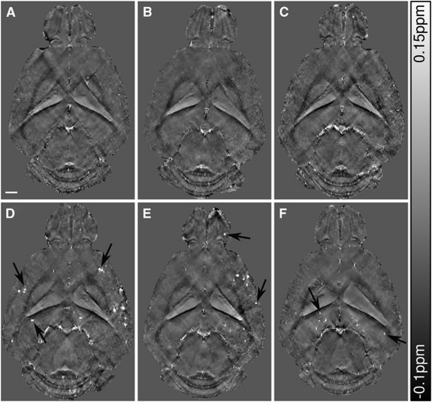
Horizontal cross-sections of susceptibility maps of the brains of 18-month-old wt controls and arcAβ mice show anatomical details with high contrast in areas associated with large susceptibility offsets (Figures 3A to 3C and 3D to 3F, respectively). Focal areas displaying high magnetic susceptibility values were abundant in the olfactory bulb, cortical, and subcortical areas of arcAβ mice (Figures 3D–3F). Small focal structures were rarely observed in the age-matched wt controls (Figures 3A to 3C).
Figure 3.
Horizontal quantitative susceptibility maps of three 18-month-old wild-type (wt) mice (A–C) and three age-matched arcAβ (D–F) at a depth ∼3 mm below the brain surface. Focal areas of high susceptibility, i.e., suspected cerebral microbleeds, are highly abundant in the arcAβ mice (arrows). The scale bar indicates 1 mm.
Volume-of-interest-based analysis was performed to assess magnetic susceptibility differences Δχ between brain tissue of transgenic and wt mice for different anatomical regions (Table 1). No significant differences in Δχ (relative to cerebrospinal fluid) between arcAβ and wt mice were found for cortical, hippocampal, striatal regions, and white matter (P=0.55, 0.17, 0.12, and 0.44, respectively). The mean Δχ of the CMBs was found to be 0.06±0.02 p.p.m. (n=7) relative to cerebrospinal fluid. This corresponds to a susceptibility difference of ∼40 p.p.b. relative to gray matter, which causes the high contrast between the CMB and the surrounding tissue. Provided that the mean susceptibility value of CMBs is because of iron in the form of hemosiderin, a breakdown product of the iron storage protein ferritin, the molar iron concentration in the CMBs was estimated to be 46.15±15.38 mg/L (0.83±0.28 mmol/L) (Schenk, 1992). In case iron is present predominantly in the oxidation state Fe3+, the estimated iron concentration would result in 18.93±6.31 mg/L (0.34±0.11 mmol/L) (Kahn, 1993).
Table 1. Susceptibility differences in p.p.m. (mean±s.d.) between tissue in different brain regions and cerebrospinal fluid (CSF).
| Brain region | arcAβ | Wild type (wt) | P value |
|---|---|---|---|
| Cortex | −31.6±7.8 | −33.9±7.3 | 0.55 |
| Hippocampus | −32.4±7.2 | −38.6±9.3 | 0.17 |
| Striatum | −19.5±6.0 | −25.2±7.4 | 0.12 |
| White matter | −55.8±9.9 | −59.0±7.3 | 0.44 |
The values are given in parts per billion.
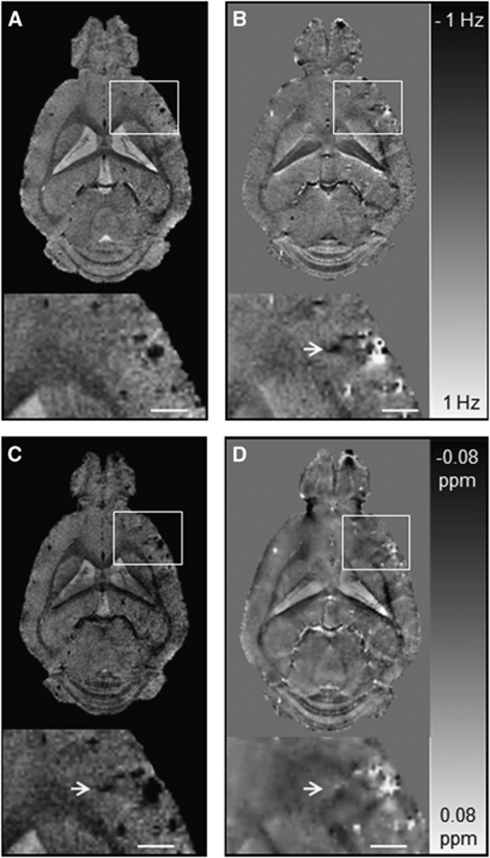
To explore the diagnostic value of QSM for CMB detection, we compared the susceptibility maps with corresponding GRE magnitude, phase, and SWI post-processed images (Figure 4). Circular regions of decreased signal intensity were readily detectable in the olfactory bulb, cortical, and subcortical areas on GRE magnitude images of arcAβ mice (Figure 4A). Additional lesions that were not seen on magnitude images were observed on phase, SWI, and QSM reconstructed images (Figures 4B to 4D, arrows). The number of CMBs identified in phase, SWI, and QSM post-processed images was higher than that identified in GRE magnitude images with 15±3, 15±3, 14±3 versus 12±3 lesions detected, respectively (Table 2). The CNR of the CMBs was higher on phase, SWI reconstructed images, and susceptibility maps compared with magnitude images with values of 9.0±2.5, 12.6±2.8, 10.6±1.1 versus 6.6±2.3, respectively. The highest CNR values were found for SWI reconstructed images.
Figure 4.
Comparison of gradient-recalled echo (GRE) magnitude, phase, susceptibility-weighted imaging (SWI), and quantitative susceptibility mapping (QSM) of the brain of an 18-month-old arcAβ mouse. Depicted are representative horizontal GRE magnitude (A), phase (B), SW images (C), and QSM images (D). The arrow points to a cerebral microbleed (CMB) that is discernible in the phase image, SWI, and QSM but not in the GRE magnitude image. The CMBs are more confined in QSM than in magnitude, phase, and SW images that show strong blooming effects. The scale bar indicates 1 mm.
Table 2. Number of CMBs identified in arcAβ mice using different post-processing techniques.
| Magnitude | Phase | SWI | QSM | |
|---|---|---|---|---|
| Mouse 1 | 12 | 15 | 15 | 15 |
| Mouse 2 | 15 | 17 | 17 | 16 |
| Mouse 3 | 9 | 11 | 12 | 11 |
| Mean±s.d. | 12±3 | 15±3 | 15±3 | 14±3 |
CMB, cerebral microbleed; QSM, quantitative susceptibility mapping; SWI, susceptibility-weighted imaging.
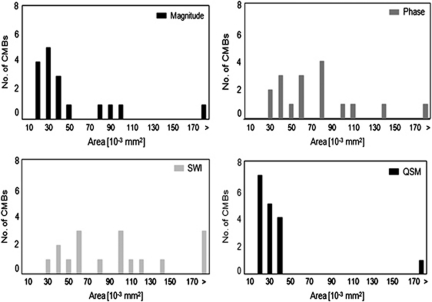
Furthermore, the effect of GRE magnitude, phase, SWI, and QSM post-processed images on lesion conspicuity was investigated (Figure 5). The mean areas of CMBs of phase and SWI post-processed images were 75±50 and 131±144 μm2 significantly higher than the mean area of 67±13 μm2 observed in magnitude images (n=17; P=0.008 and P<0.001, respectively). The extent of CMBs on susceptibility maps is smallest with a mean area of 36±6 μm2 (P<0.001 compared with SWI reconstructed images), and showed smaller variances of spatial extent.
Figure 5.
Comparison of the extent of cerebral microbleeds (CMBs) in different types of contrast. Shown are histograms for the area of CMBs measured on GRE magnitude, phase, susceptibility-weighted images (SWI), and quantitative susceptibility maps (QSM) (bin size 10 × 10−3 mm2).
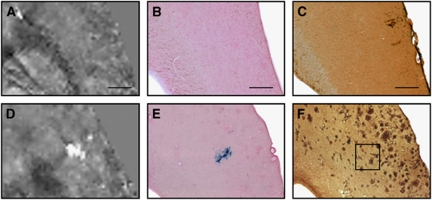
Magnetic susceptibility maps of 18-month-old wt controls and arcAβ mice were compared with corresponding histological sections (Figures 6A to 6F). Prussian blue staining identified high focal iron concentrations in arcAβ mice but not in wt controls (Figures 6B to 6E). Those Prussian blue-positive areas appeared morpohologically as distended blood vessels, confirming that focal areas characterized by increased magnetic susceptibility values are in fact CMBs. The extent of the CMB as seen on the Prussian blue stain corresponded well with the extent of the CMB on the susceptibility map (Figures 6D and 6E). Out of these 12 CMBs, 4 could be correlated with the respective magnitude, phase, SWI, and QSM post-processed images for comparison of CMB extent. The mean areas of these four CMBs were 109±15, 102±21, 150±23, and 83±13 μm2 when compared with 51±36 μm2 in the Prussian blue-stained sections.
Figure 6.
Comparison of quantitative susceptibility maps (QSMs) of an 18-month old wild-type (A–C) and an age-matched arcAβ mouse (D–F) with tissue histology. Depicted are magnified QSMs (A, D) of the cortex and the corresponding tissue sections after Prussian blue/Eosin staining (B, E) and anti-Aβ immunohistochemistry (C, F). A high focal iron concentration is detected in the arcAβ mouse that corresponds to the area of high susceptibility in the QSM, indicating the occurrence of cerebral microbleeds. The scale bars indicate 500 μm.
Anti-Aβ immunohistochemistry revealed a large abundance of Aβ-positive plaques in arcAβ mice, but not in wt controls (Figures 6C and 6F). However, focal areas of high susceptibility on QSM did not correspond to the pattern of the Aβ-positve plaques. Similarly, Prussian blue staining did not display positive stainings in areas of Aβ-positive plaques.
Discussion
In the present study, we applied QSM to detect CMBs in the arcAβ mouse model of cerebral amyloidosis, which mimics pathophysiological aspects of AD and CAA. The presence of CMBs was confirmed with histopathology. Furthermore, we showed the improved diagnostic value of QSM when compared with conventional GRE magnitude imaging, phase, and SWI reconstruction regarding detection sensitivity and morphometric characterization of the lesion.
We have shown that QSM with an isotropic spatial resolution of 60 μm3 can be reconstructed from GRE data of a mouse brain recorded at 9.4 T. One critical aspect of QSM is to properly condition the ill-posed inverse problem using a priori information of the susceptibility distribution. In this study, edge information from magnitude images was incorporated into the QSM algorithm to constrain the iterative solution of the inverse problem (de Rochefort et al, 2010). The regularization parameter β that controls this incorporation has been carefully adjusted. Numerical simulations (de Rochefort et al, 2010) and phantom experiments (Wharton and Bowtell, 2010) revealed an optimal value for β of 100 and 1, respectively. For mouse brain data, we found a value of β=0.5 to be an optimal tradeoff between minimization of streaking artifacts and preserving image fine structure and contrast, sufficient to unambiguously identify both anatomical structures and focal pathologies. The differences to the amount of magnitude constraining reported in previous studies may be attributed to the different complexity of investigated objects, different amount of T2* weighting in magnitude data, different normalization procedure of W in equation (1), as well as to variations in additional regularization parameters (e.g., constant phase offsets) in the QSM algorithm.
Quantitative susceptibility mapping was used to assess magnetic susceptibility in the arcAβ mouse. We did not observe significant variations in Δχ in different anatomical regions between arcAβ mice and wt controls (see Table 1). Studies using post-mortem analysis have reported elevated iron concentrations in the hippocampus, cortical lobes, and basal regions in patients with AD compared with age-matched controls (Connor et al, 1992). Increased iron accumulation was also found in the brains of PSAPP mice (Leskovjan et al, 2011).
Although no regional differences in susceptibility were detected, focal areas of high susceptibility values were abundant in arcAβ mice. In contrast, few focal areas of high susceptibility values were rarely observed in horizontal sections of wt controls. Because of their confined shape and location, these structures are most likely cross-sectioned large blood vessels. The extent and morphology of the lesions in the arcAβ mice were indicative of CMBs that contain iron in the form of hemosiderin (Andrews et al, 1987). However, amyloid plaques in patients and transgenic mouse models of AD have been reported to contain iron in the form of hemosiderin and ferritin, which may give rise to altered susceptibility values (Grundke-Iqbal et al, 1990; Leskovjan et al, 2009). In brain sections of 18-month-old arcAβ mice, plaques did not stain positive with Prussian blue. However, Prussian blue staining revealed structures that appeared morphologically as CMBs, confirming that focal lesions characterized by high susceptibility values in QSM were in fact CMBs. Our results indicate that parenchymal plaque composition in the arcAβ mouse differs from other transgenic mouse strains displaying cerebral amyloidosis. Thus, this mouse model might be relevant for studying the pathology of CMBs and for investigating the effect of putative therapeutics on their potential to cause CMBs in AD and CAA.
Cerebral microbleeds are frequently observed in patients with CAA and AD, but are also prevalent in 38% of people aged over 80 years not displaying any signs of dementia (Pettersen et al, 2008). We found CMBs in 18-month-old arcAβ mice but not in age-matched controls, which seem to be caused by the Aβ pathology or the genetic trait rather than aging. Longitudinal studies are required for assessing the first occurrence of CMBs in patients and experimental models of AD and CAA and to observe changes in the load and spatial distribution of CMBs over the course of the disease.
In this study we evaluated the diagnostic utility of QSM for detecting CMBs. The CMBs are recognized on T2*-weighted GRE magnitude images (Greenberg et al, 2009; Cordonnier and van der Flier, 2011). In 25% of patients with CAA, no CMBs could be detected using magnitude images (Greenberg et al, 2009). Application of SWI led to the detection of 33% more CMBs than found in GRE magnitude images (Nandigam et al, 2009). We detected three additional CMBs in phase and SWI reconstructed images of arcAβ mice when compared with magnitude images. Only two more CMBs were identified on susceptibility maps, which may be attributed to the slight smoothing of the maps by applying regularization. The SWI reconstructed images and susceptibility maps had a 1.9 and 1.6 times higher CNR than structures in the corresponding magnitude image. Therefore, phase, SWI, and QSM postprocessing of GRE data all increase the detection sensitivity and improve the visualization of CMBs compared with GRE magnitude images.
In addition to the image quality, QSM postprocessing might also affect lesion conspicuity. Magnitude, phase, and SWI consistently overestimate the size of CMBs because of the blooming effect caused by nonlocal field perturbations induced by the CMB. In our study, the average size of the CMBs on SWI reconstructed images was approximately twice the value observed in magnitude images. QSM overcomes this nonlocality. Mean areas of CMBs in QSM images were found to be 53%, 48%, and 27% of the respective values in magnitude, phase, and SWI post-processed images. In addition, the CMBs on susceptibility maps show significantly smaller variations in spatial extent. The extent of CMBs on the magnitude, phase, SWI, and QSM reconstructed images were 1.9±0.4, 2.0±0.6, 2.9±0.6, and 1.6±0.4 times the value derived from the histological analysis. However, validation of MRI data by direct comparison with histological stained brain slices suffers from methodological constraints. Fixation of brain tissue causes shrinkage of total brain volume that makes accurate identification of small CMBs difficult and leads to an underestimation of the actual size of the CMB. Assuming typical values for fixation-induced shrinkage between 10% and 35%, we would estimate the mean CMB volume to be in the range of 56 to 69 μm2 (Boonstra et al, 1983; Quester and Schroeder, 1997), which corresponds well to the values of 36±6 μm from QSM. Taken together, QSM appears superior in demarcation of CMBs than magnitude, phase, and SWI, and compares more favorably with the extent estimated with histologic analysis.
Because CMBs present a source of pathological iron in the brain, quantitative assessment of iron content within CMBs with QSM might be diagnostically relevant. Iron in CMBs can be present as hemoglobin, hemosiderin, ferritin, and potentially free iron ions, all characterized by different molar magnetic susceptibilities (Schenk, 1992; Schweser et al, 2011). We estimated different concentrations of iron in CMBs, depending on whether we assumed iron in CMBs to be present dominantly as ferritin or as ferric Fe3+. However, the actual composition of the constituents of the CMBs depends on the age of the CMB and is a priori not known. Furthermore, other contributions such as variations in water content and/or presence of paramagnetic ions other than iron or of diamagnetic ions will in turn influence the relative magnetic susceptibility (Schweser et al, 2011). Although QSM can be used to accurately quantify iron concentration in cases where the form of iron is known, an accurate quantification of iron concentration in CMBs based on estimation of susceptibility may not be achievable without additional knowledge or assumptions of the constituents.
Cerebral microbleeds have been associated with several neurological and neurodegenerative disorders and are indicative of an underlying vascular pathology. Techniques that incorporate phase information from GRE data sets have shown improved contrast and increased diagnostic sensitivity for CMBs. Although it may still remain difficult to extract iron concentration noninvasively, QSM corrects at least for nonlocal effects observed in GRE magnitude, phase, and SW images and is independent of the actual experimental setup, i.e., the magnetic field strength, acquisition parameters, and orientation of the tissue to the main magnetic field. We envision that QSM may become an important diagnostic tool for studying CMBs in experimental models and in the clinic.
Acknowledgments
The authors thank Anita Szodorai and Daniel Schuppli (Division of Psychiatry Research, University of Zurich) for providing the arcAβ mice.
The authors declare no conflict of interest.
Footnotes
This work was funded by the Swiss National Science Foundation (Grant 3100A0-112835 and 310030-126029 to MR and 310030-132629 to IK), the German Research Foundation (RE 1123/9-2), and the Carl Zeiss Foundation (dissertation fellowship for FS).
References
- Abdul-Rahman HS, Gdeisat MA, Burton DR, Lalor MJ, Lilley F, Moore CJ. Fast and robust three-dimensional best path phase unwrapping algorithm. Appl Opt. 2007;46:6623–6635. doi: 10.1364/ao.46.006623. [DOI] [PubMed] [Google Scholar]
- Andrews SC, Treffry A, Harrison PM. Siderosomal ferritin. The missing link between ferritin and haemosiderin. Biochem J. 1987;245:439–446. doi: 10.1042/bj2450439. [DOI] [PMC free article] [PubMed] [Google Scholar]
- Ayaz M, Biokov AS, Haacke EM, Kido DK, Kirsch WM. Imaging cerebral microbleeds using susceptibility weighted imaging: one step toward detecting vascular dementia. J Magn Reson Imaging. 2010;31:142–148. doi: 10.1002/jmri.22001. [DOI] [PMC free article] [PubMed] [Google Scholar]
- Barth M, Nöbauer-Huhmann IM, Reichenbach JR, Mlynarik V, Schöggl A, Matula C, Trattnig S. High-resolution three-dimensional contrast-enhanced blood oxygenation level-dependent magnetic resonance venography of brain tumors at 3 Tesla: first clinical experience and comparison with 1.5 Tesla. Invest Radiol. 2003;38:409–414. doi: 10.1097/01.RLI.0000069790.89435.e7. [DOI] [PubMed] [Google Scholar]
- Boonstra H, Oosterhuis JW, Oosterhuis AM, Fleuren GJ. Cervical tissue shrinkage by formaldehyde fixation, paraffin wax embedding, section cutting and mounting. Virchows Arch A Pathol Anat Histopathol. 1983;402:195–201. doi: 10.1007/BF00695061. [DOI] [PubMed] [Google Scholar]
- Connor JR, Snyder BS, Beard JL, Fine RE, Mufson EJ. Regional distribution of iron and iron-regulatory proteins in the brain in aging and Alzheimer's disease. J Neurosci Res. 1992;31:327–335. doi: 10.1002/jnr.490310214. [DOI] [PubMed] [Google Scholar]
- Cordonnier C, van der Flier WM. Brain microbleeds and Alzheimer's disease: innocent observation or key player. Brain. 2011;134 (Part 2:335–344. doi: 10.1093/brain/awq321. [DOI] [PubMed] [Google Scholar]
- Deistung A, Rauscher A, Sedlacik J, Stadler J, Witoszynskyj S, Reichenbach JR. Susceptibility weighted imaging at ultra high magnetic field strengths: Theoretical considerations and experimental results. Magn Reson Med. 2008;60:1155–1168. doi: 10.1002/mrm.21754. [DOI] [PubMed] [Google Scholar]
- De Rochefort L, Liu T, Kressler B, Liu J, Spincemaille P, Lebon V, Wu J, Wang Y. Quantitative susceptibility map reconstruction from MR phase data using Bayesian regularization: validation and application to brain imaging. Magn Reson Med. 2010;63:194–206. doi: 10.1002/mrm.22187. [DOI] [PubMed] [Google Scholar]
- Duyn JH, van Gelderen P, Li TQ, de Zwart JA, Koretsky AP, Fukunaga M. High-field MRI of brain cortical substructure based on signal phase. Proc Natl Acad Sci USA. 2007;104:11796–11801. doi: 10.1073/pnas.0610821104. [DOI] [PMC free article] [PubMed] [Google Scholar]
- Essig M, Reichenbach JR, Schad LR, Schoenberg SO, Debus J, Kaiser WA. High-resolution MR venography of cerebral arteriovenous malformations. Magn Res Imaging. 1999;17:1417–1425. doi: 10.1016/s0730-725x(99)00084-3. [DOI] [PubMed] [Google Scholar]
- Greenberg SM, Vernooij MW, Cordonnier C, Viswanathan A, Al-Shahi Salman R, Warach S, Launer LJ, van Buchem MA, Breteler MM, Microbleed Study Group Cerebral microbleeds: a guide to detection and interpretation. Lancet Neurol. 2009;8:165–174. doi: 10.1016/S1474-4422(09)70013-4. [DOI] [PMC free article] [PubMed] [Google Scholar]
- Grundke-Iqbal I, Fleming J, Tung YC, Lassmann H, Iqbal K, Joshi JG. Ferrritin is a component of the neuritic (senile) plaque in Alzheimer's dementia. Acta Neuropathol. 1990;81:105–110. doi: 10.1007/BF00334497. [DOI] [PubMed] [Google Scholar]
- Haralick RM, Shanmugam K, Dinstein I. Textural features for image classification. IEEE Trans Syst Man Cybernet. 1973;3:610–621. [Google Scholar]
- Jellinger KA, Lauda F, Attems J. Sporadic cerebral amyloid angiopathy is not a frequent cause of spontaneous brain hemorrhage. Eur J Neurol. 2007;14:923–928. doi: 10.1111/j.1468-1331.2007.01880.x. [DOI] [PubMed] [Google Scholar]
- Kahn O.(ed) (1993Molecular magnetism Weinheim: Wiley-VCH [Google Scholar]
- Knobloch M, Konietzko U, Krebs DC, Nitsch RM. Intracellular Abeta and cognitive deficits precede beta-amyloid deposition in transgenic arcAbeta mice. Neurobiol Aging. 2007;28:1297–1306. doi: 10.1016/j.neurobiolaging.2006.06.019. [DOI] [PubMed] [Google Scholar]
- Leskovjan AC, Lanzirotti A, Miller LM. Amyloid plaques in PSAPP mice bind less metal than plaques in human Alzheimer's disease. Neuroimage. 2009;47:1215–1220. doi: 10.1016/j.neuroimage.2009.05.063. [DOI] [PMC free article] [PubMed] [Google Scholar]
- Leskovjan A, Kretlow A, Lanzirotti A, Barrea R, Vogt S, Miller LM. Increased brain iron coincides with early plaque formation in a mouse model of Alzheimer's disease. Neuroimage. 2011;55:32–38. doi: 10.1016/j.neuroimage.2010.11.073. [DOI] [PMC free article] [PubMed] [Google Scholar]
- Liu T, Khalidov I, de Rochefort L, Spincemaille P, Liu J, Tsiouris AJ, Wang Y.2011A novel background field removal method for MRI using projection onto dipole fields (PDF) NMR Biomed(in press) [DOI] [PMC free article] [PubMed]
- Marques JP, Maddage R, Mlynarik V, Gruetter R. On the origin of the MR image phase contrast: an in vivo MR microscopy study of the rat brain at 14.1 T. Neuroimage. 2009;46:345–352. doi: 10.1016/j.neuroimage.2009.02.023. [DOI] [PubMed] [Google Scholar]
- Nandigam RNK, Viswanathan A, Delgado P, Skehan ME, Smith EE, Rosand J, Greenberg SM, Dickerson BC. MR imaging detection of cerebral microbleeds: effect of susceptibility-weighted imaging, section thickness, and field strength. AJNR Am J Neuroradiol. 2009;30:338–343. doi: 10.3174/ajnr.A1355. [DOI] [PMC free article] [PubMed] [Google Scholar]
- Pettersen JA, Sathiyamoorthy G, Gao FQ, Szilagyai G, Nadkarni NK, St George-Hyslop P, Rogaeva E, Black SE. Microbleed topography, leukoaraiosis, and cognition in probable Alzheimer disease from the Sunnybrok dementia study. Arch Neurol. 2008;65:790–795. doi: 10.1001/archneur.65.6.790. [DOI] [PubMed] [Google Scholar]
- Quester R, Schroeder R. The shrinkage of the human brain stem during formalin fixation and embedding in paraffin. J Neurosci Methods. 1997;75:81–89. doi: 10.1016/s0165-0270(97)00050-2. [DOI] [PubMed] [Google Scholar]
- Rauscher A, Sedlacik J, Barth M, Mentzel HJ, Reichenbach JR. Magnetic susceptibility-weighted MRI phase imaging of the human brain. AJNR Am J Neuroradiol. 2005;26:736–742. [PMC free article] [PubMed] [Google Scholar]
- Reichenbach JR, Venkatesan R, Schillinger DJ, Kido DK, Haacke EM. Small vessels in the human brain: MR venography with deoxyhemoglobin as an intrinsic contrast agent. Radiology. 1997;204:272–277. doi: 10.1148/radiology.204.1.9205259. [DOI] [PubMed] [Google Scholar]
- Reichenbach JR, Barth M, Haacke ME, Klarhofer M, Kaiser WA, Moser E. High-resolution MR venography at 3.0 Tesla. J Comput Assist Tomogr. 2000;24:949–957. doi: 10.1097/00004728-200011000-00023. [DOI] [PubMed] [Google Scholar]
- Reichenbach JR, Haacke EM. High resolution BOLD venographic imaging: a window into brain function. NMR Biomed. 2001;14:453–467. doi: 10.1002/nbm.722. [DOI] [PubMed] [Google Scholar]
- Rorden C, Brett M. Sterotaxic display of brain lesions. Behav Neurol. 2000;12:191–200. doi: 10.1155/2000/421719. [DOI] [PubMed] [Google Scholar]
- Schad LR. Improved target volume characterization in stereotactic treatment planning of brain lesions by using high-resolution BOLD MR-venography. NMR Biomed. 2001;14:478–483. doi: 10.1002/nbm.714. [DOI] [PubMed] [Google Scholar]
- Schäfer A, Wharton S, Gowland P, Bowtell R. Using magnetic field simulation to study susceptibility-related phase contrast in gradient echo MRI. Neuroimage. 2009;48:126–137. doi: 10.1016/j.neuroimage.2009.05.093. [DOI] [PubMed] [Google Scholar]
- Schenk JF. Health and physiological effects of human exposure to whole-body four-tesla magnetic fields during MRI. Ann NY Acad Sci. 1992;649:285–301. doi: 10.1111/j.1749-6632.1992.tb49617.x. [DOI] [PubMed] [Google Scholar]
- Schenk JF. The role of magnetic susceptibility in magnetic resonance imaging: MRI magnetic compatibility in magnetic resonance imaging: MRI magnetic compatibility of the first and second kinds. Med Phys. 1996;23:815–850. doi: 10.1118/1.597854. [DOI] [PubMed] [Google Scholar]
- Schrag M, McAuley G, Pomakian J, Jiffry A, Tung S, Mueller C, Vinters HV, Haacke EM, Holshouser B, Kido D, Kirsch WM. Correlation of hypointensities in susceptibility-weighted images to tissue histology in dementia patients with cerebral amyloid angiopathy: a postmortem MRI study. Acta Neuropathol. 2010;119:291–302. doi: 10.1007/s00401-009-0615-z. [DOI] [PMC free article] [PubMed] [Google Scholar]
- Schweser F, Deistung A, Lehr BW, Reichenbach JR. Differentiation between diamagnetic and paramagnetic cerebral lesions based on magnetic susceptibility mapping. Med Phys. 2010;37:5165–5178. doi: 10.1118/1.3481505. [DOI] [PubMed] [Google Scholar]
- Schweser F, Deistung A, Lehr BW, Reichenbach JR. Quantitative imaging of intrinsic magnetic tissue properties using MRI signal phase: an approach to in vivo brain iron metabolism. Neuroimage. 2011;54:2789–2807. doi: 10.1016/j.neuroimage.2010.10.070. [DOI] [PubMed] [Google Scholar]
- Shmueli K, de Zwart JA, van Gelderen P, Li TQ, Dodd SJ, Duyn JH. Magnetic susceptibility mapping of brain tissue in vivo using MRI phase data. Magn Reson Med. 2009;62:1510–1522. doi: 10.1002/mrm.22135. [DOI] [PMC free article] [PubMed] [Google Scholar]
- Wharton S, Bowtell R. Whole-brain susceptibility mapping at high field: a comparison of multiple- and single-orientation methods. Neuroimage. 2010;53:515–525. doi: 10.1016/j.neuroimage.2010.06.070. [DOI] [PubMed] [Google Scholar]
- Zhang Y, Brady M, Smith S. Segmentation of brain MR images through a hidden Markov random field model and the expectation maximization algorithm. IEEE Trans Med Imaging. 2001;20:45–57. doi: 10.1109/42.906424. [DOI] [PubMed] [Google Scholar]


