Abstract
While infantile spasms is the most common catastrophic epilepsy of infancy and early-childhood, very little is known about the basic mechanisms responsible for this devastating disorder. In experiments reported here, spasms were induced in rats by the chronic infusion of TTX into the neocortex beginning on postnatal day 10–12. Studies of focal epilepsy suggest that high frequency EEG oscillations (HFOs) occur interictally at sites that are most likely responsible for seizure generation. Thus, our goal was to determine if HFOs occurred and where they occurred in cortex in the TTX model. We also undertook multiunit recordings to begin to analyze the basic mechanisms responsible for HFOs. Our results show that HFOs occur most frequently during hypsarrhythmia and NREM sleep and are most prominent contralateral to the TTX infusion site in the homotopic cortex and anterior to this region in frontal cortex. While HFOs were largest and most frequent in these contralateral regions, they were also commonly recorded synchronously across multiple and widely-spaced recordings sites. The amplitude and spatial distribution of interictal HFOs were found to be very similar to the high frequency bursts seen at seizure onset. However, the latter differed from the interictal events in that the high frequency activity was more intense at seizure onset. Microwire recordings showed that neuronal unit firing increased abruptly with the generation of HFOs. A similar increase in neuronal firing occurred at the onset of the ictal events. Taken together, results suggest that neocortical networks are abnormally excitable, particularly contralateral to TTX infusion, and that these abnormalities are not restricted to small areas of cortex. Multiunit firing coincident with HFOs are fully consistent with a neocortical hyperexcitability hypothesis particularly since they both occur at seizure onset.
Keywords: Epilepsy, Seizures, Infantile Spasms, TTX, High Frequency Oscillations, EEG
Introduction
Infantile spasms or West Syndrome is referred to as a catastrophic epilepsy since afflicted children commonly develop life-long intellectual disabilities and over time develop other forms of epilepsy that are most often unresponsive to anticonvulsant therapies. Until recently, progress in understanding the cellular and molecular mechanisms responsible for this disorder has been hampered by the lack of relevant animal models. Our laboratory has developed a model of this syndrome that is produced by a prolonged local infusion of the sodium channel antagonist, TTX, into the cortex beginning on postnatal days 10 –12 (Lee et al., 2008). Over the next 1–2 weeks the rat pups begin to display brief (1–2 sec) behavioral spasms that consist of flexions or extensions of the trunk and/or forelimbs. When traditional EEG recording techniques are used, the ictal EEG events that accompany these behaviors are very similar to those recorded from human infants.
Over the past decade, there has been a growing appreciation that additional information can be observed in EEG and ECoG recordings when higher sampling rates are used beyond those possible with traditional recording devices. Numerous reports have reported high frequency EEG activity in children with infantile spasms but most of these reports were limited to frequency ranges below 100 Hz (Panzica et al., 1999; Panzica et al., 2007; Inoue et al., 2008; Nariai et al., 2011a; Nariai et al., 2011b). In contrast, numerous papers have described high frequency oscillations (HFOs) in the 250–600 Hz range in patients with temporal lobe or neocortical focal epilepsy (Bragin et al., 2002b; Jirsch et al., 2006; Urrestarazu et al., 2007; Worrell et al., 2008; Schevon et al., 2009; Crepon et al., 2010). Ripples, HFOs in the 80–200 Hz range are also recorded in epileptic patients and animal models. However, since they are observed in normal humans and animals (Ylinen et al., 1995; Engel, Jr. et al., 2009), ripples are thought to be a normal rhythm of neural networks (Llinas, 1988; Lisman and Idiart, 1995; Bragin et al., 1999). In epilepsy patients and animals models, HFOs in the 200 – 600 Hz range have been reported by numerous groups and have been termed fast ripples (Bragin et al., 2002a; Bragin et al., 2002b; Urrestarazu et al., 2007; Jiruska et al., 2010; Bragin et al., 2011). These HFOs are not only thought to be pathologic events but since they can be highly localized they have been suggested to mark sites of seizure generation (Bragin et al., 2002a; Bragin et al., 2002b; Worrell et al., 2008; Schevon et al., 2009; Crepon et al., 2010). Consistent with this notion are observations that very similar HFOs occur at the onset of electrographic seizures (Bragin et al., 2005; Jacobs et al. 2008).
In the TTX model of infantile spasms, high frequency activity up to 700 Hz has been reported at the onset of ictal events (Frost, Jr. et al., 2011). Thereafter, the intensity of HFOs decreases but they continue throughout the seizures. Moreover it was found that the most intense high frequency activity was not recorded near the TTX infusion site but in the contralateral neocortex. In addition, HFO activity at the onset of ictal events most often occurred earliest at contralateral sites – suggesting that these regions might participate in initiating spasm generation.
In experiments reported here, we have extended our analysis of HFOs in the TTX model by analyzing high frequency activity during interictal periods. In patients as well as in the TTX model, the interictal period is often marked by the presence of a unique and highly unusual EEG pattern called hypsarrhythmia (Gibbs et al., 1954; Hrachovy et al., 1984). We characterized variations in the frequency of occurrence and the intensity of high frequency activity during waking and sleep states including hypsarrhythmia and determined where in the neocortex these events are most prominent. Using microwire recording techniques, we also examined multiple unit neuronal activity during interictal periods and potential coincidence with HFOs. Our results suggest that neocortical networks, contralateral to TTX infusion, are hyperexcitable and likely contribute to the generation of spasms in this animal model.
METHODS
TTX infusion
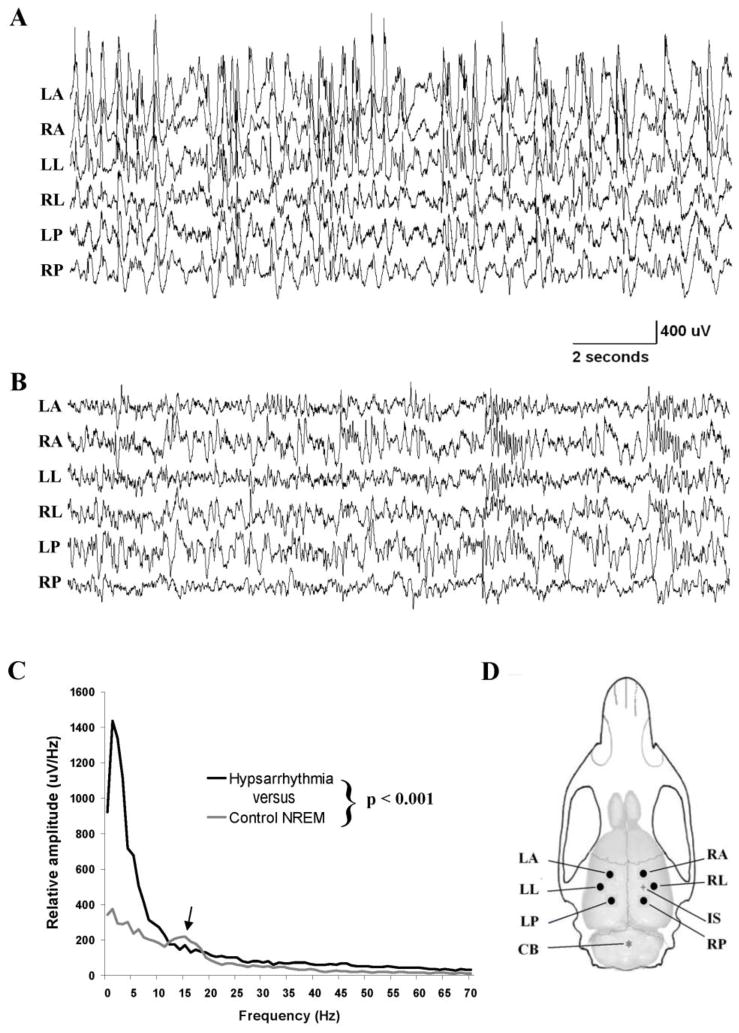
The methods used to chronically infuse TTX into infant rats have been described (Galvan et al., 2000; Lee et al., 2008; Frost et al., 2011). Briefly, 11–12 day old rats were anesthetized with ketamine/xylazine and an osmotic infusion minipump containing TTX (10 μM - dissolved in an artificial cerebrospinal fluid vehicle) was implanted subcutaneously along the animal’s back. For control animals, the pump was filled with only the vehicle. The pump was connected to a 28 gauge stainless steel cannula that was stereotaxically implanted (AP: 2.0: ML: 2.2; DV: 0.8 mm) in the right central cortex (IS in Figure 1D) and anchored with dental acrylic. Infusion from the pump continued for 28 days. All procedures used in this study were approved by the Baylor College of Medicine animal welfare committee and were in keeping with guidelines established by the NIH.
Figure 1.
Comparison of interictal EEG recordings from a TTX-infused and a control rat. (A) Slow time base recording of hypsarrhythmia in a TTX infused rat with spasms. (B) Representative recording of NREM sleep from an ACSF-infused control rat. Notice the high amplitude and chaotic appearing recordings of hypsarrhythmia. (C) Comparison of EEG amplitude spectrum during hypsarrhythmia and NREM sleep from a control rat. Both spectrums were computed by averaging 4 randomly selected epochs of EEG recordings from 2 animals. Arrow denotes the occurrence of sleep spindles in the NREM recordings. The spectrums from the epileptic and control animals differed from each other statistically (two-way ANOVA: p ≤ 0.001) (D) Illustration of rat skull and brain showing the location of recording electrodes (dots), cerebellar reference electrode (asterisk) and TTX infusion site (+). Recording electrodes were positioned 3.0mm from the infusion site as well as homotopically in contralateral cortex. (LA, left anterior; RA, right anterior; LL, left lateral; RL, right lateral; LP, left posterior; RP, right posterior; IS, infusion site; CB cerebellar reference electrode.
EEG recordings
Recording electrodes were implanted 0.8 mm below the cortical surface at 6 sites in neocortex (Figure 1D), most commonly two weeks after pump implantation. Reference electrodes were placed in the cerebellum and electrodes in neck musculature served as isolated system grounds. The recording sites were chosen with relation to the TTX infusion site. Three electrodes were placed ipsilateral to the infusion site 3 mm anterior, posterior and lateral to the cannula implantation site. These electrodes were denoted as right anterior (RA), right posterior (RP) and right lateral (RL). Three additional electrodes were placed homotopically in the contralateral cortex and are referred to as left anterior (LA), left posterior (LP) and left lateral (LL). Cortical electrodes were 0.005″ (127 μm - bare diameter) Teflon-coated silver wires exposed for 0.3 – 0.5 mm at the tip. Monitoring sessions of 4–8 hours per day were conducted for at least 5 – 6 days usually between postnatal days 31– 44. Recordings were made with a Nicolet/Viasys instrument using a digital sampling rate of 2048 Hz. An anti-aliasing filter provided an attenuation of −6 dB at 500 Hz and −16 dB at 900 Hz prior to digitization. While the antialiasing filter removed most high frequency components above 500 Hz, low-pass digital filters used post-sampling (see below) were set to 900 Hz in order to maximize the ability to detect any high frequency components that might be present. All recordings were done in a Faraday cage.
Analysis of EEG Recordings
The results reported here were based on analysis of EEGs recorded from 5 TTX-treated rats and 4 ACSF-infused controls. All of the experimental rats and controls were from the 31– 44 day age range.
High frequency EEG activity was characterized using digital bandpass filtering and compressed spectral arrays. The filters were designed to provide an attenuation of 31 db/octave beyond the cut-off point. Compressed spectral arrays (Bickford et al., 1972) were derived from EEG segments of 1 to 8 sec. duration, using a 100 msec sliding analysis window which was advanced through the digitized sample in increments of 10 data points (equivalent to 5 msec). The 100 msec data samples were multiplied by a cosine-tapered (Tukey) window with a 20% taper-to-constant ratio prior to computation of the fast fourier transform (FFT). The compressed FFT arrays were displayed as contour plots with frequency on the vertical axis and time on the horizontal axis. Spectral amplitude (square root of power spectral density) was indicated by a color-code. This procedure permitted a frequency range of 10 to 900 Hz with a frequency resolution of 10 Hz, although components above 500 Hz were markedly attenuated by the antialiasing filter. Because of the sliding analysis window, the ability to resolve distinct spectral components of the same frequency is limited to those separated by more than 100 msec. In addition, very brief, discrete, frequency components, such as those associated with a spike, are stretched temporally as the 100 msec sliding analysis window passes over, and this may result in columnar-appearing events of approximately 100 msec duration in the spectral plot. Analysis software was developed using the Matlab programming language. The spectral displays used here are similar in concept to those used in published human studies (Kobayashi et al., 2004; Panzica et al., 2007)
The amount of interictal high frequency activity present in specific behavioral states was also quantified by spectral analysis of selected 8-second samples. For each 8-second sample, the summated amplitude (square root of total power) of HF activity in the 50 – 900 Hz range was determined for each of the 6 recording channels. Multiple samples (2 to 7) were averaged for each state (Awake, NREM sleep, REM sleep, and hypsarrhythmia when present).
High frequency oscillations (HFOs) were identified and characterized during selected interictal periods by a combination of visual and quantitative criteria. Initially, transient oscillatory events were selected if they were clearly distinguishable by amplitude and/or frequency from the ongoing EEG activity as viewed with a digital filter bandpass of 80–900 Hz. Selected events had to have an abrupt onset, and not be simply waxing and waning of the background activity. In addition, the event had to consist of at least 4 consecutive cycles of activity and have a total duration of less than 1 second. All events meeting these basic visual criteria were subsequently subjected to spectral analysis using the compressed spectral array method described earlier. The compressed array was processed further by summating the values between 80–900 Hz, 200–900 Hz, and 250–900 Hz in each of the overlapping 100 msec spectra of the array. The summated values were then displayed as a time plot, allowing the observer to determine if the event in question was associated with an increase of activity in the specified frequency range with respect to the immediately preceding baseline (e.g. >80 Hz and <200 Hz or >250 Hz). Any event not associated with a distinct increase of summated amplitude in the 80–900 Hz range was rejected. HFOs meeting these criteria and whose frequency components did not exceed 200 Hz were sometimes referred to as ripples.
Multiunit Recordings
Multiunit neuronal activity was recorded simultaneously with EEG activity using Neuralynx Cheetah Data Acquisition Hardware and Software. Eight tungsten microwire recording electrodes (0.002 inch – 50 μm in diameter: California Fine Wire) were implanted 100μm below the cortical surface at sites similar to those for EEG recordings (see above and Figure 1) with the exception that electrode placement in the anterior/posterior direction was 1.5 instead of 3 mm intervals. EEG recordings were sampled at 2 KHz and band pass filtered prior to digitization at 1 – 450Hz. Recordings of unit activity were sampled at 30 KHz and filtered prior to digitization at 600 – 9000 Hz. Two Teflon-coated stainless steel wires (127 μm - bare diameter) exposed for 0.3 – 0.5 mm at the tip were used as an animal ground and reference recording electrode. Video was recorded throughout electrophysiological recordings, which typically lasted 4 –10 hours per day for 3–5 days. Multiunit activity was recorded from 3 TTX infused and 2 control rats.
Statistics
Data are summarized as means ± SEM. One-way or two-way ANOVAs were performed to determine statistical significance. A post-hoc Holm-Sidak test was used to correct for multiple comparisons. Sigma Stat was used to perform all statistical tests.
RESULTS
In the TTX model, the interictal EEG is quite abnormal and as in human infants is often marked by the presence of hypsarrhythmia, an EEG pattern unique to West Syndrome. Figure 1 compares recordings from a TTX-infused and an ACSF-infused control rat during NREM sleep. The “chaotic” appearance of the EEG shown in panel A is typical of hypsarrhythmia in this animal model and is marked by unusually large slow waves which can occur asynchronously across the cortex and can exceed 1mV in amplitude. Large and frequent multifocal interictal spikes are intermixed with the slower events. Recordings in Figure 1B from a control animal show a normal EEG pattern during NREM sleep. Slow waves again dominate these recordings but they are smaller in amplitude in comparison to the TTX infused rat. To quantitatively evaluate differences between EEG activity during hypsarrhythmia and NREM sleep in control rats, we compared the intensity of activity in the two states at frequencies between 0 and 70 Hz. Results from 8 randomly selected 8 sec epochs in each state – four each from 2 TTX and 2 saline-infused rats - formed the basis for this analysis. Results in Figure 1C show that low frequency activity was far more intense during hypsarrhythmia (two-way ANOVA: p ≤ 0.001). The spectral peak at 14–15 Hz in NREM samples (see arrow) was due to the occurrence of sleep spindles which were absent during hypsarrhythmia.
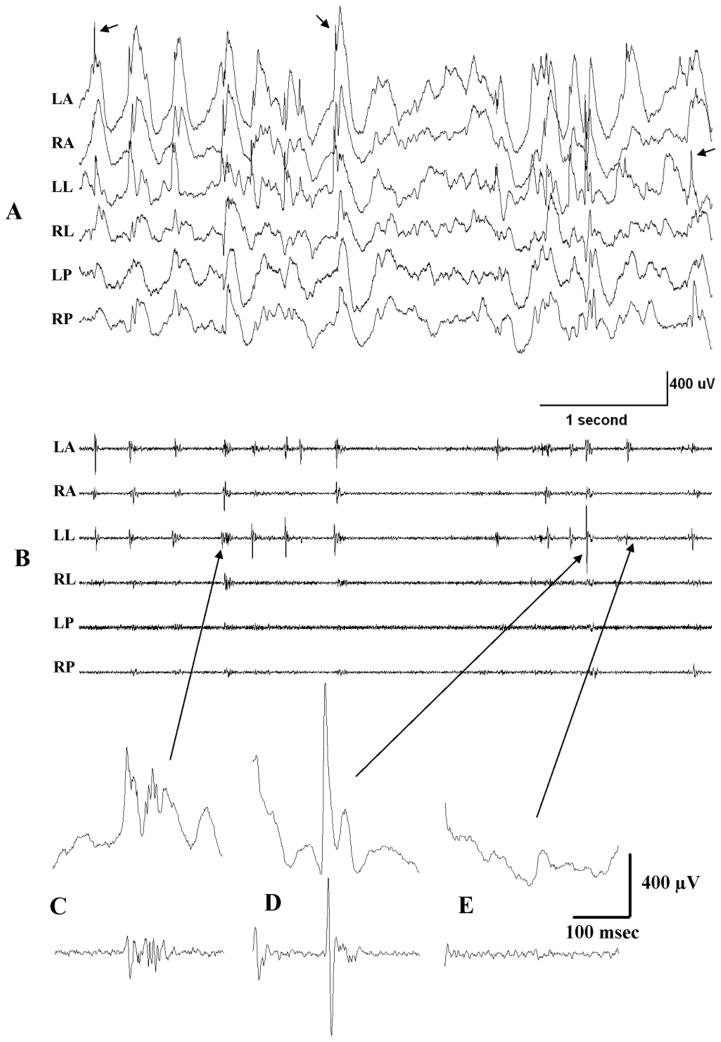
Figure 2 shows a portion of the hypsarrhythmic pattern of Figure 1 displayed at a faster time base to illustrate discrete neurophysiological events. Panel A shows the raw EEG traces (0.5–500 Hz). Very large slow waves are present in all channels. Frequent multifocal spikes (e.g. see arrows) also characterize this EEG state in the TTX model as they do in humans. Figure 2B shows the high frequency activity embedded in the recordings in panel A and revealed here by an 80–500 Hz band pass filter. In this animal, high frequency activity was bilateral and most prominent adjacent and anterior to the TTX infusion site - on recording electrodes LA, RA, LL and RL. Recordings from more posteriorally placed electrodes had comparatively little high frequency activity. Examples of the types of high frequency activity recorded are shown in panels C–E. Panel C is an example of high frequency oscillations (HFOs) where the upper trace is a raw recording (0.5–900 Hz) and the lower trace shows the HFO in isolation. As can be seen in panel B, HFOs are quite frequent during hypsarrhythmia and at times appear to occur synchronously at multiple recording sites. Interictal spikes shown in panel D can also contribute to high frequency recordings as does very low amplitude baseline high frequency activity shown in Figure 2E.
Figure 2.
High frequency EEG activity during hypsarrhythmia in a TTX-infused rat. (A) An excerpt taken from recordings in Figure 1A (initial 5 sec) but shown here at a faster time base to illustrate discrete neurophysiological events. Band pass filtered at 0.5–500 Hz. Arrows denote 3 of the numerous multifocal interictal spikes present in this record. (B) The same recordings as in A but filtered at 80–500 Hz to illustrate high frequency activity nested in the raw recordings in A. (C–E) Selected events (arrows) from traces LL in A and B but shown at a faster time base. Top trace filtered at 0.5–500 Hz; lower trace 80–500 Hz. (C) An HFO, (D) An interictal spike and (E) Interictal background activity showing very low voltage continuous high frequency activity.
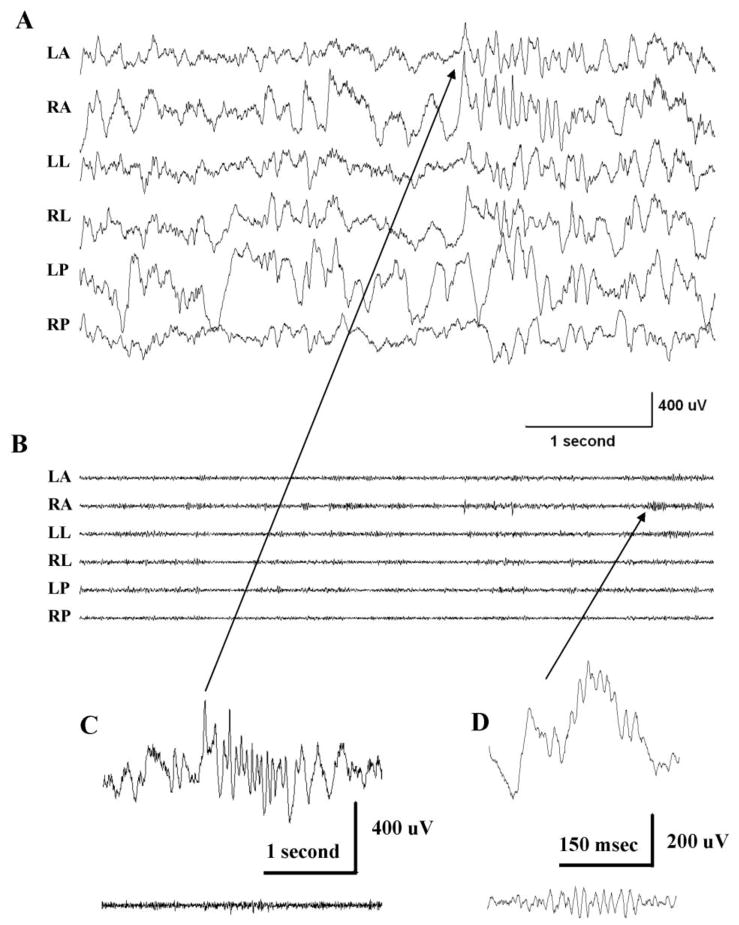
High frequency activity recorded from a control animal is shown in Figure 3. Raw EEG traces (0.5–500 Hz) in panel A are filtered in B (80–500 Hz) to visualize high frequency activity, which is much less prominent than in the comparable recordings from rats with spasms in Figure 2B. However, HFOs in the ripple frequency range are observed (panel D). Sleep spindles recorded during NREM sleep were found not to be associated with any underlying high frequency activity (panel C). Events similar to interictal spikes are rarely observed in recordings from control animals.
Figure 3.
High frequency EEG activity during NREM sleep in a control rat. (A) An excerpt taken of the final 5 sec of Figure 1C and shown here at an expanded time base. (filtered at 0.5–500 Hz). (B) The same recordings as in A but filtered at 80–500 Hz to illustrate high frequency activity. (C) A sleep spindle recording from electrode RA (see arrow). (D) HFO of ripple frequency also recorded on RA. Upper traces in C and D filtered at 0.5–500 Hz – lower traces 80–500 Hz.
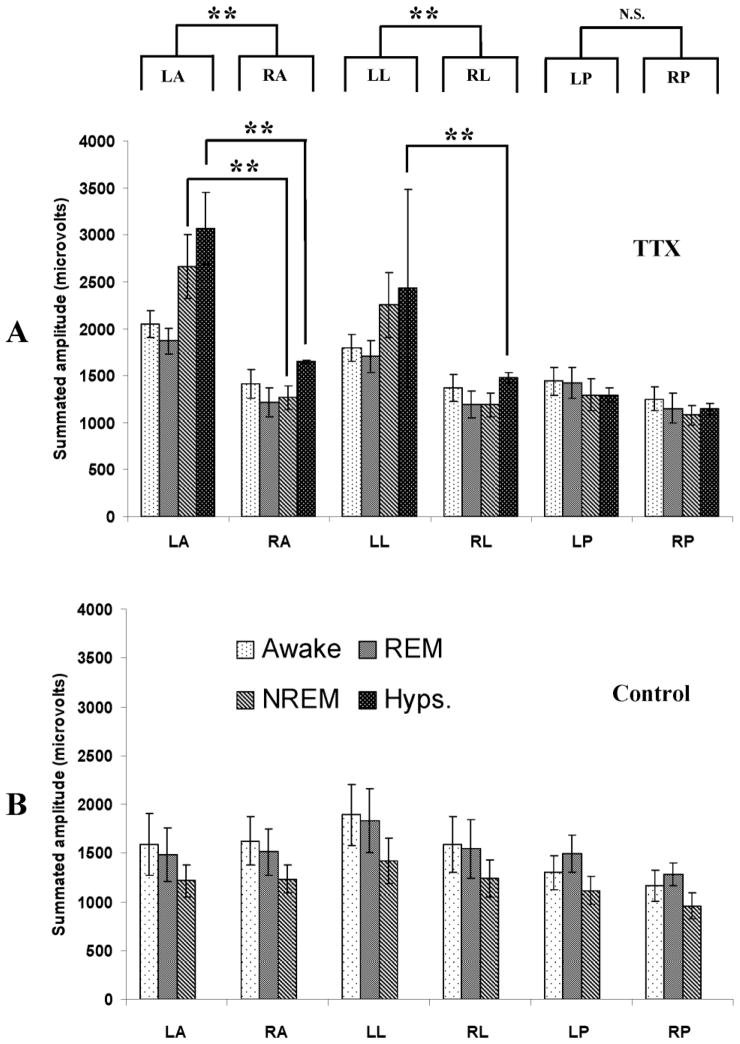
Previous studies of high frequency activity during ictal events in the TTX model showed that this type of activity was not generated uniformly across neocortex (Frost et al. 2011). Instead, activity was most prominent contralateral to the site of TTX infusion at recording sites LA and LL. Based on this observation, we next examined variations in interictal high frequency activity across recording sites. Interictal EEGs during 4 behavioral states, waking, REM sleep, NREM sleep and hypsarrhythmia were analyzed. The summated amplitudes of high frequency activity in the 50–900 Hz range from 4 TTX infused and 4 control rats are shown in Figure 4. Results clearly show that in the TTX infused rats, high frequency activity was not uniform. Instead this activity was most prominent at electrodes LA and LL in all 4 behavioral states. Statistical analysis (two-way ANOVA) demonstrated that when the summated amplitudes of high frequency activity in all 4 behavioral states were considered together, recordings from site LA differed from that of site RA and LL differed from RL (upper portions of Figure 4A). Moreover, the differences at these sites were largest during NREM sleep and hypsarrhythmia. At sites other than LA and LL in the TTX animals, summated high frequency activity ranged from 1000 – 1500 μV. At LA and LL the amplitudes were 1.5 –2.5 fold larger. In sharp contrast, the measures from control rats were quite uniform across all recording sites (Figure 4B). Importantly, the summated amplitudes of high frequency activity in control rats was very similar to the recordings from RA, RL, LP and RP electrodes in TTX infused rats. This leads us to conclude that the differences in high frequency activity across recording sites during and following TTX infusion were not due to persistent suppression of neuronal activity on the infused side of the brain - since recordings from these areas closely matched recordings from control animals. Instead, these results suggest that high frequency activity contralateral to TTX infusion (particularly at sites LA and LL) is unusually intense compared to normal situations.
Figure 4.
Comparison of high frequency activity quantified at 6 recording sites and during 4 behavioral states. (A) Analysis of EEG activity from TTX-infused rats showed asymmetry in high frequency (50–900 Hz) activity. The upper portion of panel A indicates that when the summated amplitude of high frequency activity across all 4 behavioral states were considered together (two-way ANOVA) recordings at sites LA and RA as well as LL and RL differed statistically from each other. This was not the case for recordings from LP and RP. High frequency activity was most different during NREM sleep and hypsarrhythmia at sites LA and LL. (B) An identical analysis of recordings from control rats failed to demonstrate a similar asymmetry in high frequency activity. Two to 5 randomly selected 16 sec epochs during waking, NREM sleep, REM sleep and hypsarrhythmia were analyzed in 4 TTX-infused and 4 control ACSF-infused rats. Results are presented as means ± S.E.M. ** p ≤ 0.01.
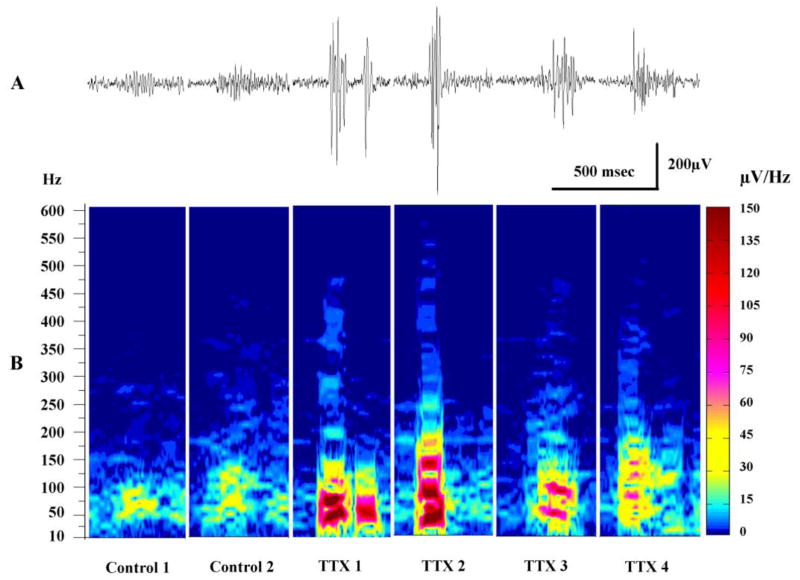
Since the majority of high frequency activity likely arises from HFOs in the EEG, we next attempted to characterize the differences in these events between control and experimental animals. Figure 5 shows representative recordings and corresponding spectral plots of HFOs from 6 rats. Recordings in panel A illustrate the dramatic differences between the HFOs in control rats and experimental animals. In controls, the HFOs have the appearance typical of ripples (see also Figure 3D). In concert with this notion are spectral arrays (panel B) showing that for these oscillations the frequency components with the most intensity were in the 50–150 Hz range – approximating the frequency for ripples. In contrast, HFOs recorded from epileptic neocortex were much larger in amplitude as shown in the recordings from 4 TTX-infused rats. Moreover, the spectral intensity was markedly larger than that of control rats. While there were major frequency components in the ripple frequency in all 4 TTX treated rats, higher frequencies up to 550 Hz were present as well that were not seen in the plots from control rats. When comparing TTX treated rats to control animals, interictal HFOs with frequency components greater than 250 Hz were much more frequent in TTX treated rats (25.6 ± 2.8 versus 3.9 ± 1.6 per minute: p ≤ 0.001, one-way ANOVA). Consistent with results in Figure 4, HFO events were found to be most common during hypsarrhythmia and NREM sleep. For instance during 2 to 5 randomly selected 16 sec epochs from each of 4 TTX-treated rats: 8.25 ± 0.71 events were recorded on average during hypsarrhythmia, 6.79 ± 1.27 were counted during NREM sleep but only 2.46 ± 0.89 occurred during waking and 0.5 ± 0.30 in REM sleep. The frequency of HFOs in hypsarrhythmia and NREM sleep were statistically different from that of REM sleep (p ≤ 0.01) and waking (p ≤ 0.05).
Figure 5.
Comparison of typical HFOs recorded from control and epileptic rats. (A) Traces show representative HFOs recorded from 2 control rats and 4 TTX-infused rats – filter: 80 – 500 Hz. (B) Spectral plots for the same events shown above; however raw EEG recordings were analyzed to illustrate the full complement of frequencies in these events. Notice the marked differences in amplitude of the HFOs as well as the intensity of the power spectra between control and experimental animals.
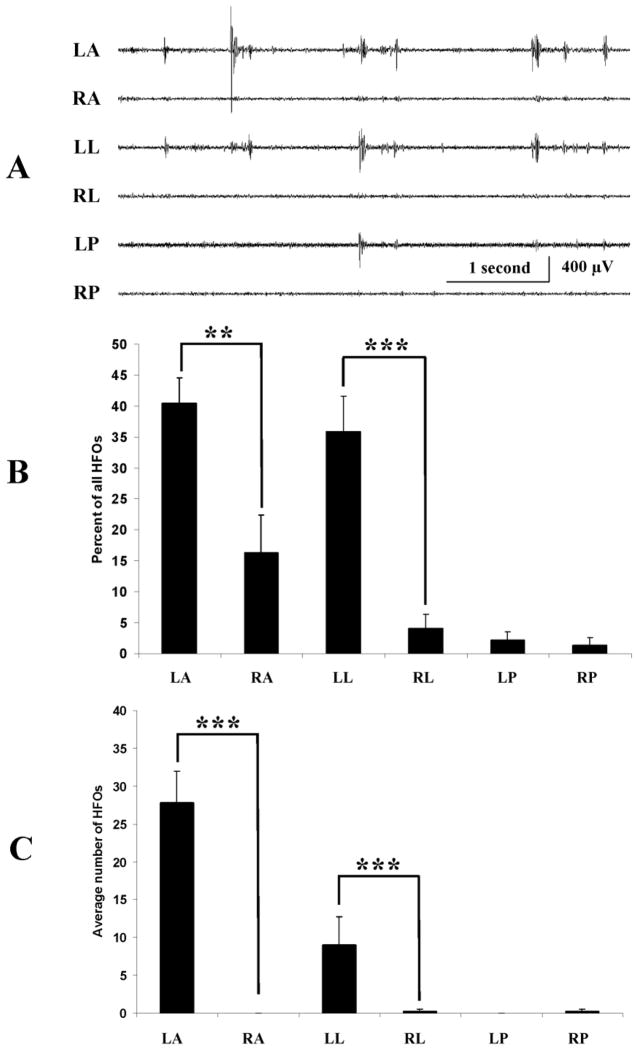
Also in keeping with results in Figure 4 and the supposition that HFOs contribute importantly to the asymmetry of high frequency activity across cortex were results of analysis of HFOs across recording sites. To conduct this analysis, 5 randomly selected 16 second epochs of EEG during NREM sleep were analyzed in all experimental animals. Figure 6A shows a representative short segment of one of these recordings which illustrates the differences in frequency and amplitude of HFOs between recording sites. When HFO counts from recordings from the 3 electrodes in the TTX-infused cortex were combined and compared to those in the uninfused cortex, the frequency of HFOs contralaterally was more than twice that of the infused cortex (26.0 ± 2.7 versus 12.9 ± 2.3 per minute: p ≤ 0.001, one-way ANOVA). When recordings from individual electrodes were considered separately results in Figure 6B show that the frequency of HFOs was highest at recording sites LA and LL. Fewer HFOs were recorded at RA and very few were recorded at the remaining recording sites.
Figure 6.
HFOs occur more frequently and are of highest amplitude contralateral to TTX infusion. (A) Recordings illustrating variations in the frequency and amplitude of HFO across recording sites. (B) Plots of the differences in the frequency of HFOs recorded at the 6 recording sites. HFOs with frequencies greater than 250 Hz were counted to avoid including non-pathologic ripple-like events. Five randomly selected 16 sec epochs were analyzed during NREM sleep in 4 TTX treated animals. (C) HFOs with the maximum amplitude were recorded most often with electrodes LA and LL. As illustrated in A, HFOs can occur simultaneously on several channels. Using the same data base as analyzed in B, results showed that when HFOs occurred simultaneously the vast majority of these events were largest at site LA with fewer at LL. Very few were largest at other recording sites. ** p ≤ 0.01, *** p ≤ 0.001.
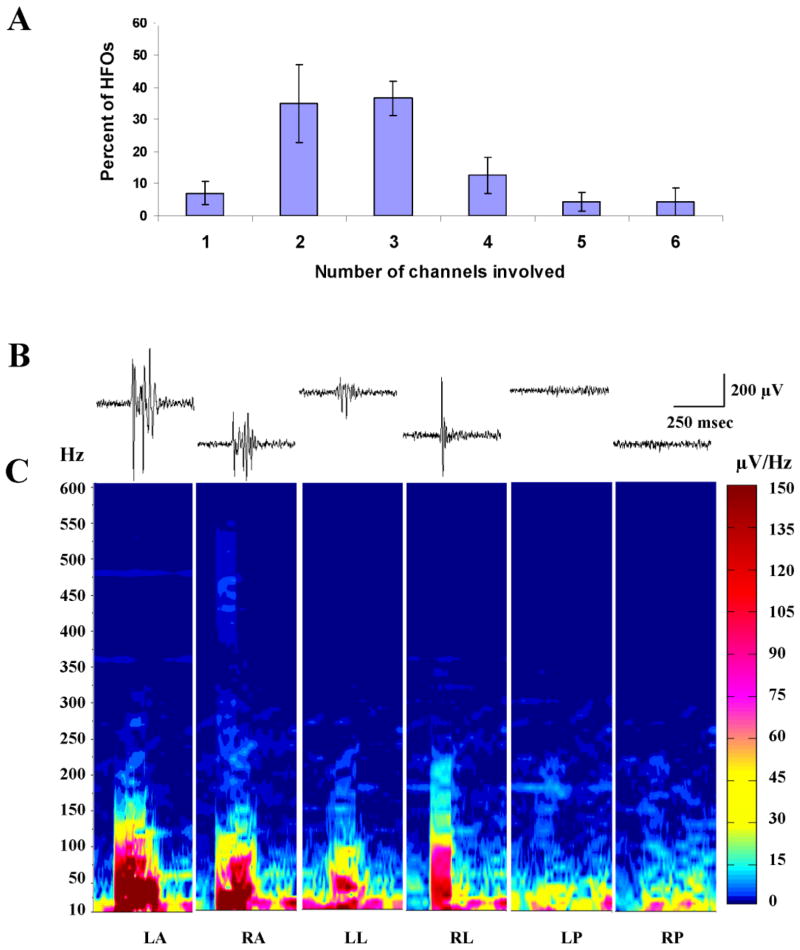
However, while HFOs were more frequent in recordings at the LA and LL sites, HFOs could still be recorded from any of the recording electrodes. Moreover, as suggested by the recordings in Figures 2B and 6A, HFOs could be recorded simultaneously from multiple recording sites. The highly focal nature of HFO generation has been repeatedly emphasized in previous studies of focal epilepsy (Bragin et al., 2002a; Bragin et al., 2002b; Worrell et al., 2008; Schevon et al., 2009; Crepon et al., 2010). Recordings in Figure 2B and 6A suggest this might not be the case in this animal model of infantile spasms. To further investigate this possibility, we examined the occurrence of simultaneously recorded HFOs at our 6 recording sites. Figure 7A shows the results of this analysis. HFOs were most commonly recorded simultaneously at 2 or 3 sites in the cortex. Recordings of HFOs from only one site were relatively rare occurring in less than 10% of cases. Simultaneous recordings at 4, 5 or 6 sites were not frequent but still occurred. To explore any differences between the HFOs that are recorded simultaneously at different sites, spectral analysis was undertaken of synchronous HFOs. Figure 7B shows an analysis of representative recordings where HFOs were recorded at the same time at 4 recording sites. The spectra demonstrate that the frequency components of the HFOs were similar at the 4 sites as was the intensity of the oscillations at most frequencies. Nonetheless, when we examined the peak to peak amplitudes of HFOs at the different recording site we found that HF0s of the largest amplitude were recorded at electrode sites LA 76.8% of the time (27.8 ± 4.3). At 21.3% of the time, events were largest at the LL electrode (9.0 ± 3.8). The remaining 1.9% were recorded at RL (0.3 ± 0.3) and RP (0.3 ± 0.3) (Figure 6C). However, while HFOs were observed relatively infrequently ipsilateral to TTX infusion, isolated HFOs could on rare occasions be observed at these sites independent of activity at other sites. Taken together, these results lead us to conclude that HFOs with similar frequency content can be generated synchronously across wide areas of neocortex. However, the amplitude and frequency of occurrence of these events are largest contralateral to TTX infusion.
Figure 7.
HFOs can occur simultaneously on multiple channels. (A) Plotted is the percentage of HFOs that occurred on 1 or more recording channels at the same time. Five, 16 sec epochs obtained during NREM sleep were analyzed from 4 experimental rats and results were averaged. Data presented as mean ± S.E.M. (B and C) To evaluate similarities and differences between HFO that occurred synchronously on multiple channels, spectra were computed. (B) Traces show substantial differences in the wave forms recorded simultaneously at the different sites. Filter 80–500 Hz. (C) Despite differences in wave forms, spectra for these 4 events have similar frequency components with overlapping intensities.
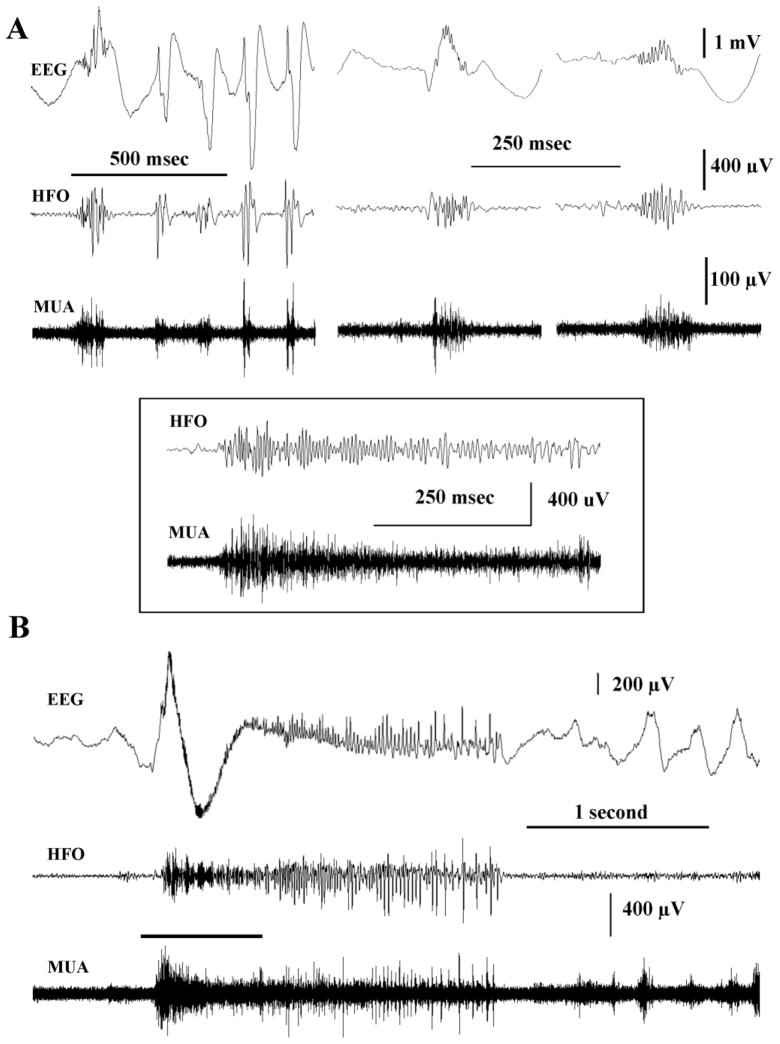
The abnormal or pathological HFOs recorded in this animal model of infantile spasms appear to share many of the features of HFOs previously described in animal models of focal epilepsy and human epilepsy. However, apparent differences exist – such as the surprisingly wide distribution of simultaneously recorded HFOs across the cortex as illustrated in Figure 7. To further explore the underlying mechanisms responsible for HFOs, we recorded multiunit activity using microwires simultaneously with EEG recordings. Several very recent studies of human epilepsy and animals have reported the firing of units simultaneous with HFOs suggesting they are excitatory events (Worrell et al., 2008; Schevon et al., 2009; Bragin et al., 2011). Recordings in Figure 8A show that, in concert with the work of others, robust multiunit activity occurs simultaneously with HFOs in our animal model. In this instance, HFOs were selected from periods of NREM sleep. Traces in the left panel in Figure 8A show a relatively slow time-base recording during which a cluster of 5 HFOs occurred. Each HFO was associated with a burst of multiunit firing. Two other HFOs and simultaneous unit firings are shown at a faster time base in the center and right-hand panel of Figure 8A. Consistent with these recordings was our analysis of 44 consecutive HFOs from randomly selected recording segments from 2 rats (22 events from each rat). Of the 44 events analyzed all 44 or 100% were associated with increases in multiunit activity. Multiunit activity also increased abruptly at the onset of an ictal event (see Inset Figure 8) and continued throughout the behavioral spasm in this same animal (Figure 8B). Such recordings suggest that the HFOs reported here are likely produced by enhanced neural network activity.
Figure 8.
Multiunit activity (MUA) occurs simultaneous with HFOs and also at the onset of ictal events. (A) Simultaneous recordings of the raw EEG, HFO activity and multiunit activity. (A-left) A comparatively slow time base recording of a cluster of 5 HFOs. Note the robust unit activity that occurred at the same time in the lower trace. (A-center and right) Faster time base recordings showing in more detail other individual HFOs and the associated multiunit activity. (B) Units also fired at high frequencies at the onset of seizures and continued discharging throughout the ictal event. Inset shows an expanded time base recording of high frequency activity (HFA) and multiunit activity at seizure onset (see line above traces in B). Recordings were from a position comparable to site LA in Figure 1. Upper traces in each panel – raw EEG (1–450 Hz), Middle trace – HFOs filtered at 80–450Hz. Lower trace - multiunit recordings made with the same microwire and filtered at 600–9000 Hz.
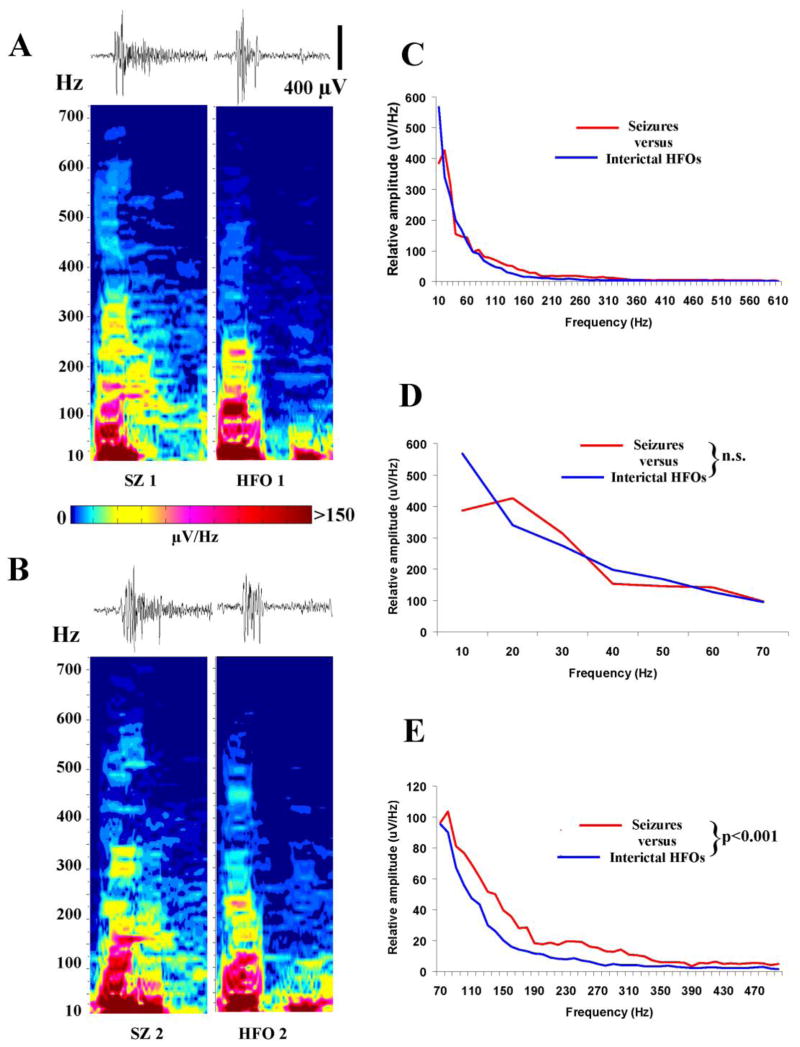
Results in Figure 8 suggest that HFOs and the events underlying the onset of ictal events may have features in common. To explore this notion further, the wave form and frequency content of HFOs were compared to HFO-like events that occur at the onset of ictal events. Recordings in Figure 9A and B compare the onset of 2 HFOs with that of 2 ictal events that occurred within a few minutes of each other. Traces at the top left in Figure 9A and B show the onset of the ictal events (80–500 Hz band pass filter) and the corresponding spectral plots are below (Sample duration is 500 msec). To the right, traces show EEG recordings of 2 HFOs with their corresponding spectral plots. The first 100–200 msec of the HFOs and ictal events appear very similar in these 500 msec traces. Moreover, the spectra of HFOs and ictal events have comparable frequency content and similar intensities at most frequencies. However, a close visual inspection of the spectral plots of seizure onset in both Figures 9A and B suggest that more intense activity is present at higher frequencies (e.g. 300 Hz) when compared to interictal HFOs. To further explore this possibility, the intensity of EEG activity at frequencies from 10 to 500 Hz was calculated for the first 100 msec of ictal events and interictal HFOs. Results from twenty randomly-selected seizures (5 seizures from 4 rats) and 4 randomly-selected epochs of interictal HFO activity containing 10 consecutive HFOs (one each from the same 4 rats) were averaged and plotted in Figure 9C. In keeping with the spectral plots in Figure 9A and B, the average spectra for seizure onset and interictal HFOs showed many similarities – especially when amplitudes at lower frequencies (10–70 Hz) were compared in Figure 9D. However, when frequencies from 70–500 Hz were analyzed, seizure onset consistently had more intense activity than interictal HFOs. Thus, while interictal HFOs and high frequency activity at seizure onset share many similarities, differences in the intensity of high frequency activity may play a role in determining whether or not high frequency activity progresses to an ictal event and a behavioral spasm.
Figure 9.
Similarities and differences between HFO and HFO-like events occurring at seizure onset. (A and B) Comparison of the onset of 2 ictal events with 2 interictal HFOs. Traces of the events are shown above corresponding spectral intensity plots (Sample duration is 500 msec). The HFOs occurred in the same animal and were recorded within a few minutes of the seizures shown beside them. Note the difference in spectral intensity at 300 Hz in seizure-onset recordings versus interictal HFOs. EEG traces were filtered at 80–500 Hz. (C to E) Comparison of averaged EEG amplitude spectrum of the first 100 msec of 20 randomly selected ictal events and 40 interictal HFOs obtained from 4 animals. The full spectra from 10–600 Hz in C appear comparable. No differences were apparent in low frequency (10–70 Hz) activity in D. However, the amplitude of the spectrum above 70 Hz was consistently greater (p ≤ 0.001) at seizure onset than that occurring interictally.
DISCUSSION
Experiments reported here describe marked differences between interictal EEG recordings in rats with infantile spasm-like seizures and their controls. One dramatic difference was the frequent occurrence of a hypsarrhythmic EEG pattern that differed from that of NREM sleep patterns in controls by the unusually large amplitudes of slow waves and the presence of frequent multifocal spikes. While these are common features of EEG recordings from patients, we also describe for the first time frequent HFOs during hypsarrhythmia. HFOs were found to be most frequent at these times but could occur during all behavioral states. However, they were not observed uniformly throughout cortex but instead were largest and most frequent contralateral to the site of TTX infusion in homotopic cortex and anterior to this region in frontal cortex. Unlike previous studies of human and animal models of epilepsy, HFOs were found not to be restricted to small regions of the brain but instead occurred simultaneously at multiple and widely spaced regions of the neocortex. Taken together our results would suggest that in this animal model large areas of neocortex contralateral to TTX infusion are hyperexcitable. Multiunit recordings made at the same time with EEG recordings were consistent with this notion since unit activity increases markedly during HFOs. Moreover, multiunit activity and HFO-like events - very similar to those of interictal periods - occur at the onset of ictal events that underlie behavioral spasms.
HFOs and areas of abnormal neuronal excitability
Previously, our laboratory undertook an analysis of the ictal events that occur simultaneously with behavioral spasms in the TTX model (Frost, Jr. et al., 2011). Unexpectedly, spectral analysis suggested that ictal events were most intense contralateral to the sites of TTX infusion and anterior to this homotopic region in frontal cortex. Most often, the onsets of ictal events were recorded first at these same sites. Our analysis of HFOs in interictal periods are fully consistent with these observations and suggest these areas are unusually excitable. For instance, Figure 4 compares the level of high frequency activity at 6 recording sites and 4 behavioral states. Results showed that high frequency activity was most prominent at recordings sites LA and LL – the same sites where high frequency activity during ictal events was most prominent. There could be two reasons for this asymmetry: 1) the contralateral cortex could be unusually excitable or 2) activity in the ipsilateral cortex could be depressed. In terms of the second possibility, it is conceivable that TTX depresses activity over a wide area of the infused cortex and that the EEG activity in contralateral cortex is actually normal and only appears high relative to a depressed infused cortex. Prior experiments that mapped cortical activity with the 2-deoxyglucose method showed that TTX significantly decreases glucose consumption consistent with its ability to block neuronal activity. However, this effect was restricted to a small spherical volume of tissue centered on the infusion site with a radius approximating 2.5mm (Galvan et al., 2000). Nonetheless, it remained a possibility that cortical activity was partially depressed over a wider area of the brain. Results in Figure 4 argue against this notion. High frequency activity was quantified in both experimental and control animals. High frequency activity was found to be very uniform in control rats and this level of activity was essentially the same as recorded from neocortex ipsilateral to TTX infusion. Thus it does not appear that neuronal activity in the neocortex on this side of the brain is depressed. Instead, our results strongly favor the alternative hypothesis that activity in the contralateral cortex is atypically very high – suggesting regional hyperexcitability.
HFO rate and amplitude were also quantified across recording sites (Figure 6) and the results are fully in keeping with those of Figure 4. HFOs were most often recorded at recording sites LA and LL and were of the highest peak-to-peak amplitudes at those sites. Further support for the notion that these areas of cortex may be hyperexcitable comes from the multiunit recordings in Figures 8. Robust multiunit activity occurred simultaneously with HFOs – consistent with the conclusion from numerous other studies that suggest they are a reflection of enhanced neural network activity (Bragin et al., 2002a; Bragin et al., 2007; Worrell et al., 2008; Schevon et al., 2009; Bragin et al., 2011). In keeping with this idea is the observation that HFO-like events occur at the onset of ictal events (Figure 8 and 9) and that similar intense multiunit activity occurs at this time. A similar occurrence of HFO activity has been reported at the onset of seizures in temporal lobe epilepsy (Bragin et al., 2005; Jacobs et al., 2008). Although at this time it is not possible to conclude with certainty, it seems highly likely that the neurons participating in the generation of HFOs in our animal model also contribute to the generation of ictal events and consequently behavioral spasms. Nonetheless, it is interesting to consider the possibility that high frequency components of ictal discharges and interictal HFOs share underlying cellular mechanisms. Recordings of identified single units with tetrode techniques should help address this issue.
Results in Figure 9 provoked additional thoughts on potential mechanisms underlying ictal-like events in infantile spasms. Spectral plots revealed many similarities in the frequency content of interictal HFOs and the HFO-like events at seizure onset. However, our quantitative analysis in Figures 9C–E showed that there is significantly more activity in the high frequency band from 80–500 Hz when ictal events occur. This leads us to suspect that an important aspect of infantile spasm generation is the frequency content of interictal activity. The more intense high frequency activity is, the more likely an interictal HFO will transition to an ictal event. Understanding why cortical networks demonstrate such marked variability in excitability from one moment to the next will likely be key to understanding important aspects of spasm generation.
Potential Pathophysiological Mechanisms
One obvious question raised by the results presented here is: how does local blockade of neuronal activity in one brain area lead to network hyperexcitabilty at other quite distant sites. We have previously speculated on this issue (Frost,. et al., 2011). However, it is reasonable to suspect that alterations in callosal connections between cortical hemispheres play an important role in generating abnormal activity at sites remote from TTX infusion. Recent studies of the development of axons of the corpus callosum in the mouse have shown that callosal axons arise from layer 2–3 pyramidal cells soon after birth and reach the midline by the third postnatal day (Wang et al., 2007; Mizuno et al., 2007). Axons continue to grow towards their contralateral target over the next week and ascend from subcortical white matter tracks into layers 2–3 and 5 from day 6 –12. Relevant to experiments reported here are studies where neuronal activity was suppressed in callosally projecting neurons by over expression of the potassium channel Kir2.1, or when transmitter release was blocked in these cells by expressing the tetanus toxin light chain. Both maneuvers which would suppress neuronal activity in vivo greatly diminished the number of axons that reached the contalateral cortex. In the case of tetanus toxin expression, some axons reached the contralateral cortex by P12 only to withdraw by P21. In our studies, TTX infusion beginning on P11–12 in rats may have very similar effects on maturing callosal axons and their developing synapses. However, our preliminary anatomical studies have revealed that TTX consistently produces a thinning of the neocortex at the infusion site (Lee et al. 2007) – possibly reminiscent of a focal cortical dysplasia. A localized loss of some immature cortical neurons due to physiological inactivity is a possibility. Thus, TTX may have two effects of the developing cortex. It may suppress the growth of callosal axons and at the same time diminish innervation of contralateral synaptic partners due to neuronal loss. In theory, both effects would lead to a partial denervation of the contalateral cortex. This alone could not explain the generation of abnormal HFOs or spasms, but the loss of long-range projections might lead to compensatory or homeostatic alterations in local circuits in contralateral cortex which could underlie the genesis of spasms. While highly speculative, the strength of this hypothetical scheme is that it is experimentally testable.
Features of HFOs in the TTX Model
Currently, there is considerable discussion surrounding the distinguishing features of ripples and fast ripples in humans and animal models of epilepsy (Engel et al., 2009). In our work, we have not attempted to distinguish between these events. Instead, we simply describe the frequency components of the HFOs we have recorded – primarily through spectral analysis. Under our recording conditions, HFOs in the infantile spasms model contained frequencies from less than 50 Hz to as high as 600 Hz. The intensity of the oscillations is actually largest in the ripple frequency range but contains significant activity at what has been called fast ripples frequencies. In human focal epilepsy, HFOs that appear to be restricted to fast ripple frequencies have been reported (Worrell et al., 2008; Schevon et al., 2009). However, in other instances, lower frequencies (below 250 Hz) are also well represented (Bragin et al., 2002b; Crepon et al., 2010). In animal models of focal epilepsy, activity in both the ripple and fast ripple ranges have been reported in HFOs (Bragin et al., 2002a; Jiruska et al., 2010). In this sense they are similar to that reported here. As shown in Figure 5, another distinguishing feature of HFOs in our recordings from epileptic animals, when compared to those from control rats, is the large amplitude of these events and the intensity of spectral amplitude across a wide range of frequencies. This would suggest that a much larger population of neurons is participating in HFOs generated in these epileptic animals than in their controls
In many studies, a close relationship has been proposed between interictal spikes/sharp waves and fast ripples. Indeed, many have described HFO as riding on the envelope of these slower events or at least nested within their wave forms (Urrestarazu et al., 2007; Jiruska et al., 2010; Crepon et al., 2010) However, in other instances or in the same study HFOs have been recorded separately from interictal spikes which suggests they may be separate neurophysiological entities (Bragin et al., 2002b; Schevon et al., 2009). It is clear from the recordings we have analyzed that HFOs in this animal model can occur separate and independent of interictal spikes. However, it is also clear that the two events can occur simultaneously. Thus, they may be independent events that are triggered by transient increases in network excitability. Such time-dependent changes in cortical excitability could be dictated either locally in cortex and/or by ascending influences arising from midbrain or brain stem nuclei
Most often, HFOs have been described in human and animal models of focal epilepsy as events highly restricted anatomically (Bragin et al., 2002a; Bragin et al., 2002b). When arrays of microwires have been used, the vast majority of HFOs were recorded only by a single wire even when the wires in the array were within hundreds of microns of each other (Worrell et al., 2008; Schevon et al., 2009; Crepon et al., 2010). Thus we were surprised to find that HFOs in our recordings were routinely observed across multiple recording sites. These sites could be widely spaced and indeed in some instances could involve all 6 recording electrodes which were implanted bilaterally and as much as 6 mm apart on either side of the brain (Figure 1). We feel the reason for this difference in our results from those of others is that infantile spasms is a generalized epilepsy and thus far other studies have been in humans with focal epilepsy and similar animal models. Thus, It seems very likely that the network abnormalities responsible for temporal lobe epilepsy and infantile spasms are quite different. These differences could mean wide areas of neocortex are hyperexcitable in infantile spasms as opposed to focal epilepsy where abnormalities may be very localized.
Highlights.
High frequency oscillations (HFOs) occur most frequently during hypsarrhythmia.
HFOs are most prominent contralateral to the site of TTX infusion
HFOs are commonly recorded synchronously across multiple recording sites.
Multiunit neuronal firing increases abruptly with HFO generation.
Similar HFOs and multiunit firing occur at the onset of behavioral spasms.
Acknowledgments
This work was supported by grants from the NIH/NINDS, The Vivian L. Smith Foundation and Questcor Pharmaceuticals
Footnotes
Publisher's Disclaimer: This is a PDF file of an unedited manuscript that has been accepted for publication. As a service to our customers we are providing this early version of the manuscript. The manuscript will undergo copyediting, typesetting, and review of the resulting proof before it is published in its final citable form. Please note that during the production process errors may be discovered which could affect the content, and all legal disclaimers that apply to the journal pertain.
References
- Bickford RG, Billinger TW, Fleming NI, Steward F. The compressed spectral array (CSA). a pictorial EEG Proc San Diego. Biomed Symp. 1972;11:365–370. [Google Scholar]
- Bragin A, Azizyan A, Almajano J, Wilson CL, Engel J., Jr Analysis of chronic seizure onsets after intrahippocampal kainic acid injection in freely moving rats. Epilepsia. 2005;46:1592–1598. doi: 10.1111/j.1528-1167.2005.00268.x. [DOI] [PubMed] [Google Scholar]
- Bragin A, Benassi SK, Kheiri F, Engel J., Jr Further evidence that pathologic high-frequency oscillations are bursts of population spikes derived from recordings of identified cells in dentate gyrus. Epilepsia. 2011;52:45–52. doi: 10.1111/j.1528-1167.2010.02896.x. [DOI] [PMC free article] [PubMed] [Google Scholar]
- Bragin A, Engel J, Jr, Wilson CL, Fried I, Buzsaki G. High-frequency oscillations in human brain. Hippocampus. 1999;9:137–142. doi: 10.1002/(SICI)1098-1063(1999)9:2<137::AID-HIPO5>3.0.CO;2-0. [DOI] [PubMed] [Google Scholar]
- Bragin A, Mody I, Wilson CL, Engel J., Jr Local generation of fast ripples in epileptic brain. J Neurosci. 2002a;22:2012–2021. doi: 10.1523/JNEUROSCI.22-05-02012.2002. [DOI] [PMC free article] [PubMed] [Google Scholar]
- Bragin A, Wilson CL, Engel J., Jr Voltage depth profiles of high-frequency oscillations after kainic acid-induced status epilepticus. Epilepsia. 2007;48 (Suppl 5):35–40. doi: 10.1111/j.1528-1167.2007.01287.x. [DOI] [PubMed] [Google Scholar]
- Bragin A, Wilson CL, Staba RJ, Reddick M, Fried I, Engel J., Jr Interictal high-frequency oscillations (80–500 Hz) in the human epileptic brain: entorhinal cortex. Ann Neurol. 2002b;52:407–415. doi: 10.1002/ana.10291. [DOI] [PubMed] [Google Scholar]
- Crepon B, Navarro V, Hasboun D, Clemenceau S, Martinerie J, Baulac M, Adam C, Le Van QM. Mapping interictal oscillations greater than 200 Hz recorded with intracranial macroelectrodes in human epilepsy. Brain. 2010;133:33–45. doi: 10.1093/brain/awp277. [DOI] [PubMed] [Google Scholar]
- Engel J, Jr, Bragin A, Staba R, Mody I. High-frequency oscillations: what is normal and what is not? Epilepsia. 2009;50:598–604. doi: 10.1111/j.1528-1167.2008.01917.x. [DOI] [PubMed] [Google Scholar]
- Frost JD, Jr, Lee CL, Hrachovy RA, Swann JW. High frequency EEG activity associated with ictal events in an animal model of infantile spasms. Epilepsia. 2011;52:53–62. doi: 10.1111/j.1528-1167.2010.02887.x. [DOI] [PMC free article] [PubMed] [Google Scholar]
- Galvan CD, Hrachovy RA, Smith KL, Swann JW. Blockade of neuronal activity during hippocampal development produces a chronic focal epilepsy in the rat. J Neurosci. 2000;20:2904–2916. doi: 10.1523/JNEUROSCI.20-08-02904.2000. [DOI] [PMC free article] [PubMed] [Google Scholar]
- Gibns EL, Fleming MM, Gibbs FA. Diagnosis and prognosis of hypsarrhythmia and infantile spasms. Pediatrics. 1954;13:66–73. [PubMed] [Google Scholar]
- Hrachovy RA, Frost JD, Jr, Kellaway P. Hypsarrhythmia: variations on the theme. Epilepsia. 1984;25:317–325. doi: 10.1111/j.1528-1157.1984.tb04195.x. [DOI] [PubMed] [Google Scholar]
- Inoue T, Kobayashi K, Oka M, Yoshinaga H, Ohtsuka Y. Spectral characteristics of EEG gamma rhythms associated with epileptic spasms. Brain Dev. 2008;30:321–328. doi: 10.1016/j.braindev.2007.10.003. [DOI] [PubMed] [Google Scholar]
- Jacobs J, LeVan P, Chander R, Hall J, Dubeau F, Gotman J. Interictal high-frequency oscillations (80–500 Hz) are an indicator of seizure onset areas independent of spikes in human epileptic brain. Epilepsia. 2008;49:1893–1907. doi: 10.1111/j.1528-1167.2008.01656.x. [DOI] [PMC free article] [PubMed] [Google Scholar]
- Jirsch JD, Urrestarazu E, LeVan P, Olivier A, Dubeau F, Gotman J. High-frequency oscillations during human focal seizures. Brain. 2006;129:1593–1608. doi: 10.1093/brain/awl085. [DOI] [PubMed] [Google Scholar]
- Jiruska P, Finnerty GT, Powell AD, Lofti N, Cmejla R, Jefferys JG. Epileptic high-frequency network activity in a model of non-lesional temporal lobe epilepsy. Brain. 2010;133:1380–1390. doi: 10.1093/brain/awq070. [DOI] [PMC free article] [PubMed] [Google Scholar]
- Kobayashi K, Oka M, Akiyama T, Inoue T, Abiru K, Ogino T, Yoshinaga H, Ohtsuka Y, Oka E. Very fast rhythmic activity on scalp EEG associated with epileptic spasms. Epilepsia. 2001;45:488–496. doi: 10.1111/j.0013-9580.2004.45703.x. [DOI] [PubMed] [Google Scholar]
- Lee CL, Antalffy B, Frost JD, Jr, Hrachovy RA, Swann JW. Persistent focal neocortical abnormalities in the TTX model of infantile spasms. Epilepsia. 48(S6):295. [Google Scholar]
- Lee CL, Frost JD, Jr, Swann JW, Hrachovy RA. A new animal model of infantile spasms with unprovoked persistent seizures. Epilepsia. 2008;49:298–307. doi: 10.1111/j.1528-1167.2007.01377.x. [DOI] [PubMed] [Google Scholar]
- Lisman JE, Idiart MA. Storage of 7 +/− 2 short-term memories in oscillatory subcycles. Science. 1995;267:1512–1515. doi: 10.1126/science.7878473. [DOI] [PubMed] [Google Scholar]
- Llinas RR. The intrinsic electrophysiological properties of mammalian neurons: insights into central nervous system function. Science. 1988;242:1654–1664. doi: 10.1126/science.3059497. [DOI] [PubMed] [Google Scholar]
- Mizuno H, Hirano T, Tagawa Y. Evidence for activity-dependent cortical wiring: formation of interhemispheric connections in neonatal mouse visual cortex requires projection neuron activity. J Neurosci. 2007;27:6760–6770. doi: 10.1523/JNEUROSCI.1215-07.2007. [DOI] [PMC free article] [PubMed] [Google Scholar]
- Nariai H, Nagasawa T, Juhasz C, Sood S, Chugani HT, Asano E. Statistical mapping of ictal high-frequency oscillations in epileptic spasms. Epilepsia. 2011a;52:63–74. doi: 10.1111/j.1528-1167.2010.02786.x. [DOI] [PMC free article] [PubMed] [Google Scholar]
- Nariai H, Matsuzaki N, Juhász C, Nagasawa T, Sood S, Chugani HT, Asano E. Ictal high-frequency oscillations at 80–200 Hz coupled with delta phase in epileptic spasms. Epilepsia. 2011b;52:1528–1167. doi: 10.1111/j.1528-1167.2011.03263.x. [DOI] [PMC free article] [PubMed] [Google Scholar]
- Panzica F, Binelli S, Canafoglia L, Casazza M, Freri E, Granata T, Avanzini G, Franceschetti S. ICTAL EEG fast activity in West syndrome: from onset to outcome. Epilepsia. 2007;48:2101–2110. doi: 10.1111/j.1528-1167.2007.01264.x. [DOI] [PubMed] [Google Scholar]
- Panzica F, Franceschetti S, Binelli S, Canafoglia L, Granata T, Avanzini G. Spectral properties of EEG fast activity ictal discharges associated with infantile spasms. Clin Neurophysiol. 1999;110:593–603. doi: 10.1016/s1388-2457(98)00031-5. [DOI] [PubMed] [Google Scholar]
- Schevon CA, Trevelyan AJ, Schroeder CE, Goodman RR, McKhann G, Jr, Emerson RG. Spatial characterization of interictal high frequency oscillations in epileptic neocortex. Brain. 2009;132:3047–3059. doi: 10.1093/brain/awp222. [DOI] [PMC free article] [PubMed] [Google Scholar]
- Urrestarazu E, Chander R, Dubeau F, Gotman J. Interictal high-frequency oscillations (100–500 Hz) in the intracerebral EEG of epileptic patients. Brain. 2007;130:2354–2366. doi: 10.1093/brain/awm149. [DOI] [PubMed] [Google Scholar]
- Wang CL, Zhang L, Zhou Y, Zhou J, Yang XJ, Duan SM, Xiong ZQ, Ding YQ. Activity-dependent development of callosal projections in the somatosensory cortex. J Neurosci. 2007;27:11334–11342. doi: 10.1523/JNEUROSCI.3380-07.2007. [DOI] [PMC free article] [PubMed] [Google Scholar]
- Worrell GA, Gardner AB, Stead SM, Hu S, Goerss S, Cascino GJ, Meyer FB, Marsh R, Litt B. High-frequency oscillations in human temporal lobe: simultaneous microwire and clinical macroelectrode recordings. Brain. 2008;131:928–937. doi: 10.1093/brain/awn006. [DOI] [PMC free article] [PubMed] [Google Scholar]
- Ylinen A, Bragin A, Nadasdy Z, Jando G, Szabo I, Sik A, Buzsaki G. Sharp wave-associated high-frequency oscillation (200 Hz) in the intact hippocampus: network and intracellular mechanisms. J Neurosci. 1995;15:30–46. doi: 10.1523/JNEUROSCI.15-01-00030.1995. [DOI] [PMC free article] [PubMed] [Google Scholar]


