Abstract
Magnetization transfer (MT) MRI measurements were performed in 3 pancreatic ductal adenocarcinoma (PDAC) mouse xenograft models. For each of 28 PDAC xenografts, magnetization transfer ratios (MTR) were calculated and compared to histologic fibrosis levels from reference standard trichrome staining. MTR was found to be significantly higher in tumors grown using BxPC-3 cell line (39.4 ± 5.1, mean ± SD) compared to the MTR for the tumors grown from Panc-1 (32.4 ± 2.8) and Capan-1 (27.3 ± 2.9) cell lines (P < 0.05 for each comparison). Histologic measurements showed a similar trend with BxPC-3 tumors demonstrating significantly higher fibrosis levels (percentage of fibrotic tissue area, 6.48 ± 2.59) when compared to Panc-1 (3.54 ± 2.18) and Capan-1 (2.07 ± 1.60) tumors. MTR measurements were well correlated to quantitative fibrosis levels (r = 0.69, P = 0.01). Results indicated that MTR measurements offer the potential to serve as a valuable in vivo biomarker of desmoplasia in PDAC.
Keywords: Magnetization Transfer, Fibrosis, Pancreatic Cancer, Mouse Xenograft Model
INTRODUCTION
Pancreatic ductal adenocarcinoma (PDAC) is the 4th leading cause of cancer-related mortality in the U.S. with a 5-year survival rate of less than 5% (1). A common hallmark of PDAC is tumor desmoplasia characterized by remarkable increases in fibrotic connective tissue that penetrates and envelopes the neoplasm. Recent studies clearly indicate that this altered extracellular matrix (ECM) is not a passive scaffold but rather serves to actively facilitate disease progression (2), metastasis (3), and drug resistance (4). PDAC-associated desmoplasia can lead to 3-fold increases in collagen deposition compared to normal pancreatic tissues (5,6). Precise quantification of tumor fibrosis levels in PDAC may be critically important for patient staging and for the prediction or monitoring of responses to therapy.
Currently, histologic analysis of biopsy samples remains the gold-standard for characterizing desmoplasia in PDAC. However, the collection of PDAC biopsy samples is inherently invasive, particularly given the deep visceral location of the organ. The number of biopsy samples that can be safely collected from a single tumor is limited. Thus, given the widely heterogenous nature of the desmoplastic reaction in PDAC, the latter sampling limitations can lead to a gross misrepresentation of underlying fibrosis levels. New methods to permit noninvasive quantification of fibrosis levels in PDAC would be particularly useful for serial assessment of disease progression or for monitoring the efficacy of therapies intended to target the tumor stroma.
Anatomic T2-weighted and T1-weighted contrast-enhanced magnetic resonance imaging (MRI) has been widely employed to identify pancreatic malignancies (7–9). Diffusion-weighted MRI (DWI) can serve as a non-invasive biomarker for staging hepatic fibrosis (10,11) and recent studies have demonstrated that apparent diffusion coefficient (ADC) measurements are correlated to tumor fibrosis levels in PDAC (12–14). However, the broad-scale utility of DWI methods remains uncertain, particularly for staging PDAC fibrosis. ADC changes with progressive fibrosis most likely results from associated perfusion reductions (15,16). PDAC are often hypovascular, and the strength of this positively correlated association between desmoplasia-associated collagen deposition and perfusion may be widely variable. Furthermore, there remain a number of unresolved technical difficulties associated with DWI in the abdomen, specifically, image distortion, chemical shift artifacts, and the limited spatial resolution permitted with conventional single-shot methods (17). Dynamic contrast enhanced (DCE) MRI methods can similarly be used to non-invasively detect alterations to tissue microvasculature; DCE-MRI has served as a valuable biomarker for evaluating therapy response following the administration of anti-angiogenic and vascular-disrupting drugs (18,19). DCE-MRI has also been used to evaluate remnant pancreatic fibrosis after pancreaticojejunostomy (20). A recent prospective study reported that DCE measurement parameters are correlated to fibrosis levels and microvascular density in malignant and benign solid pancreatic focal lesions (21). However, while DCE measurements may potentially serve as a valuable fibrosis-correlated biomarker, the development of quantitative imaging metrics independent of perfusion levels may be particularly valuable for desmoplasia assessment in PDAC.
Magnetization transfer (MT) MRI can be used to non-invasively probe dynamic physical processes involving the exchange of magnetization between sub-populations of free water protons and those water protons bound to tissue macromolecules. MT-MRI studies in white matter (22), cartilage degeneration (23) and regeneration (24), Crohn’s disease (25), and liver fibrosis (26) have each demonstrated that magnetization transfer contrast (MTC) can be highly sensitive to tissue collagen concentration, the primary component of desmoplasia (27). Thus, we hypothesized that desmoplasia-associated fibrosis levels in PDAC may be directly reflected in MT-MRI magnetization transfer ratio (MTR) measurements. The purpose of this study was to compare non-invasive MTR measurements to invasive histologic assessments of tumor tissue fibrosis-levels in three mouse xenograft models of PDAC.
MATERIALS AND METHODS
PDAC Cell Lines
Three cell lines (Panc-1, BxPC-3, and Capan-1) were obtained commercially from American Type Culture Collection (ATCC; Rockville, MD) and grown in their required growth media per ATCC description. In short, BxPC-3 was grown in ATCC-formulated RPMI-1640 medium supplemented with 10% fetal bovine serum (FBS); Panc-1 was grown in ATCC-formulated Dulbecco's Modified Eagle's Medium with 10% FBS; and Capan-1 cells were grown in ATCC-formulated Iscove's Modified Dulbecco's Medium containing 20% FBS.
Mouse Xenograft Models
All animal studies were approved by the Institutional Animal Care and Use Committee of Northwestern University. Six-week-old nude mice (Balb/c mice, weighing between 13 and 17 g) were obtained from Charles River (Wilmington, MA). The animals were housed in isolators under standard conditions (temperature 22 ± 2°C, relative humidity 55 ± 10%, 12 h dark/12 h light cycle) with unrestricted access to a balanced pellet diet and water.
The xenograft models were created via the injection of human PDAC cell lines into the left and right flank tissues to grow tumors roughly 10 mm in size within 3–4 weeks. For each cell line, mice were inoculated with 5 × 10⁶ cells in 200 µL PBS in each flank. Tumor growth was monitored daily by measuring the average tumor diameter (two perpendicular axes of the tumor were measured using a caliper). Twenty one days following tumor implantation, mice were anesthetized for MRI scans.
MR Imaging
Before and during MRI, animals were anesthetized by a mixture of isoflurane and oxygen (Isoflurane Vaporizer, Vaporizer Sales and Services, Rockmart, GA). The inflow of isoflurane was 4% for induction and 0.5–1.5% during MRI. An eye lubricant was administered to each animal to prevent corneal desiccation while under anesthesia. Mouse temperature was monitored continuously and controlled with a water bed. Heart rate, respiration rate, and blood pressure were monitored with an MRI-compatible small animal gating system (SA Instruments, Stony Brook, NY).
MRI studies were performed using a 7 Tesla, 16 cm bore size Bruker Pharmascan system with an actively decoupled 72 mm volume coil transmitter and 38 mm mouse coil receiver (Bruker BioSpin, Billerica, MA). Our MT MRI pulse sequence included a 20 ms Gaussian presaturation pulse followed by a 3D spoiled gradient-echo pulse sequence (TR/TE/flip-angle = 36 ms/2.93 ms/9°). To select off-resonance frequency and radiofrequency (RF) power to generate significant MT contrast while minimizing direct saturation effects (28), MT z-spectra were obtained with 25 off-resonance frequencies from 0 Hz to 100 kHz and five RF power levels (2, 4, 8, 12, and 16 µT) (25). B0 and B1 field maps were generated to correct the field variations for the MT measurements (29,30). To evaluate the direct saturation effect of the MT pulse, a 5 mm diameter NMR tube (New Era, NJ) filled with 0.3 mM MnCl2 (Sigma-Aldrich, Saint Louis, MO) was placed beside the animal during the MR scans (28). MT z-spectra during preliminary scans showed that an 8 µT Gaussian RF pulse at 3500 Hz off-resonance was able to generate strong MT contrast while avoiding direct saturation effects (reflected as a normalized magnetization approaching unity within the MnCl2 z-spectrum at 3.5 kHz with 8 µT pulse). The same Gaussian pulse with an off-resonance frequency of 100 kHz was applied to generate MR images without MT saturation. Additional imaging parameters include: FOV = 32×32 mm2; slab thickness = 16 mm; 3D matrix = 128 × 128 × 16; NEX = 2.
Histology
Mice were euthanized, and their tumors were excised immediately after imaging. Each tumor was sliced through the center to produce two equally sized tumor halves. One half of the tumor was stored in liquid nitrogen for biochemical analysis. The other half was fixed in 10% formalin, embedded in paraffin, and sliced (4 µm slice thickness). The slides were submitted to the pathology core for Masson’s trichrome staining. These trichrome-stained slides (one central slice from each tumor) were scanned at 20× magnification and digitized using TissueFAXS system (TissueGnostics, Los Angeles, CA). HistoQuest Cell Analysis Software (TissueGnostics, Los Angeles, CA) was then used for automated measurement of the fibrotic tissue areas within each slide (Afibrosis, distinct blue regions defined as the fibrotic tissue area). The total tumor tissue area (Atotal) was also measured and finally the percentage of fibrotic tissue was expressed as a ratio of the latter two area measurements: Afibrosis / Atotal × 100. These measurements were repeated for each xenograft tumor.
MRI Data Analysis
All post processing was performed offline using the Matlab software (MathWorks, Natick, MA). Voxel-wise MT ratio (MTR) maps were calculated as follows: 100 × (1 − Msat / M0), where Msat represents the signal intensity for the image acquired following application of the MT pulse, and M0 is the signal intensity image acquired without MT saturation. These MTR maps were calibrated with the previously collected B0 and B1 field maps (31). For an imaging slice through the center of each tumor, a region-of-interest (ROI) was drawn to circumscribe the entire tumor (identical ROIs were transferred to Msat and M0 images as well as corresponding MTR maps); the mean MTR value was reported for each tumor.
Statistical Analysis
Both the MRI MTR data and histologic data were expressed as mean ± standard deviation. One-way analysis of variance (ANOVA) was used to compare MTR measurements and fibrotic area measurements for the xenograft tumors grown from each of the three PDAC cell lines. Post-hoc testing was performed using the Tukey method. Pearson correlation coefficients were calculated to assess the relationship between MTR measurements and corresponding histologic fibrosis measurements. All statistical analyses were performed with Stata software (Stata11, Stata-Corp, College Station, Tex). Statistical significance was defined as P < 0.05.
RESULTS
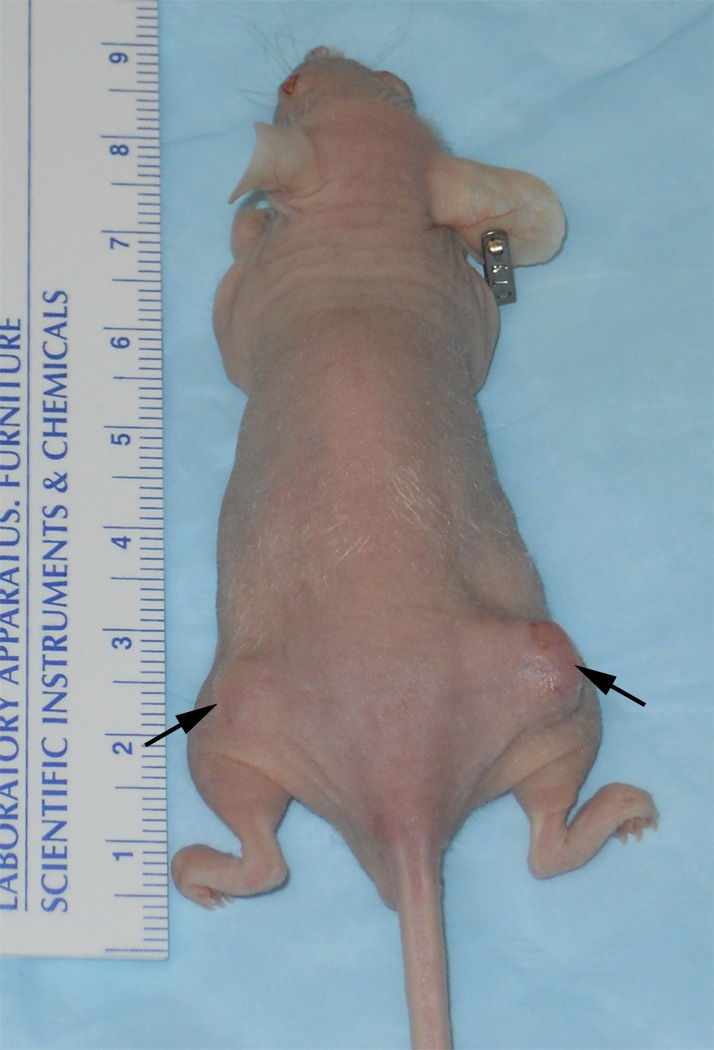
A total of twenty-eight PDAC xenografts were grown in the 14 mice (one tumor grown in each hind limb) with 10 tumors from Panc-1 cell line, 11 tumors from BxPC-3 cell line and 7 tumors from Capan-1 cell line. Fig. 1 shows the representative photograph of a mouse with xenograft tumors grown in both right and left flanks.
Figure 1.
Xenograft tumors (arrows) grown using PDAC cell lines injected subcutaneously in mouse flanks. For this example, tumor in the left flank was grown from Panc-1 cell line and the tumor in the right flank was grown from BxPC-3 cell line.
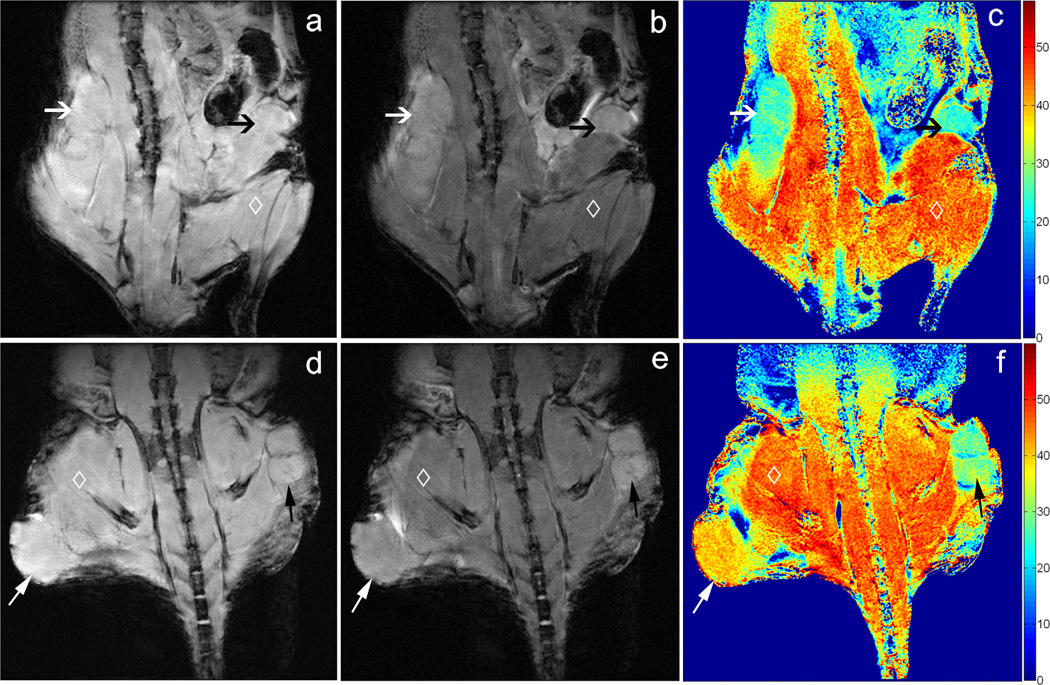
Representative MT images and corresponding MTR maps for two mouse models are shown in Fig. 2. For the first mouse (top row), tumors in both flanks were grown using the same Capan-1 cell line. Notice that for this example the corresponding MTR maps demonstrated similar MT effects within both the left and right tumors (Fig. 2c, 25.22 ± 2.51 and 24.31 ± 2.19 (mean ± SD) for left and right tumors, respectively). For the second depicted mouse (bottom row), the tumor in the right flank (lower left side of image) was grown from the BxPC-3 cell line and demonstrated markedly higher MT effects (39.78 ± 2.84) compared to the left flank tumor grown in the same animal but using the Panc-1 cell line (30.19 ± 3.08, Fig. 2f).
Figure 2.
Coronal MR images of xenograft mouse models; images in the top row are from a mouse with Capan-1 tumors in both right and left flanks whereas bottom row images depict a mouse with BxPC-3 tumor in right flank, Panc-1 tumor in left flank. These images were acquired using a 3D GRE sequence with RF saturation pulses applied at 100 kHz (a, d) and 3.5 kHz (b, e) off-resonance. The saturation pulse applied 3.5 kHz off-resonance generated substantial MT effects across the imaging volume. Corresponding MTR maps are shown at right (c, f). The two Capan-1 tumors in the first mouse demonstrated similar MT effects (black and white arrows, c). For the second mouse, the BxPC-3 tumor demonstrated markedly higher MT effects compared to the left flank Panc-1 tumor (black and white arrows, respectively, f). Skeletal muscle (◊) also demonstrated strong MT effects.
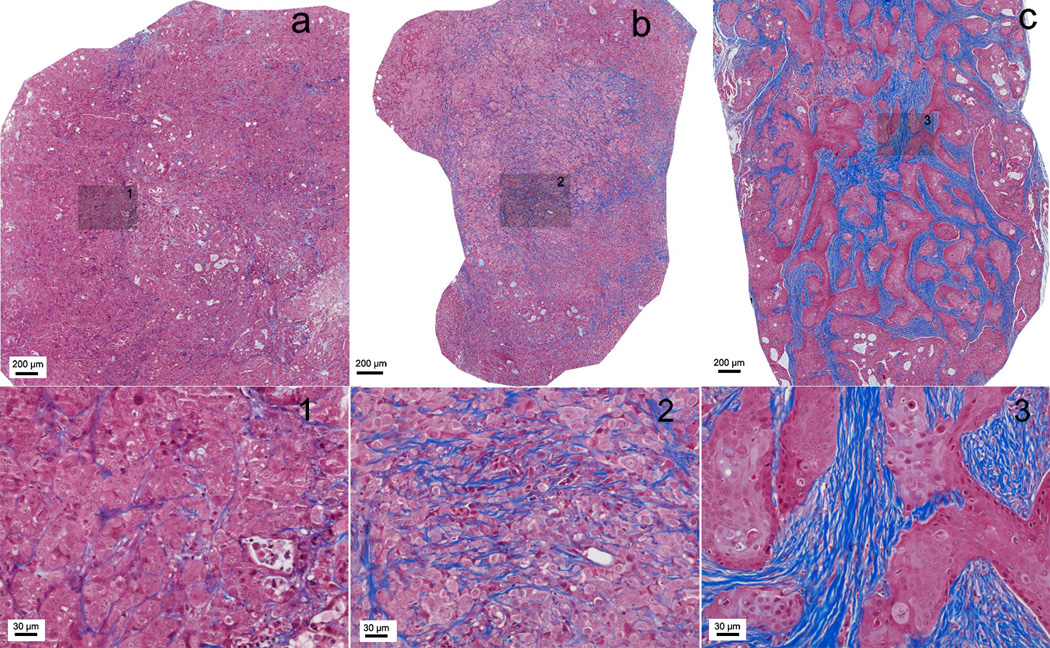
Representative tri-chrome histology slides for Capan-1, Panc-1, and BxPC-3 xenograft tumors are shown in Fig. 3. These slides clearly depict the fibrotic stroma seen histologically as blue-stained bands of collagen enveloping the tumor cells in each xenograft. BxPC-3 xenografts consistently demonstrated significantly greater levels of fibrosis and associated collagen deposition; the percentages of fibrotic tissue area measured for these specific examples were 1.28, 4.21, and 7.39 for Capan-1, Panc-1 and BxPC-3 tumors, respectively.
Figure 3.
Masson-trichrome stained histology slices from tumors grown using each of the three PDAC cell lines: (a) Capan-1, (b) Panc-1 and (c) BxPC-3. Fibrotic stroma is depicted as blue-stained bands of collagen. Large FOVs (top row) show the overall distribution of fibrotic tissue within these central tumor slices and inset positions 1–3 (shaded boxes). Corresponding 20× magnification images at these inset positions clearly demonstrate the increased levels of fibrosis and associated collagen deposition within BxPC-3 tumors.
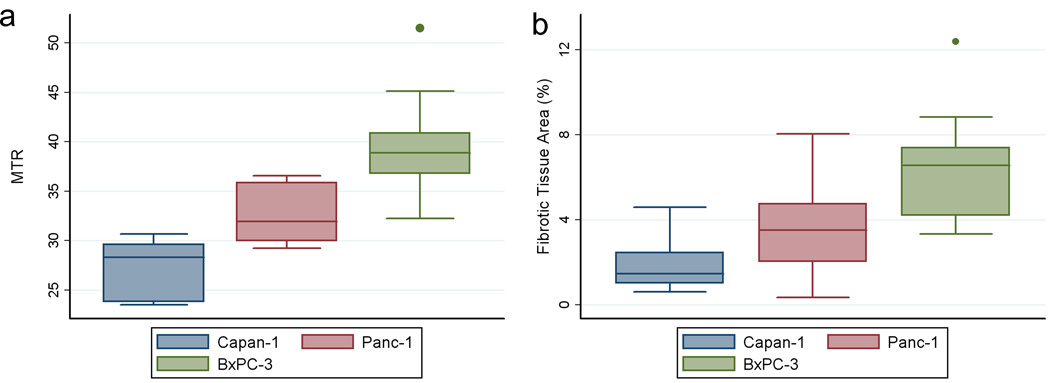
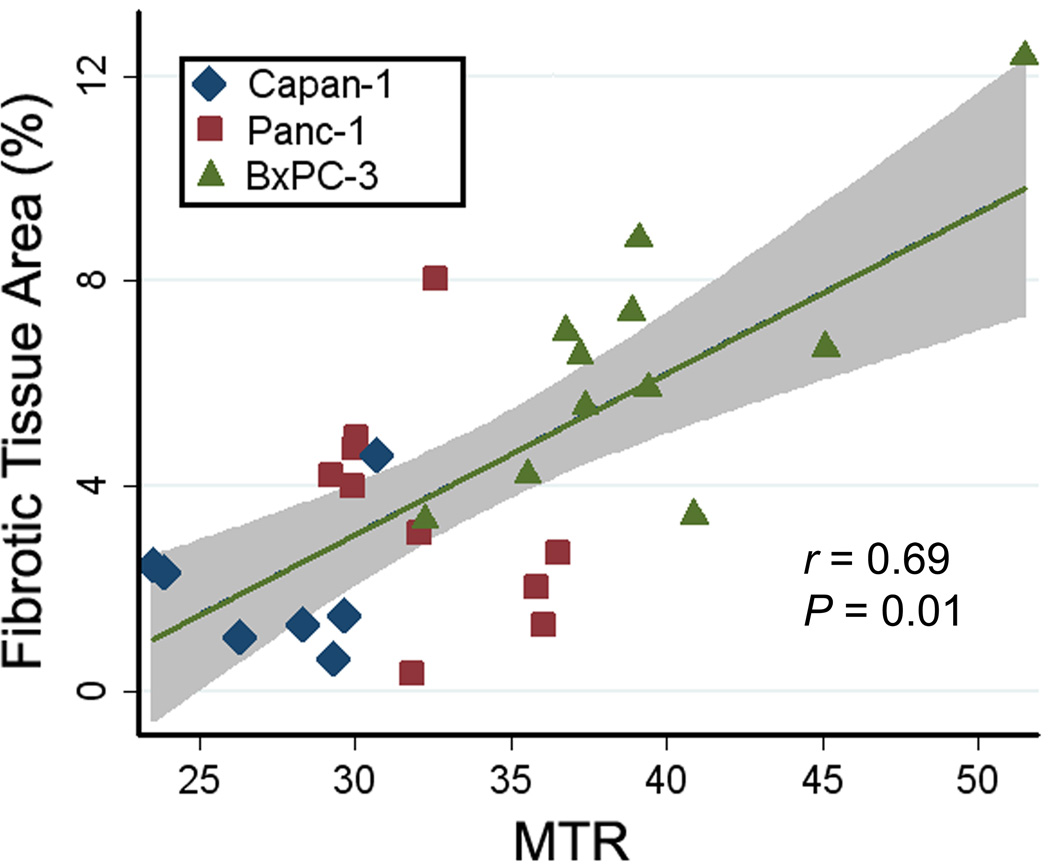
A summary of both our in vivo MTR measurements and histologic measurements of fibrotic tissue area for each tumor type is shown in Fig. 4. MTR measurements from the 11 tumors grown from the BxPC-3 cell line (39.4 ± 5.1, mean ± SD) were higher than MTR measurements in 10 tumors grown from Panc-1 cell line (32.4 ± 2.8) and the 7 tumors from Capan-1 cell line (27.3 ± 2.8), Fig. 4a. BxPC-3 MTR measurements were significantly different compared to both Panc-1 and Capan-1 measurements (P = 0.001 and < 0.000, respectively); a significant difference was also found between MTR measurements in Panc-1 and Capan-1 xenografts (P = 0.038). Histologic trichrome measurements showed a similar trend (Fig. 4b) with tumors grown from the BxPC-3 cell line demonstrating significantly higher fibrotic areas (percentage fibrosis area, 6.48 ± 2.59, mean ± SD) when compared to Panc-1 fibrotic areas (3.54 ± 2.18) and Capan-1 (2.07 ± 1.60), respectively. BxPC-3 fibrotic tissue area measurements were significantly higher when compared to both Panc-1 and Capan-1 measurements (P = 0.014 and P = 0.001, respectively); however, no significant difference was found between fibrotic tissue area measurements in Panc-1 and Capan-1 xenografts (P = 0.329). A direct comparison of MTR measurements to corresponding histologic fibrotic area measurements across all tumor types further illustrated these relationships (r = 0.69, P = 0.01; Fig. 5).
Figure 4.
Box-and-Whisker plots for MTR measurements (a) and histologic fibrotic tissue area measurements (b) for each of the three cell lines: Capan-1, Panc-1 and BxPC-3. The horizontal line through each box represents the mean value and box represents data from the 25th to the 75th percentile (middle 50% of observations). The whiskers represent data from the minimum to the maximum excluding outlier values that are displayed as separate dots.
Figure 5.
Graph shows the relationship between MTR measurements and histologic fibrotic tissue area measurements for tumors grown from the Capan-1 (n = 7), Panc-1 (n = 10), and BxPC-3 (n = 11) cell lines. The shaded region represents the 95% confidence interval for linear regression of fibrosis on MTR (r = 0.69, P = 0.01).
DISCUSSION
Desmoplasia plays a significant role in the pathogenesis and drug-resistance of PDAC. Non-invasive methods to monitor collagen deposition associated with PDAC desmoplasia may be important for predicting response to chemotherapy and/or detecting response to therapies that target the tumor stroma. Multiple prior studies have clearly demonstrated that MT-MRI measurements can be sensitive to tissue collagen contents (23–25,27). During the current study, in vivo MT-MRI measurements were performed in three mouse xenograft models of PDAC. Resulting MTR measurements were significantly different for these three tumor models and corresponding histology measurements demonstrated significantly different collagen levels for each tumor type. Further translational studies remain necessary to validate the efficacy of these methods in clinical patients but these initial encouraging results strongly suggest the feasibility of using MTR measurements as a non-invasive biomarker of tumor associated desmoplasia in PDAC.
MRI of MT processes can be used to non-invasively assess the proportion (sub-population) of protons in cells and tissues that are bound to macromolecules (31). MT-MRI generates contrast that is primarily determined by the fraction of large macromolecules or immobilized phospholipid cell membranes within the imaged tissues (31). In this study, we found that MTR measurements in tumors generated from the BxPC-3 cell line were much higher than those from Panc-1 and Capan-1 tumors. These findings were consistent with histologic trichrome measurements of mean fibrotic area in the corresponding xenograft tissue samples; BxPC-3 tumors each showed significantly higher fibrosis levels than the tumors resulting from the other two PDAC cell lines.
Recent studies report that tumors in gemcitabine-resistant patients are enriched in stromal pathways (3,4) and targeting the stroma has been proposed as a novel strategy to improve drug delivery and chemotherapeutic efficacy in PDAC (4). Quantitative or semi-quantitative information about the desmoplastic stroma, characterized by abundant extracellular matrix synthesis and extensive collagen production, may be particularly valuable for predicting gemcitabine therapy response in PDAC patients. The results from the current study indicate that MT-MRI may serve as a valuable non-invasive tool for predicting response to gemcitabine chemotherapy. Furthermore, the results from this study and previous studies in Crohn’s disease models (25) suggest that MT-MRI approaches might be broadly applicable to a number of different fibrotic diseases with potential utility for probing fibrous dysplasia in bone (32) and fibrous lesions of the breast (33).
There were several limitations in this study. First, these were performed with xenograft models rather than transgenic models or clinical patients with in situ pancreatic disease. Nonetheless, these xenograft models and associated cell lines have been highly valuable for prior studies of PDAC desmoplasia (4,34,35) thus we anticipate that these MT methods will remain effective for fibrosis assessments within tumors located in the pancreas; however, future translational validation studies remain necessary. As indicated in the MT-MR images (Fig. 2), both muscle and other benign tissues may have similar MT levels to tumors, which could make utilization of these techniques difficult in diagnostic settings. In addition, different pancreatic cancer etiologies may have different total protein content, which could give rise to different MT-MRI contrast. Future studies could be valuable in patients to evaluate the relationship between MT-MRI measurements and histologic tumor protein content. Second, the current study was performed with ROI-based measurements that encompassed the entire tumor slice for both MRI and histology measurements. The latter approach mitigates difficulties associated with the co-registration of histology slides to corresponding in vivo MRI measurements. However, while useful for establishing a global relationship between desmoplasia-associated collagen deposition and MTR measurements, this approach neglects the heterogeneous nature of tumor fibrosis. Future studies may be valuable to investigate the potential to use MT-MRI methods to further probe the intra-tumoral heterogeneity of collagen deposition. Great care was taken to extract a tumor pathology sample at the center of each tumor for comparison to the central tumor MR imaging slice. However, inherent imprecision associated with this manual orientation and slicing process may have been problematic; the latter unknown along with the significant difference between MRI slice thickness (1.0 mm) and histology tissue slice thickness (4 µm) may have been a key source of variability between the MRI and histology measurements within individual animals. Future studies using multi-slice whole tumor measurements and histologic whole tumor collagen measurements with western blot (protein immunoblot) (25) and/or enzyme-linked immunosorbent assay (ELISA) (36) could be particularly valuable. These are widely used analytical techniques that can be used to detect specific proteins in a given sample of tissue homogenate or extract.
In conclusion, these studies in mouse xenograft models demonstrate that MT effects in PDAC are well correlated to underlying tumor tissue fibrosis levels. These MT-MRI measurements could potentially serve as a non-invasive biomarker of tumor-associated desmoplasia. Translational studies are now needed to validate these methods in PDAC patients.
Acknowledgements
This publication has been funded in part by Grant Number CA134719 from the National Cancer Institute (NCI), in part by Grant Number SP0011492 from the American Cancer Society, and in part by Federal funds from the National Center for Research Resources (NCRR), National Institutes of Health (NIH), through the Clinical and Translational Science Awards Program (CTSA), a trademark of DHHS, part of the Roadmap Initiative, "Re-Engineering the Clinical Research Enterprise." Northwestern University UL1RR0254741. Content is solely the responsibility of the authors and does not necessarily represent the official views of the NIH.
References
- 1.Jemal A, Siegel R, Ward E, Hao Y, Xu J, Murray T, Thun MJ. Cancer Statistics 2008. CA Cancer J Clin. 2008;58(2):71–96. doi: 10.3322/CA.2007.0010. [DOI] [PubMed] [Google Scholar]
- 2.Strouch MJ, Cheon EC, Salabat MR, Krantz SB, Gounaris E, Melstrom LG, Dangi-Garimella S, Wang E, Munshi HG, Khazaie K, Bentrem DJ. Crosstalk between Mast Cells and Pancreatic Cancer Cells Contributes to Pancreatic Tumor Progression. Clinical Cancer Research. 2010;16(8):2257–2265. doi: 10.1158/1078-0432.CCR-09-1230. [DOI] [PMC free article] [PubMed] [Google Scholar]
- 3.Neesse A, Michl P, Frese KK, Feig C, Cook N, Jacobetz MA, Lolkema MP, Buchholz M, Olive KP, Gress TM, Tuveson DA. Stromal biology and therapy in pancreatic cancer. Gut. 2011;60(6):861–868. doi: 10.1136/gut.2010.226092. [DOI] [PubMed] [Google Scholar]
- 4.Olive KP, Jacobetz MA, Davidson CJ, Gopinathan A, McIntyre D, Honess D, Madhu B, Goldgraben MA, Caldwell ME, Allard D, Frese KK, DeNicola G, Feig C, Combs C, Winter SP, Ireland-Zecchini H, Reichelt S, Howat WJ, Chang A, Dhara M, Wang L, Ruckert F, Grutzmann R, Pilarsky C, Izeradjene K, Hingorani SR, Huang P, Davies SE, Plunkett W, Egorin M, Hruban RH, Whitebread N, McGovern K, Adams J, Iacobuzio-Donahue C, Griffiths J, Tuveson DA. Inhibition of Hedgehog Signaling Enhances Delivery of Chemotherapy in a Mouse Model of Pancreatic Cancer. Science. 2009;324(5933):1457–1461. doi: 10.1126/science.1171362. [DOI] [PMC free article] [PubMed] [Google Scholar]
- 5.Mollenhauer J, Roether I, Kern HF. Distribution of extracellular matrix proteins in pancreatic ductal adenocarcinoma and its influence on tumor cell proliferation in vitro. Pancreas. 1987;2(1):14–24. doi: 10.1097/00006676-198701000-00003. [DOI] [PubMed] [Google Scholar]
- 6.Imamura T, Iguchi H, Manabe T, Ohshio G, Yoshimura T, Wang ZH, Suwa H, Ishigami S, Imamura M. Quantitative analysis of collagen and collagen subtypes I, III, and V in human pancreatic cancer, tumor-associated chronic pancreatitis, and alcoholic chronic pancreatitis. Pancreas. 1995;11(4):357–364. doi: 10.1097/00006676-199511000-00007. [DOI] [PubMed] [Google Scholar]
- 7.Kinney T. Evidence-based imaging of pancreatic malignancies. Surg Clin North Am. 2010;90(2):235–249. doi: 10.1016/j.suc.2009.12.003. [DOI] [PubMed] [Google Scholar]
- 8.Kuroki-Suzuki S, Kuroki Y, Nasu K, Nagashima C, Machida M, Muramatsu Y, Moriyama N. Pancreatic cancer screening employing noncontrast magnetic resonance imaging combined with ultrasonography. Jpn J Radiol. 2011;29(4):265–271. doi: 10.1007/s11604-010-0554-6. [DOI] [PubMed] [Google Scholar]
- 9.Shami VM, Mahajan A, Loch MM, Stella AC, Northup PG, White GE, Brock AS, Srinivasan I, de Lange EE, Kahaleh M. Comparison between endoscopic ultrasound and magnetic resonance imaging for the staging of pancreatic cancer. Pancreas. 2011;40(4):567–570. doi: 10.1097/MPA.0b013e3182153b8c. [DOI] [PubMed] [Google Scholar]
- 10.Watanabe H, Kanematsu M, Goshima S, Kondo H, Onozuka M, Moriyama N, Bae KT. Staging Hepatic Fibrosis: Comparison of Gadoxetate Disodium–enhanced and Diffusion-weighted MR Imaging—Preliminary Observations. Radiology. 2011;259(1):142–150. doi: 10.1148/radiol.10100621. [DOI] [PubMed] [Google Scholar]
- 11.Bonekamp S, Torbenson MS, Kamel IR. Diffusion-weighted Magnetic Resonance Imaging for the Staging of Liver Fibrosis. J Clin Gastroenterol. 2011;45(10):885–892. doi: 10.1097/MCG.0b013e318223bd2c. [DOI] [PMC free article] [PubMed] [Google Scholar]
- 12.Muraoka N, Uematsu H, Kimura H, Imamura Y, Fujiwara Y, Murakami M, Yamaguchi A, Itoh H. Apparent diffusion coefficient in pancreatic cancer: Characterization and histopathological correlations. Journal of Magnetic Resonance Imaging. 2008;27(6):1302–1308. doi: 10.1002/jmri.21340. [DOI] [PubMed] [Google Scholar]
- 13.Wang Y, Chen ZE, Nikolaidis P, McCarthy RJ, Merrick L, Sternick LA, Horowitz JM, Yaghmai V, Miller FH. Diffusion-weighted magnetic resonance imaging of pancreatic adenocarcinomas: Association with histopathology and tumor grade. Journal of Magnetic Resonance Imaging. 2011;33(1):136–142. doi: 10.1002/jmri.22414. [DOI] [PubMed] [Google Scholar]
- 14.Fattahi R, Balci NC, Perman WH, Hsueh EC, Alkaade S, Havlioglu N, Burton FR. Pancreatic Diffusion-Weighted Imaging (DWI): Comparison Between Mass-Forming Focal Pancreatitis (FP), Pancreatic Cancer (PC), and Normal Pancreas. Journal of Magnetic Resonance Imaging. 2009;29(2):350–356. doi: 10.1002/jmri.21651. [DOI] [PubMed] [Google Scholar]
- 15.Girometti R, Furlan A, Esposito G, Bazzocchi M, Como G, Soldano F, Isola M, Toniutto P, Zuiani C. Relevance of b-values in evaluating liver fibrosis: A study in healthy and cirrhotic subjects using two single-shot spin-echo echo-planar diffusion-weighted sequences. Journal of Magnetic Resonance Imaging. 2008;28(2):411–419. doi: 10.1002/jmri.21461. [DOI] [PubMed] [Google Scholar]
- 16.Luciani A, Vignaud A, Cavet M, Nhieu JT, Mallat A, Ruel L, Laurent A, Deux JF, Brugieres P, Rahmouni A. Liver cirrhosis: intravoxel incoherent motion MR imaging--pilot study. Radiology. 2008;249(3):891–899. doi: 10.1148/radiol.2493080080. [DOI] [PubMed] [Google Scholar]
- 17.Deng J, Miller FH, Salem R, Omary RA, Larson AC. Multishot diffusion-weighted PROPELLER magnetic resonance imaging of the abdomen. Invest Radiol. 2006;41(10):769–775. doi: 10.1097/01.rli.0000236808.84746.95. [DOI] [PubMed] [Google Scholar]
- 18.Marcus CD, Ladam-Marcus V, Cucu C, Bouché O, Lucas L, Hoeffel C. Imaging techniques to evaluate the response to treatment in oncology: Current standards and perspectives. Critical Reviews in Oncology/Hematology. 2009;72(3):217–238. doi: 10.1016/j.critrevonc.2008.07.012. [DOI] [PubMed] [Google Scholar]
- 19.Akisik MF, Sandrasegaran K, Bu G, Lin C, Hutchins GD, Chiorean EG. Pancreatic Cancer: Utility of Dynamic Contrast-enhanced MR Imaging in Assessment of Antiangiogenic Therapy1. Radiology. 2010;256(2):441–449. doi: 10.1148/radiol.10091733. [DOI] [PubMed] [Google Scholar]
- 20.Tajima Y, Matsuzaki S, Furui J, Isomoto I, Hayashi K, Kanematsu T. Use of the time–signal intensity curve from dynamic magnetic resonance imaging to evaluate remnant pancreatic fibrosis after pancreaticojejunostomy in patients undergoing pancreaticoduodenectomy. British Journal of Surgery. 2004;91(5):595–600. doi: 10.1002/bjs.4461. [DOI] [PubMed] [Google Scholar]
- 21.Bali MA, Metens T, Denolin V, Delhaye M, Demetter P, Closset J, Matos C. Tumoral and Nontumoral Pancreas: Correlation between Quantitative Dynamic Contrast-enhanced MR Imaging and Histopathologic Parameters. Radiology. 2011;261(2):456–466. doi: 10.1148/radiol.11103515. [DOI] [PubMed] [Google Scholar]
- 22.Kucharczyk W, Macdonald PM, Stanisz GJ, Henkelman RM. Relaxivity and magnetization transfer of white matter lipids at MR imaging: importance of cerebrosides and pH. Radiology. 1994;192(2):521–529. doi: 10.1148/radiology.192.2.8029426. [DOI] [PubMed] [Google Scholar]
- 23.Seo GS, Aoki J, Moriya H, Karakida O, Sone S, Hidaka H, Katsuyama T. Hyaline cartilage: in vivo and in vitro assessment with magnetization transfer imaging. Radiology. 1996;201(2):525–530. doi: 10.1148/radiology.201.2.8888253. [DOI] [PubMed] [Google Scholar]
- 24.Li W, Hong L, Hu L, Magin RL. Magnetization transfer imaging provides a quantitative measure of chondrogenic differentiation and tissue development. Tissue Eng Part C Methods. 2010;16(6):1407–1415. doi: 10.1089/ten.tec.2009.0777. [DOI] [PMC free article] [PubMed] [Google Scholar]
- 25.Adler J, Swanson SD, Schmiedlin-Ren P, Higgins PDR, Golembeski CP, Polydorides AD, McKenna BJ, Hussain HK, Verrot TM, Zimmermann EM. Magnetization Transfer Helps Detect Intestinal Fibrosis in an Animal Model of Crohn Disease. Radiology. 2011;259(1):127–135. doi: 10.1148/radiol.10091648. [DOI] [PMC free article] [PubMed] [Google Scholar]
- 26.Aisen AM, Doi K, Swanson SD. Detection of liver fibrosis with magnetic cross-relaxation. Magn Reson Med. 1994;31(5):551–556. doi: 10.1002/mrm.1910310513. [DOI] [PubMed] [Google Scholar]
- 27.Gray ML, Burstein D, Lesperance LM, Gehrke L. Magnetization transfer in cartilage and its constituent macromolecules. Magn Reson Med. 1995;34(3):319–325. doi: 10.1002/mrm.1910340307. [DOI] [PubMed] [Google Scholar]
- 28.Henkelman RM, Huang X, Xiang QS, Stanisz GJ, Swanson SD, Bronskill MJ. Quantitative interpretation of magnetization transfer. Magn Reson Med. 1993;29(6):759–766. doi: 10.1002/mrm.1910290607. [DOI] [PubMed] [Google Scholar]
- 29.Akoka S, Franconi F, Seguin F, Le Pape A. Radiofrequency map of an NMR coil by imaging. Magn Reson Imaging. 1993;11(3):437–441. doi: 10.1016/0730-725x(93)90078-r. [DOI] [PubMed] [Google Scholar]
- 30.Windischberger C, Robinson S, Rauscher A, Barth M, Moser E. Robust field map generation using a triple-echo acquisition. J Magn Reson Imaging. 2004;20(4):730–734. doi: 10.1002/jmri.20158. [DOI] [PubMed] [Google Scholar]
- 31.Henkelman RM, Stanisz GJ, Graham SJ. Magnetization transfer in MRI: a review. NMR Biomed. 2001;14(2):57–64. doi: 10.1002/nbm.683. [DOI] [PubMed] [Google Scholar]
- 32.Char DH, Barakos JA, Cobbs CS, Shiel MJ. Fibrous dysplasia. Orbit. 2010;29(4):216–218. doi: 10.3109/01676831003713991. [DOI] [PubMed] [Google Scholar]
- 33.Goel NB, Knight TE, Pandey S, Riddick-Young M, de Paredes ES, Trivedi A. Fibrous Lesions of the Breast: Imaging-Pathologic Correlation1. Radiographics. 2005;25(6):1547–1559. doi: 10.1148/rg.256045183. [DOI] [PubMed] [Google Scholar]
- 34.Bailey JM, Swanson BJ, Hamada T, Eggers JP, Singh PK, Caffery T, Ouellette MM, Hollingsworth MA. Sonic Hedgehog Promotes Desmoplasia in Pancreatic Cancer. Clinical Cancer Research. 2008;14(19):5995–6004. doi: 10.1158/1078-0432.CCR-08-0291. [DOI] [PMC free article] [PubMed] [Google Scholar]
- 35.Dangi-Garimella S, Krantz SB, Barron MR, Shields MA, Heiferman MJ, Grippo PJ, Bentrem DJ, Munshi HG. Three-Dimensional Collagen I Promotes Gemcitabine Resistance in Pancreatic Cancer through MT1-MMP–Mediated Expression of HMGA2. Cancer Res. 2011;71(3):1019–1028. doi: 10.1158/0008-5472.CAN-10-1855. [DOI] [PMC free article] [PubMed] [Google Scholar]
- 36.Lequin RM. Enzyme Immunoassay (EIA)/Enzyme-Linked Immunosorbent Assay (ELISA) Clin Chem. 2005;51(12):2415–2418. doi: 10.1373/clinchem.2005.051532. [DOI] [PubMed] [Google Scholar]


