Summary
We implement a filterless illumination scheme on a hyperspectral fluorescence microscope to achieve full-range spectral imaging. The microscope employs polarisation filtering, spatial filtering and spectral unmixing filtering to replace the role of traditional filters. Quantitative comparisons between full-spectrum and filter-based microscopy are provided in the context of signal dynamic range and accuracy of measured fluorophores’ emission spectra. To show potential applications, a five-colour cell immunofluorescence imaging experiment is theoretically simulated. Simulation results indicate that the use of proposed full-spectrum imaging technique may result in three times improvement in signal dynamic range compared to that can be achieved in the filter-based imaging.
Keywords: Hyperspectral fluorescence microscopy, filterless illumination, spectroscopy
Introduction
Fluorescence microscopy is used extensively to gain a deeper understanding of varying cellular dynamics. A major impetus towards the widespread application of this analytical tool is the ongoing development of fluorescent probes, which have revolutionised studies of cell and tissue physiology in the past decades (Belmont, 2001; Lichtman & Conchello, 2005; Spector et al., 2004). Taking full advantage of their properties, however, can require modification of the traditional fluorescence imaging set-up. Available fluorescent probes exhibit different photo activities in the visible and near infrared region with Stokes shifts (difference between peak excitation and emission wavelengths) from a few to over a hundred nanometres (Peng et al., 2005). It can be challenging to image multiple probes simultaneously because the absorption spectrum of one fluorophore may overlap with the emission spectrum of another fluorophore.
To acquire fluorescence images, conventional fluorescence microscopy usees exciter/dichroic/emitter filter sets to separate fluorescent emission from excitation. The filter combination of exciter/dichroic/emitter can reach a very high extinction ratio in damping the excitation background, thus providing high contrast for fluorescent objects. However, for many commonly used fluorophores, the Stokes shifts are small, for example, ~20 nm for most dyes in the families of Alexa Fluor and Cy (McNamara et al., 2006). To image these fluorophores with filter sets, one faces an inevitable trade-off between the excitation and emission spectra because they are not allowed to overlap: one either sacrifices a large portion of the excitation spectrum (blocking illumination photons and thus sacrificing measurement speed) or acquires a reduced portion of the emission spectrum (blocking emission photons and thus sacrificing signal-to-noise ratio) to accommodate a given filter set.
To avoid the trade-off between emission and excitation spectra in standard filtered imaging, polarisation filtering has been adopted as an alternative approach to replace the role of traditional filters (Lei & Yao, 2008). It is based on the fact that fluorescence emission often exhibits random polarisation whereas most back-reflected or scattered excitation light remains in the original polarisation state (Lakowicz, 2006). However, polarisation filtering itself cannot achieve a high extinction ratio of excitation light, a fact which is of particular concern in weak light imaging experiments. To further improve image contrast, recently a novel filterless illumination scheme which employs spatial filtering and structured illumination as additional filtering mechanisms has been reported (Booth et al., 2010). Although the imaging performance of this method has been demonstrated in fluorescence microscopy, its dependence on structured illumination for background removal halves the throughput of a microscope because of the introduction of grid pattern in the illumination path, and this approach falters if there is a strong nonfluorescent scattering signal from the in-focus plane.
To overcome this limitation and explore the potential application of this filterless illumination scheme, in this paper we built a full-spectrum hyperspectral fluorescence microscope (HFM), which combines three excitation/emission separation techniques: polarisation filtering, spatial filtering and spectral unmixing filtering. Compared to the previous design (Booth et al., 2010), we used a spectral unmixing filtering algorithm in background removal so that scattered light can be isolated from the fluorescent emission even when the two are co-located at the same plane. Because the full spectrum is used at both the excitation side and emission side, the difficulty of avoiding spectral overlap in filter-based imaging can be eliminated. The acquisition of high-contrast hyperspectral images of bovine pulmonary artery endothelial cells and fluorescent beads prove the feasibility of this new approach (Section 3.1 and Section 3.2). Although Booth did suggest multispectral approaches would be good partners for filterless illumination strategy (Booth et al., 2010), to the best ofourknowledge,itisthefirsttimethatthistechniquehasbeen implemented in a HFM to achieve full-range spectral imaging.
In addition, quantitative comparisons between full-spectrum imaging and filter-based imaging are implemented in the context of signal dynamic range and accuracy of measured fluorophores’ emission spectra. To show the advantage of full-spectrum HFM technique in multiplexed imaging applications, we also simulate a five-colour cell immunofluorescence imaging experiment under the two illumination schemes (Section 3.3). The results indicate that up to three times improvement in signal dynamic range can be achieved if filter-based imaging is replaced by the proposed full-spectrum imaging technique.
System description
Optical set-up
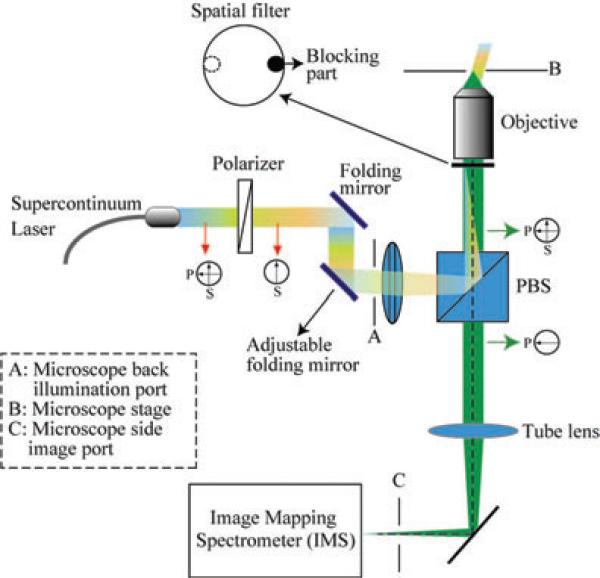
The full-spectrum HFM is implemented on a Zeiss Axio Observer microscope with epi-illumination (Fig. 1). The excitation source is a supercontinuum laser (Fianium SC400; Fianium Ltd, Southampton, UK) with broadband spectrum (410–2100 nm). The excitation laser is linearly polarised (s component) by a Glan-Thompson prism (PN: GTH5M, Thorlab, NJ, USA). A polarisation beam-splitter cube (Lambda Research Optics, CA, USA; extinction ratio >500:1) is mounted on the microscope filter turret, reflecting the excitation light towards the microscope objective. Because of the spatially coherent nature of the supercontinuum laser, the excitation light is focused onto a single point at the back pupil plane of the microscope objective, where the spatial filter is located. The focus’ in-plane position is finely adjusted by a folding mirror until it reaches the conjugate position of the spatial filter's blocking part, so that most of the specular reflectedexcitationlightcanberejected.Thefluorescencelight is collected by the microscope objective, and filtered by the beam-splitter cube with ~50% transmission throughput (s component is rejected). Note that building the proposed system requires laser safety operation procedures. Because the near infrared excitation light is blocked by a hot filter (inside the microscope), the light seen through the microscope's eyepieces is in the visible light range. In addition, the laser power is operated at 20% during alignment, a range that the cross-polarisation decreases effective irradiance as seen through eyepieces.
Fig. 1.
Optical set-up for the full-spectrum HFM. PBS, polarisation beam splitter, A: Microscope back illumination port, B: Microscope stage and C: Microscope side image port.
The full-spectrum (x, y, λ) datacubes are captured and processed by a snapshot hyperspectral imager – image mapping spectrometer (IMS; Gao et al., 2009; Kester et al., 2011). The IMS is used here because it requires no scanning to measure a (x, y, λ) datacube, a fact that maximises the throughput of a microscope in spectral imaging applications (Kester et al., 2011). The (x, y, λ) datacube that the IMS acquires is of size 350 × 350 × 48 (the first two numbers are for spatial sampling; the third number is for spectral sampling). When coupled to a microscope, the spatial resolution of the IMS is determined by the N.A. of microscope objective and the spectral sampling is ~4 nm across 200 nm spectral range.
Operation principle of full-spectrum HFM
The operating principle of the full-spectrum HFM is shown in Figure 2. At the sample plane, because the excitation is often several orders of magnitude brighter than the fluorescent emission, the fluorescent signal is buried in a high level of excitation background. To remove excitation light, a triple-step procedure is employed: first, the specular reflected excitation light is removed by the spatial filtering. Then, the scattering background is reduced by the polarisation filtering with a beam-splitter cube. Finally, a mixed 3D datacube (x, y, λ), which contains fluorescent emission and residual background is acquired by the IMS. With the known reference spectra of each component, a linear unmixing algorithm (Section 2.3) is implemented on the captured (x, y, λ) datacube, and discriminates the original datacube into two subcubes based on their spectral difference – one with the residual scattering background and the other with fluorescent emissions. Consequently, the datacube of fluorescence signals within the image have now been separated from the background light and the image contrast is improved.
Fig. 2.
Operating principle of full-spectrum HFM.
Image contrast improvement algorithm by spectral unmixing filtering
Although spatial filtering and polarisation filtering can block most specular reflected excitation light, neither of them works effectively when elastic scattering from the sample becomes a source of background signal (Mourant et al., 1998). To further improve the image contrast, we implemented a spectral unmixing filtering algorithm to isolate the elastic scattering from the fluorescent emission based on their spectral fingerprints (Ahmed et al., 2004).
Assuming there are n fluorophores in the sample, each has a reference emission spectrum and concentration distribution in the form of Ri(λ) and Ai(x, y) (i = 1, 2, 3, . . . , n), respectively. At the same time, elastically scattered light will also produce a ‘background’ spectral signature given by
| (1) |
where S(λ) is the illumination source spectrum, and Ξj (x, y, λ) is the scattering efficiency of the jth component within the sample at spatial position (x, y). For a sample whose reduced scattering coefficient can be assumed homogeneous throughout the sample, we can write
| (2) |
so that the total elastically scattered light is
| (3) |
for m different spectral scattering components. In this case, the system's spectral component matrix H can be expressed as
| (4) |
Because the object's datacube f (x, y, λ) can be experimentally measured by the IMS and theoretically equals the multiplication of the system's spectral component matrix H with the components’ concentration distribution Ai (x, y), the true concentration can be estimated as
| (5) |
in which H+ is the Moore–Penrose pseudoinverse of H, and k is the index over the number of wavelength channels K in the datacube. As long as H is well conditioned, then Âi (x, y) provides a reliable estimate for the concentration of the ith chromophore within the image. Based on this solution, we can remove the scattering from the original datacube by
| (6) |
and obtain a filtered datacube f*.
Imaging results and discussions
To demonstrate the spectral imaging performance of the proposed full-spectrum HFM technique, two experiments were designed and implemented – imaging of bovine pulmonary artery endothelial cells (Section 3.1) and imaging of six-colour fluorescent beads (Section 3.2). Quantitative comparison between full-spectrum imaging and filter-based imaging was made in the context of signal dynamic range and accuracy of measured emission spectra. In addition, to show the potential applications, a five-colour cell immunofluorescence imaging experiment was also theoretically simulated in Section 3.3.
Full-spectrum hyperspectral imaging of bovine pulmonary artery endothelial cells
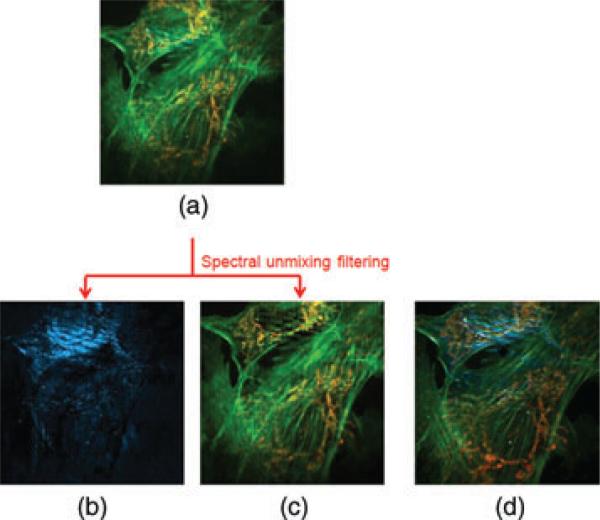
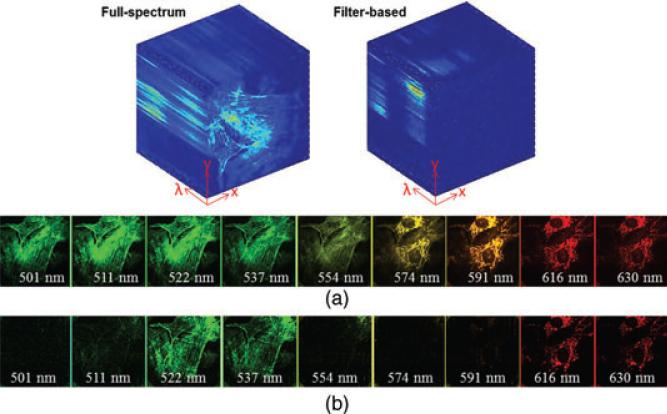
A bovine pulmonary artery endothelial cell sample was imaged by the proposed full-spectrum HFM. The cellular F-actin was labelled with dye Alexa Fluor 488 and cellular mitochondria were labelled with dye MitoTracker Red. A Zeiss Plan-Apochromat 63×/NA = 1.40 objective was used to image the sample on the microscope. The datacube was captured by the IMS with 0.5 s exposure time (Fig. 3a). This datacube, after filtering and pseudocolouring, is shown in Figure 3(c). Spectral channels of captured datacube are presented in Figure 4(a). To show the power of spectral unmixing filtering in this cellular imaging experiment, the same field of view was directly captured at the microscope's side image port by a colour camera [Infinity 2–1C (Lumeneva, Ottawa, ON, Canada); Fig. 3d]. Comparing Figure 3(c) with Figure 3(d), most scattered background light is successfully removed because of proposed solution.
Fig. 3.
Hyperspectral imaging of BPAE cells. Each image displays an 80 μm × 80 μm region of the sample (a) Color image captured by the IMS (before spectral unmixing filtering),(b) Scattering background, (c) Fluorescence and (d) Reference color image at microscope's side image port.
Fig. 4.
Acquired (x, y, λ) datacube and datacube's spectral channel images in (a) full-spectrum imaging and (b) filter-based imaging. Each spectral channel image displays an 80 μm × 80 μm region of the sample.
For comparison with filter-based imaging, the sample was also imaged under the filter-based illumination with the same exposure time. A Chroma multiband filter set 61 001 was used to separate fluorescent emission from the excitation light. The captured datacube is displayed as spectral channels in Figure 4(b). Comparing Figure 4(a) with Figure 4(b), fluorescent signals are collected in all spectral channels in the full-spectrum imaging mode; whereas in the filter-based imaging mode, several spectral channels (e.g. 501–508 nm and 554–585 nm) are dark because they are spectrally located at the excitation bands of the filter.
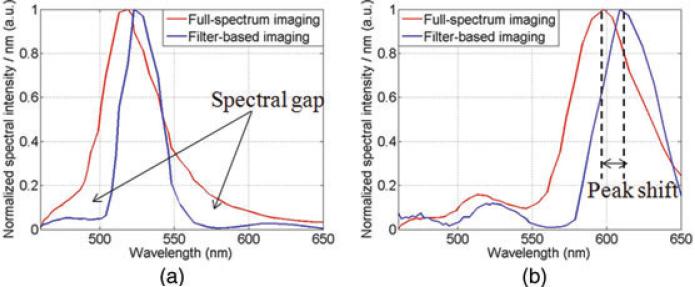
To further assess the effect of filters on the fluorophore emission spectra, the normalised fluorophore emission spectra from full-spectrum imaging and filter-based imaging at corresponding positions are also compared (Fig. 5a and b). Two major spectral changes in the filter-based spectra have been identified – termed ‘spectral gap’ and ‘peak shift’. The ‘spectral gap’ is caused by the blocking effect of the filter's excitation bands in the emission collection range, which changes the shape of the fluorophores’ original emission spectra (indicated by arrows in Fig. 5a). The ‘peak shift’ is caused by the wavelength cut-off effect of emission filter. Because of this effect, the measured emission peaks of fluorophore Alexa Fluor 488 and MitoTracker Red in filter-based imaging are shifted 4 and 15 nm, respectively from their corresponding locations under the full-spectrum illumination. The ‘spectral gap’ and ‘peak shift’ may cause problems in quantitative fluorescence imaging experiments, whose results are sensitive to the emission's profiles or absolute spectral peak position, e.g. the measurement of spectral response of fluorophore to changes in pH (Ford et al., 2001) or temperature (Lakowicz et al., 1983).
Fig. 5.
Measured fluorophore emission spectra in full-spectrum imaging and filter-based imaging. The full-spectrum and filter-based spectrum shown here have been normalised differently to match peak heights (a) Alexa Fluor 488 and (b) Mito Tracker Red.
Full-spectrum hyperspectral imaging of six-colour fluorescent beads
A prepared mixture of different colour fluorescent beads (6 μm diameter, Invitrogen (Grand Island, NY, U.S.A.) FocalCheck fluorescence microscope test slide #2) was placed on the microscope stage and was imaged by a Zeiss Epiplan-Neofluar 40×/NA = 0.75 objective. The fluorescent beads’ excitation and emission maxima are shown in Table 1.
Table 1.
The excitation and emission maxima of fluorescent beads.
| Bead label | Excitation maxima | Emission maxima |
|---|---|---|
| 1 | 503 nm | 511 nm |
| 2 | 511 nm | 524 nm |
| 3 | 541 nm | 555 nm |
| 4 | 545 nm | 565 nm |
| 5 | 578 nm | 605 nm |
| 6 | 589 nm | 613 nm |
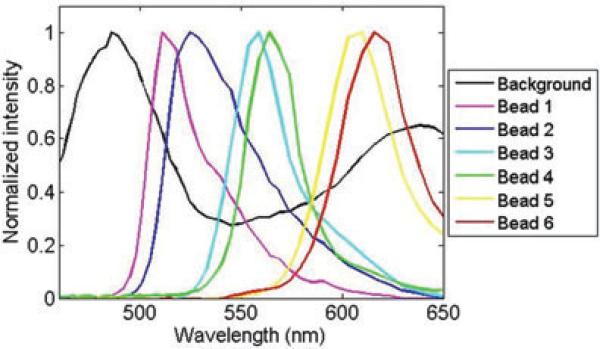
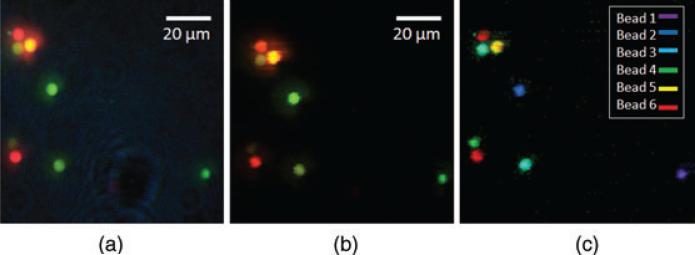
A field of view that contains all six-colour beads was imaged by the IMS under full-spectrum illumination with 0.2 s exposure time. The bead emission reference spectra were measured at the bead location, whereas the background reference spectrum was measured by averaging an area where there are no beads (Fig. 6). After spectral unmixing filtering, the measured datacube is displayed as a colour image in Figure 7(b). To show the power of spectral unmixing filtering, the same field of view was directly captured at the microscope's side image port by a colour camera (Infinity 2–1C; Fig. 7a). Comparing Figure 7(a) with Figure 7(b), the result shows that the residual background has been reduced by the proposed algorithm. In addition, a spectral feature map was also acquired as a result of spectral unmixing and shown in Figure 7(c). Note that the bead pairs 1 and 2, 3 and 4, 5 and 6, which are hardly discriminated in the colour image (Fig. 7(b)) are now visually distinguishable in the spectral feature map (Fig. 7c).
Fig. 6.
Background and beads’ fluorescent emission reference spectra.
Fig. 7.
Hyperspectral imaging of multicoluor fluorescent beads (a) Reference color image at microscope's side image port, (b) Color image captured by the ims after spectral unmixing filtering and (c) Spectral feature map(The beads are classified and pseudo-color labeled.
For quantitative comparison, the same field of view was also imaged by the IMS under filter-based illumination with the same exposure time (0.2 s). A long-pass filter set (PN: 11012v2, 515 nm LP, Chroma, VT, USA) was chosen to separate the excitation from the emission light. By using this filter configuration, because most fluorescent beads’ emissions fall in the emission filter's transmission range, the photon collection efficiency is maximised for all fluorescent beads; however, at the excitation side, the red fluorescent beads are not effectively excited because filter's excitation band does not reach the dye's peak absorption range. The polariser in the illumination optical path was removed to transmit the ‘full’ laser power to the sample as it is not needed in a filter-based set-up. In addition, because the fluorescent beads were proven to be photostable (Johnson & Spence, 2011), no photobleaching-induced intensity decrease is assumed to be observed in this controlled experiment.
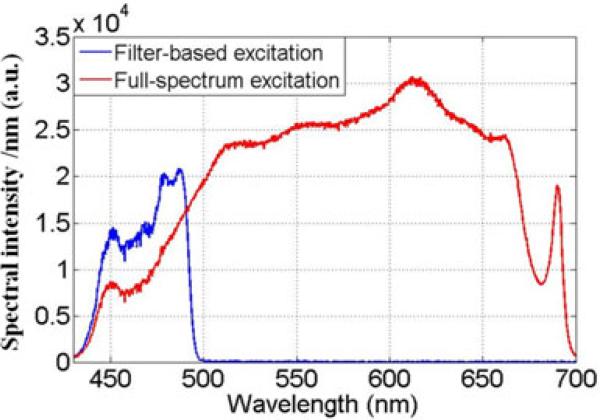
We first measured the excitation spectral intensity at the sample by placing the entrance port of an integrating sphere at the plane of the sample, and used a fibre-coupled spectrometer (Ocean Optics USB 4000; Dunedin, FL, U.S.A.) to sample the light inside the sphere. The result is shown in Figure 8. The curveforthefilter-basedmeasurementthusgivesthespectrum of the source multiplied by the transmission of the optics and the excitation filter-dichroic beam-splitter pair
| (7) |
whereas the curve for the full-spectrum measurement replaces the filter-beam splitter pair with a polarising beam splitter
| (8) |
Fig. 8.
Excitation spectra under filter-based and full-spectrum illumination.
Upuntil the cut-off wavelength, the filter-based illumination is approximately two times brighter than the full-spectrum set-up but beyond the cut-off none of the light can be used for fluorescence excitation.
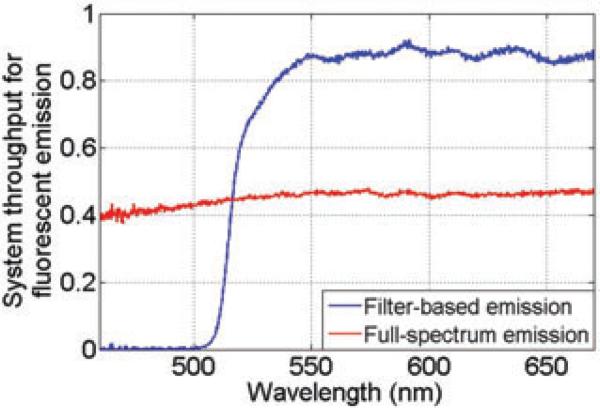
Next we measured the system collection efficiency (or throughput) for fluorescent emitted light under the two set-ups. Here we replaced the sample with a broadband light source and measure the resulting spectrum at the microscope's side image port. Dividing this by the spectrum measured directly at the source gives the throughput value η, i.e.
| (9) |
and
| (10) |
Here Temi(λ) is the emission filter transmission, and primed quantities indicate that the geometric path is different, even though the same optical component is being used, so that the transmission spectrum will be changed. The resulting throughput spectra ηfilt(λ) and ηfull(λ)are shown in Figure 9. Here we see that the full-spectrum set-up throughput is primarily limited by the polarising beam splitter. The filter-based set-up thus has higher throughput for wavelengths above the emission filter's cut-on wavelengths, but that the system cannot collect light below λcut–on.
Fig. 9.
System throughput for emission in filter-based and full-spectrum imaging.
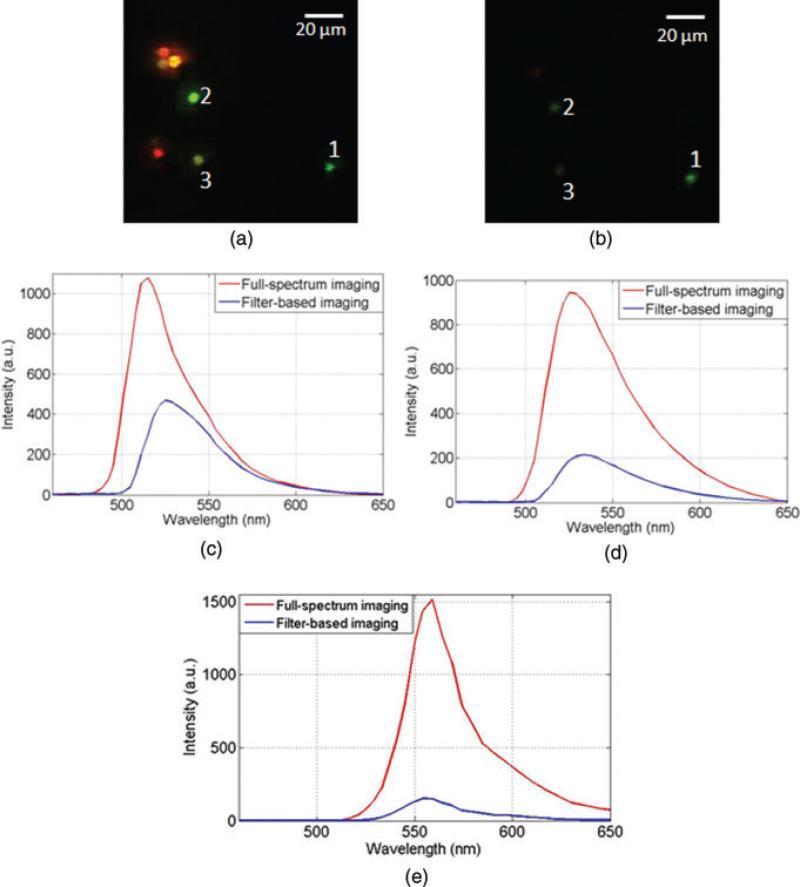
Next, the dynamic range of the IMS's captured images was compared under the two illumination schemes. Here we define the dynamic range as the average of detected signals from a fluorescent bead, divided by the average of detected signals in the image background. The background signal level was first measured in the filter-based imaging and full-spectrum imaging, respectively. The result shows that the average background signal is 6.3 counts in the full-spectrum imaging and 3.4 counts in the filter-based imaging. Thus the average background signal in the full-spectrum imaging is ~1.88 times higher than that in the filter-based imaging. Then the emission spectra of bead 1, 2 and 3 (detectable under both illumination schemes; Fig. 10a and b) were measured by averaging over the pixels at the corresponding bead location (Fig. 10c–e). The ratio of total photons that are collected in full-spectrum imaging (area under the red curve in Fig. 10) to that in filter-based imaging (area under the blue curve in Fig. 10) is calculated and shown in Table 2. By taking the background level difference into consideration, the ratio of signal dynamic range in full-spectrum imaging to that in filter-based imaging is also calculated (Table 2). These results indicate that full-spectrum imaging provides comparable dynamic range for dyes, which are optimal in a specific filter-based imaging. Although for those dyes which are not, full-spectrum imaging provides considerable improvement.
Fig. 10.
Beads’ emission spectra comparison in full-spectrum imaging and filter-based imaging (a) Full spectrum imaging, (b) Filter-based imaging, (c) Measured spectrum of bead 1, (d) Measured spectrum of bead 2 and (e) Measured spectrum of bead.
Table 2.
Comparison between full-spectrum imaging and filter-based imaging on photon collection and signal dynamic range.
| Bead label | Collected photons N1 (in counts) in full-spectrum imaging | Collected photons N2 (in counts) in filter-based imaging | Photon collection ratio (N1/N2) | Signal dynamic range ratio (full spectrum/filter based) |
|---|---|---|---|---|
| 1 | 3.23 × 10³ | 1.38 × 10³ | 2.39 | 1.27 |
| 2 | 8.94 × 10³ | 2.92 × 10³ | 3.07 | 1.63 |
| 3 | 1.27 × 10⁴ | 1.33 × 10³ | 9.50 | 5.05 |
Quantitative simulation for multiplexed imaging applications
The full-spectrum HFM technique we present here has features, which are important for researchers imaging multiple fluorescent probes at once. One of the promising applications lies in multiplexed imaging of cancer stem cells. Laboratory experiments show that targeting the stem cells with multiple contrast agents enables accurate characterisation of molecular phenotypes and cellular identification (Schieker et al., 2007; Hart & El-Deiry, 2008). To show the advantage of full-spectrum HFM in this potential application, we simulate the results for a five-colour immunofluorescence imaging experiment, which was previously experimentally implemented by filter-based imaging (Schieker et al., 2007).
For a fluorophore, under the full-spectrum illumination, the number of effective excitation photons is equal to the integral over illumination excitation spectrum Sfull(λ) multiplied by fluorophore's absorption spectrum B(λ)
| [11] |
whereas under the filter-based illumination,
| [12] |
The ratio of M = Nfull/Nfilt gives the amplitude scaling factor to compare the collected fluorophore's emission spectra under the two illumination schemes.
At the collection side, the fluorophore's emission spectra are calculated as the fluorophore's reference emission spectrum Semi multiplied by system's throughput η and amplitude scaling factor M. In full-spectrum imaging, this gives
| [13] |
and in filter-based imaging, it is
| [14] |
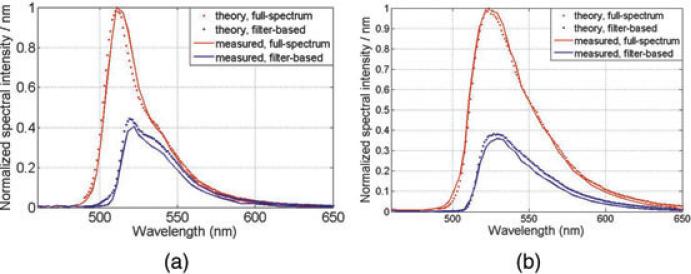
To validate these expressions, we first simulate results for the fluorescent beads 1 and 2, which have been experimentally measured in Section 3.2. Results show that simulated spectra match well with measured results (Fig. 11).
Fig. 11.
Theoretical simulated results versus experimentally measured results in fluorescent beads imaging experiment (a) Bead 1 and (b) Bead 2.
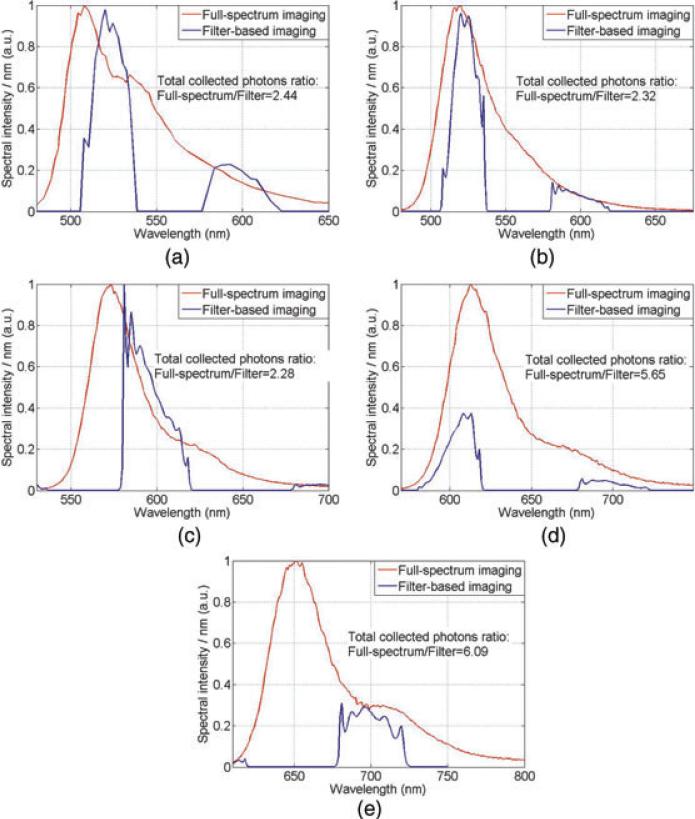
Next, a five-colour immunofluorescence hyperspectral imaging experiment is simulated under two illumination schemes. A human mesenchymal stem cell is assumed to be prepared by the same immunofluorescence method as described (Schieker et al., 2007): Cellular endoglin is labelled with dye Texas Red, FCAM-1 is labelled with dye FITC, collagen is labelled with dye Alexa 546, fibronectin is labelled with dye Cy2 and F-actin is labelled with dye Alexa 633. The triple-band emission filter (green, red and infrared, ASI) which was previously used in the experiment (Schieker et al., 2007) is also used in the simulation. The simulated results are shown in the Figure 12(a)–(e). By summing the areas under the fluorophores’ emission spectra, the numbers of total emission photons that are collected under the two illumination schemes are compared. Assuming the background level in full-spectrum imaging remains ~two times higher than that in filter-based imaging as calculated in Section 3.2, results show that comparable to up to three times improvement in signal dynamic range can be achieved by replacing the filter with the proposed full-spectrum HFM technique in this multiplexed imaging experiment. And because there is no trade-off problem in the full-spectrum imaging mode, the number of fluorescent probes that can be used in an experiment can be increased.
Fig. 12.
Simulated results for fluorophores’ emission spectra in full-spectrum and filter-based imaging (a) Cy2, (b) FITC, (c) Alexa 546, (d) TexasRed and (e) Alexa 633.
Conclusions
In this paper, we modified a filterless illumination scheme (Booth et al., 2010) and implemented in the hyperspectral fluorescence microscopy. The resulting system provides higher signal levels and higher spectral accuracy than that can be achieved by filter-based imaging in spectral imaging applications. By eliminating the excitation filters on the illumination side, we can achieve a full-spectrum excitation without a trade-off between throughput and the number of fluorescence channels excited. By replacing the dichroic mirror and emission filter with a polarising beam splitter, we can achieve a uniform throughput on the collection side, regardless of the number of fluorophores being imaged. This fact is especially important in hyperspectral imaging systems. In addition, because the full-spectrum HFM technique shows little wavelength-dependent throughput on the collection side, fluorophores’ emission spectral profile can be accurately measured – a crucial feature in quantitative fluorescence imaging experiments.
An important feature is that, unlike the filter-based approach, the full-spectrum method easily scales up for experiments requiring a large number of fluorophores. Experiments attempting to differentiate rare subpopulations of cells, for example, have been steadily increasing the number of fluorophores used to identify and characterise these rare subsets (De Rosa et al., 2001; De Rosa et al., 2003; Perfetto et al., 2004; Schieker et al., 2007; Chattopadhyay et al., 2008; Hart & El-Deiry, 2008;). Exciting this many dyes properly, and detecting their individual concentrations, can require several excitation lasers and multiple filter combinations (Schieker et al., 2007). The full-spectrum approach, however, can excite all dyes whose absorption spectra lie within its spectral band, and can collect the complete emission spectra from the entire set of fluorophores without modifying the instrument set-up described in Sections 4 and 5.
In the proposed system configuration, a snapshot hyperspectral imager IMS is used as the spectral detector. The advantage of employing IMS in full-spectrum HFM is that all wavelengths can be acquired within a single snapshot, a fact that dramatically increases system throughput (Gao et al., 2010). However, the full-spectrum HFM technique is not restricted to be used only with the IMS. It can also be integrated with other traditional scanning-based wide-field hyperspectral imagers, e.g. multiple filter cubes, liquid crystal or acoustic tuneable filters (Morris et al., 1994), which are commonly used in standard microscope set-ups. Using scanning-based hyperspectral imagers in full-spectrum HFM may reduce system's overall cost (approximate cost of hardware components of the presented IMS system is $30k–$35k) but at the risk of sacrificing system throughput, especially in dynamic imaging applications (Gao et al., 2010).
Currently, the major limitations for the proposed full-spectrum HFM technique are its need for a spatially coherent source, and requirement that the sample have weak elastic scattering, compared to its fluorescent emissions, after polarisation filtering and spatial filtering. Although the scattering components can be further isolated by the proposed datacube filtering algorithm, the effectiveness of this technique is limited by the noise in the captured spectra. In addition, for the highly scattering sample, the shot noise of scattering light is still contributing to the image signal-to-noise ratio, a fact that degrades the image quality. And as more fluorescent, scattering and absorption components are added to the system's spectral component matrix in Eq. (1), H may become ill conditioned, leading to an unstable solution for Eq. (2). In this case, the captured datacube is no longer suitable for spectral filtering. However, note that recent developments in digital micromirror device (DMD)-based illumination technology (OneLightSpectra, 2011) provide the ability to control the illumination intensities at each wavelength. If the current incoherent light source in this DMD-based illumination technology is replaced by a coherent supercontinuum laser source, an optimal illumination spectral profile that minimises the condition number of the spectral component matrix H might be produced for imaging a given sample, a fact which can benefit the proposed full-spectrum HFM technique in multiplexed imaging experiments.
Acknowledgements
This work is supported by the National Institute of Health under Grant No. R21EB009186 and R21EB011598.
References
- Ahmed S, Gilerson A, Gill A, Gross BM, Moshary F, Zhou J. Separation of fluorescence and elastic scattering from algae in seawater using polarization discrimination. Opt. Commun. 2004;235:23–30. [Google Scholar]
- Belmont AS. Visualizing chromosome dynamics with GFP. Trends Cell. Biol. 2001;11:250–257. doi: 10.1016/s0962-8924(01)02000-1. [DOI] [PubMed] [Google Scholar]
- Booth MJ, Jesacher A, Juskaitis R, Wilson T. Full spectrum filterless fluorescence microscopy. J. Microsc. 2010;237:103–109. doi: 10.1111/j.1365-2818.2009.03317.x. [DOI] [PubMed] [Google Scholar]
- Chattopadhyay PK, Hogerkorp CM, Roederer M. A chromatic explosion: the development and future of multiparameter flow cytometry. Immunology. 2008;125:441–449. doi: 10.1111/j.1365-2567.2008.02989.x. [DOI] [PMC free article] [PubMed] [Google Scholar]
- De Rosa SC, Brenchley JM, Roederer M. Beyond six colors: a new era in flow cytometry. Nat. Med. 2003;9:112–117. doi: 10.1038/nm0103-112. [DOI] [PubMed] [Google Scholar]
- De Rosa SC, Herzenberg LA, Roederer M. 11-color, 13-parameter flow cytometry: Identification of human naive T cells by phenotype, function, and T-cell receptor diversity. Nat. Med. 2001;7:245–248. doi: 10.1038/84701. [DOI] [PubMed] [Google Scholar]
- Ford BK, Volin CE, Murphy SM, Lynch RM, Descour MR. Computed tomography-based spectral imaging for fluorescence microscopy. Biophys. J. 2001;80:986–993. doi: 10.1016/S0006-3495(01)76077-8. [DOI] [PMC free article] [PubMed] [Google Scholar]
- Gao L, Kester RT, Hagen N, Tkaczyk TS. Snapshot image-mapping spectrometer for hyperspectral fluorescence microscopy. Opt. Photon News. 2010;21:50–50. doi: 10.1364/OE.18.014330. [DOI] [PMC free article] [PubMed] [Google Scholar]
- Gao L, Kester RT, Tkaczyk TS. Compact image slicing spectrometer (ISS) for hyperspectral fluorescence microscopy. Opt. Express. 2009;17:12293–12308. doi: 10.1364/oe.17.012293. [DOI] [PMC free article] [PubMed] [Google Scholar]
- Hart LS, El-Deiry WS. Invincible, but not invisible: imaging approaches toward in vivo detection of cancer stem cells. J. Clin. Oncol. 2008;26:2901–2910. doi: 10.1200/JCO.2008.16.9573. [DOI] [PubMed] [Google Scholar]
- Johnson I, Spence MTZ. Molecular Probes Handbook, A Guide to Fluorescent Probes and Labeling Technologies (Invitrogen)Life Technologies. NY, U.S.A.: 2011. [Google Scholar]
- Kester RT, Bedard N, Gao L, Tkaczyk TS. Real-time snapshot hyperspectral imaging endoscope. J. Biomed. Op.t. 2011;16:056005. doi: 10.1117/1.3574756. [DOI] [PMC free article] [PubMed] [Google Scholar]
- Lakowicz JR. Principles of Fluorescence Spectroscopy. 3rd edn. Springer; New York: 2006. [Google Scholar]
- Lakowicz JR, Bevan DR, Maliwal BP, Cherek H, Balter A. Synthesis and characterization of a fluorescence probe of the phase-transition and dynamic properties of membranes. Biochemistry. 1983;22:5714–5722. doi: 10.1021/bi00294a006. [DOI] [PMC free article] [PubMed] [Google Scholar]
- Lei M, Yao BL. Multifunctional darkfield microscopy using an axicon. J. Biomed. Opt. 2008;13:044024. doi: 10.1117/1.2960019. [DOI] [PubMed] [Google Scholar]
- Lichtman JW, Conchello JA. Fluorescence microscopy. Nat. Methods. 2005;2:910–919. doi: 10.1038/nmeth817. [DOI] [PubMed] [Google Scholar]
- McNamara G, Gupta A, Reynaert J, Coates TD, Boswell C. Spectral imaging microscopy web sites and data. Cytom Part A. 2006;69A:863–871. doi: 10.1002/cyto.a.20304. [DOI] [PubMed] [Google Scholar]
- Morris HR, Hoyt CC, Treado PJ. Imaging spectrometers for fluorescence and Raman microscopy–acoustooptic and liquid-crystal tunable filters. Appl. Spectrosc. 1994;48:857–866. [Google Scholar]
- Mourant JR, Freyer JP, Hielscher AH, Eick AA, Shen D, Johnson TM. Mechanisms of light scattering from biological cells relevant to noninvasive optical-tissue diagnostics. Appl. Opt. 1998;37:3586–3593. doi: 10.1364/ao.37.003586. [DOI] [PubMed] [Google Scholar]
- OneLightSpectra OneLight Spectra datasheet. 2011.
- Peng XJ, Song FL, Lu E, Wang YN, Zhou W, Fan JL, Gao YL. Heptamethine cyanine dyes with a large stokes shift and strong fluorescence: a paradigm for excited-state intramolecular charge transfer. J. Am. Chem. Soc. 2005;127:4170–4171. doi: 10.1021/ja043413z. [DOI] [PubMed] [Google Scholar]
- Perfetto SP, Chattopadhyay PK, Roederer M. Innovation–seventeen-colour flow cytometry: unravelling the immune system. Nat. Rev. Immunol. 2004;4:648–645. doi: 10.1038/nri1416. [DOI] [PubMed] [Google Scholar]
- Schieker M, Pautke C, Haasters F, et al. Human mesenchymal stem cells at the single-cell level: simultaneous seven-colour immunofluorescence. J. Anat. 2007;210:592–599. doi: 10.1111/j.1469-7580.2007.00716.x. [DOI] [PMC free article] [PubMed] [Google Scholar]
- Spector DL, Janicki SM, Tsukamoto T, et al. From silencing to gene expression: real-time analysis in single cells. Cell. 2004;116:683–698. doi: 10.1016/s0092-8674(04)00171-0. [DOI] [PMC free article] [PubMed] [Google Scholar]


