Abstract
Objective: Chlorine dioxide (CD) gas has been used as a fumigant in the disinfection of biosafety laboratories. In this study, some experiments were conducted to assess the inactivation of spores inoculated on six materials [stainless steel (SS), painted steel (PS), polyvinyl chlorid (PVC), polyurethane (PU), glass (GS), and cotton cloth (CC)] by CD gas. The main aims of the study were to determine the sporicidal efficacy of CD gas and the effect of prehumidification before decontamination on sporicidal efficacy. Methods: Material coupons (1.2 cm diameter of SS, PS, and PU; 1.0 cm×1.0 cm for PVC, GS, and CC) were contaminated with 10 μl of Bacillus subtilis var. niger (ATCC 9372) spore suspension in mixed organic burden and then dried in a biosafety cabinet for 12 h. The spores were recovered by soaking the coupons in 5 ml of extraction liquid for 1 h and then vortexing the liquid for 1 min. Results: The log reductions in spore numbers on inoculated test materials exposed to CD gas [0.080% (volume ratio, v/v) for 3 h] were in the range of from 1.80 to 6.64. Statistically significant differences were found in decontamination efficacies on test material coupons of SS, PS, PU, and CC between with and without a 1-h prehumidification treatment. With the extraction method, there were no statistically significant differences in the recovery ratios between the porous and non-porous materials. Conclusions: The results reported from this study could provide information for developing decontamination technology based on CD gas for targeting surface microbial contamination.
Keywords: Chlorine dioxide gas, Bacillus subtilis var. niger spores, Decontamination
1. Introduction
The cleanup of biological agents has attracted increasing attention in the world in recent years because of the occurrence of infectious disease epidemics, such as severe acute respiratory syndrome (SARS) and flu, and the anthrax spore-tainted letter incident in USA. Therefore, a highly effective disinfection technique is required to avoid these incidents and to decontaminate the indoor environment effectively. Fumigation with the advantages of high efficacy, low corrosion, large disinfection volume, and simple operation was considered to be the best decontamination method and has been widely employed to sterilize indoor biological contaminants. A number of traditional fumigants such as ethylene oxide and formaldehyde have been used to decontaminate the spores on material surfaces and in biological safety cabinets (Munro et al., 1999; Rogers et al., 2007), but their inflammability and carcinogenicity limit their use as a green decontaminant.
Chlorine dioxide (CD) is well known as an environment-friendly bactericide and has been successfully employed as a biocidal agent in water disinfection (Huang et al., 1997; Radziminski et al., 2002; Bergmann and Koparal, 2005; Zuo et al., 2006) and as a sanitizer for vegetable and fruit surfaces (Han et al., 2000; Mahmoud et al., 2007; Karabulut et al., 2009). It is capable of killing Bacillus spores (Chatuev and Peterson, 2010) and Cryptosporidium parvum oocysts (Chauret et al., 2001). It resists the formation of trihalomethanes and is nonreactive with ammonia, thereby avoiding the formation of chloramines. Jeng and Woodworth (1990) investigated and determined the sporicidal efficacy of CD gas, the relationship between fumigant concentration and exposure time, and the influence of humidity. Recently, a systematic investigation involving quantitative experiments of laboratory-scale decontamination of building material surfaces (carpet, ceiling tile, cinder block, painted wallboard, unpainted wood, and painted I-beam steel) was initiated by the United States Environmental Protection Agency (US EPA) in collaboration with the US Army, Edgewood Chemical Biological Center (US EPA, 2008). Another systematic investigation studied the log reduction in viable spore numbers by CD gas under the given technology operation parameters and environmental conditions, and with different types of building materials (Rogers et al., 2004). Further, recent work by Rastogi et al. (2009; 2010) has confirmed that viable spores on indoor building surfaces can be significantly reduced using CD gas. They tested the method by measuring spore recoveries from five porous materials and one nonporous building material. CD gas as a disinfectant has been successfully applied to decontaminate isolators (Czarneski and Lorcheim, 2005), hospitals (Luftman et al., 2006), and buildings (Wood and Martin, 2009), and is approved by the US National Sanitation Foundation International as a sterilant for the decontamination of biological safety cabinets. Although biosafety laboratories are areas in which decontamination using CD gas could be frequently applied, detailed information on the use and efficacy of such treatments applied to laboratory material surfaces is lacking.
Therefore, the main objectives of this study were to determine the sporicidal efficacy of CD gas and the effect on sporicidal efficacy of humidification before decontamination. Stainless steel (SS), painted steel (PS), polyvinyl chlorid (PVC), polyurethane (PU), glass (GS), and cotton cloth (CC) were selected as the experimental materials, based on these materials commonly found in laboratory walls, floors, interior equipment, table-boards, glassware, and cloth surfaces. Bacillus subtilis var. niger spores were chosen as the surrogate spores in this paper as Sagripanti et al. (2007) clearly established that B. subtilis, B. cereus, and B. anthracis show similar or comparable sensitivity to chemical disinfectants. CD gas was generated by the reaction of a chlorine gas-nitrogen mixture and sodium chlorite chips. This method had the advantages of producing gas of high purity with little corrosion.
2. Materials and methods
2.1. CD gas generation and measurement
Because CD gas is difficult to store, it should be generated and used on site. In this study, the CD gas was generated by passing a 2%–10% chlorine gas-nitrogen mixture (flow rate of 30 L/h; Shanghai Shenkai, China) through five columns of sodium chlorite chips (3 000 g, purity quotient of 82%–85%; Tianjin Jiangtian, China). The CD gas was introduced into a fumigation chamber (specified below) as required, to obtain and maintain the desired CD concentration. The CD concentration of the chamber was confirmed by wet chemistry analysis. The reagents and equipment used included electrodeionization (EDI) water, acetic acid (HAc, analytical reagent, Tianjin Jiangtian, China), potassium iodide (KI, analytical reagent, Tianjin Jiangtian, China), an iodine-measuring flask, and a 100-ml glass syringe. The measurement procedure was as follows: a 100-ml air sample was withdrawn from the chamber using a syringe covered with silver paper, transferred to the bottom of an iodine flask as quickly as possible, and injected into the solution (25 ml EDI water, 5 ml HAc, and 1 g KI) slowly while agitating the mixture; the flask was placed in the dark for 5 min to obtain the absorption liquid; titrating solution [0.01 mol/L sodium thiosulfate (STS)] was added to the absorption liquid until the liquid turned light-yellow; then, 5 ml of 5 g/L amylum solution was added to the absorption liquid; the titration endpoint was determined when the color of the solution changed from light-yellow to colorless; the volume of STS solution used in the titration was recorded and the concentration of CD was calculated using Eq. (1):
 , ,
|
(1) |
where, C is the CD concentration (volume ratio, v/v), V 1 is the volume of STS solution (ml), M is the molarity of the STS solution (mol/L), V 2 is the volume of measured air (ml), and V c is the ideal gas constant (L/mol) at the experimental temperature, at 101.325 kPa.
2.2. Material coupon preparation
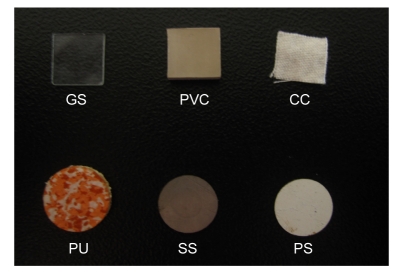
The material coupons were first cut into small pieces (1.2 cm in diameter of SS, PS, and PU; 1.0 cm×1.0 cm of PVC, GS, and CC). With the exception of CC, the coupons were boiled in a detergent solution for 20 min, rinsed with tap water, boiled again in EDI water for 10 min, and then rinsed to a neutral pH using EDI water. The coupons of SS, PS, GS, and CC were autoclaved in glass petri dishes at 121 °C for 30 min, prior to use. Because of the potential risk of damage to the materials during the autoclaving process, the PVC and PU coupons were immersed in 75% alcohol for 60 min and rinsed of the remaining alcohol using aseptic EDI water, instead of being sterilized by autoclaving. Finally, all coupons were completely dried before use (Fig. 1).
Fig. 1.
Test material coupons
All test material coupons were treated and sterilized as described prior to use. SS: stainless steel; PS: painted steel; PVC: polyvinyl chlorid; PU: polyurethane; GS: glass; CC: cotton cloth
2.3. Spore inoculation and extraction from coupons
In accordance with technical standards for disinfection, a B. subtilis var. niger spore (ATCC 9372) stock suspension was prepared with a spore population of ≥85% to 90% as confirmed by staining and microscopic analyses. A measured volume of EDI water and organic burden was added to the suspension to prepare a spore suspension with a concentration of about 4.9×10⁹ colony forming unit per ml (CFU/ml) containing 15 g/L tryptone and 5 g/L soya peptone. Each sterile coupon was inoculated with 10 μl of this suspension. The test coupons with suspension were placed on plates in a Class II biological safety cabinet for 12 h to dry before use. The contaminated coupons were used within 24 h of inoculation. All inoculated coupons were divided into three groups: prehumidified-and-decontaminated samples (i.e., coupons stored at 70%–75% relative humidity (RH) for 1 h and then exposed to CD gas), decontaminated samples (i.e., just exposed to CD gas), and controls (i.e., contaminated but not decontaminated). A blank sample (i.e., uncontaminated) was also tested.
The test coupons were transferred into 5 ml of extraction liquid (1 000 ml 0.03 mol/L phosphate buffer water, 1 g Tween-80, 10 g peptone, and 8.5 g sodium chloride) in a sterile tube. The coupons were allowed to rest in the tubes for 1 h and were then vortexed for 1 min at a speed of 1 600 r/min to dislodge spores from the coupon surface. For the control coupons, after the extraction procedure, 10-fold dilutions were performed as required, and 0.4-ml aliquots were spread twice (0.8 ml total) on two nutrient broth agar plates; these plates were incubated for 24–36 h at 37 °C. For blank and exposed test coupons containing low numbers of viable spores, 10-fold dilutions were performed for dilutions between 100, 10−1 and 10−2, and 0.4-ml aliquots of these three dilutions were spread twice (0.8 ml total) on each of two nutrient broth agar plates; these plates were incubated for 24–36 h at 37 °C. Following recording of the CFU on these plates, plates with between 10 and 300 CFU (counted from two replicate plates) were included in calculations.
2.4. Test equipment and strategy
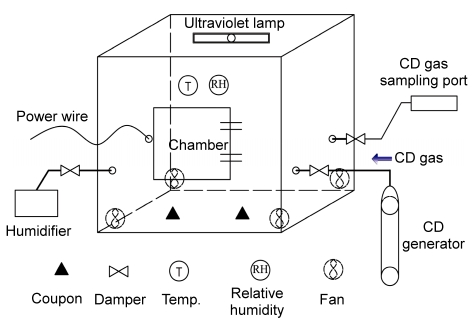
The decontamination experiments were conducted in a chamber (1.2 m wide, 1.0 m deep, and 0.83 m high) which was equipped with a door (0.4 m×0.4 m), a gas sampling port, a CD injection port, and a vapor injection port (Fig. 2). An ultraviolet lamp of 8 W was installed in the ceiling of the chamber and four computer fans (5 W, 20 m3/h) were mounted in the corner of the chamber to promote circulation and mix the fumigant. To maintain a stable RH during the exposure time, the vapor was transferred via an electrical heating humidifier outside the chamber. An instrument (LT8101) was placed inside the chamber to measure the temperature and RH.
Fig. 2.
Layout of the chamber used for the decontamination experiment
The chamber was equipped with a door, a gas sampling port, a CD injection port, and a vapor injection port. Each port had a damper to isolate the chamber. An instrument measured the temperature and RH, and mixing fans were located in the chamber during the decontamination period. Each fan was controlled by a switch placed outside the chamber
Test and non-inoculated coupon samples of all test materials were placed in 10-cm wide sterile plates, with each containing eight coupons of one material type. The experiment with the desired CD concentration was conducted in four steps. (1) Humidifying the chamber [RH up to (75±5)%] and conditioning for 30 min. (2) Pre-humidifying the test coupons [the plates containing the contaminated coupons (each with eight samples of one material) were kept at an RH of (75±5)% for 1 h] as prehumidified-and-decontaminated samples. Then another test coupons as decontaminated samples [the plates containing contaminated coupons (each with eight samples of one material)] were placed in the chamber. At the same time, plates containing control coupons (each with five coupons of one material) and blank coupons (each with three coupons of one material) were placed outside the chamber as positive and negative comparisons, respectively. (3) Generation of CD gas (CD concentration ramped to the set point in the range of from 0.080% to 0.085%) and exposure to decontamination for 3 h (during which the CD concentration was measured at intervals of 1 h). (4) Ventilation of the chamber (following sterilization, the CD gas was removed to allow the opening of the chamber door).
Five test coupons of each material were treated by following the extraction process to obtain quantitative results. Also, the three remaining decontaminated coupons of each material were transferred into a sterile 25-ml tube containing 5 ml of nutrient broth culture medium to promote spore germination for 7 d at 37 °C in an incubator for the qualitative studies.
2.5. Data collection, analysis, and estimation
The CD concentration, RH, and temperature were maintained at similar levels in each fumigation experiment. The averaged number from two replicate plates with between 10 and 300 CFU was chosen as an acceptable criterion for the evaluation of the control coupons. For the coupons exposed to CD gas, the number of viable spores on each of the two replicate plates was estimated since there were fewer viable spores on those coupons. The log value of the number of viable spores per coupon was determined for each of the five replicate coupons of each material. The average and standard deviation (SD) were computed from the replicate values through SPSS 17.0. Samples with 0 CFU on plates were treated by following the field studies method, and were assigned a value of 1 CFU in order to gain a value (Rastogi et al., 2010). The experimental results were analyzed using SPSS 17.0 to determine statistically significant differences.
3. Results and discussion
3.1. CD concentration and experimental conditions
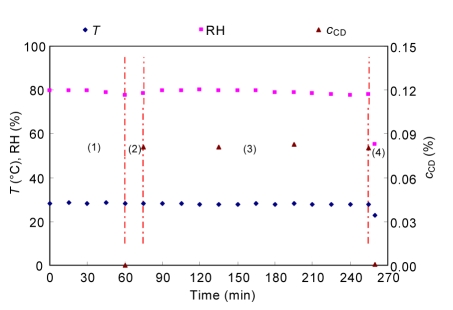
The CD concentration calculated according to Eq. (1), and the temperature and RH during the experiment are presented in Fig. 3. In the process of prehumidification, the temperature and RH were in the range of 27.0–28.5 °C and 75%–85%, respectively. The concentration of CD gas was computed as described above. The concentration of CD reached 0.080% after the CD generator had been running for 15 min and the CD concentration ranged from 0.080% to 0.083% during the 3-h exposure period in the chamber. After the ventilation system had been running for 5 min, only 0.0005% of CD gas remained inside the chamber (electrochemistry CD monitor, GD80, 0–0.01%).
Fig. 3.
Temperature (T), RH, and CD concentration (c CD, v/v) within the chamber during the experiment
This figure represents the data collected for a typical decontamination process (1. prehumidification; 2. CD generation; 3. decontamination; 4. aeration) from the start of prehumidification
3.2. Decontamination efficacy of CD on test coupons
3.2.1. Quantitative method
The decontamination efficacy of gaseous CD on the test materials was expressed in terms of the log reduction in the number of spores. The efficacy (E), or log reduction, was calculated according to Eq. (2), as used in technical reports (Rogers et al., 2004) and can be described as follows:
| E=lg(N0/N), | (2) |
where N 0 (CFU) is the mean number of viable organisms recovered from the control coupons, and N (CFU) is the number of viable organisms recovered from each coupon after decontamination.
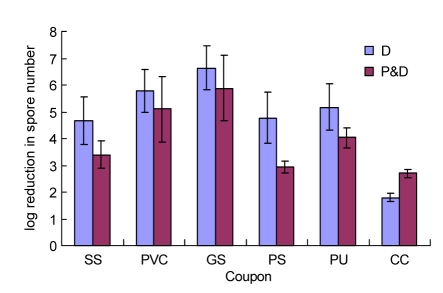
Fig. 4 summarizes the results of the experiments to assess the decontamination efficiency of CD gas (0.080% for 3 h) on test coupons contaminated with spores of B. subtilis var. niger. The spore log reduction values of coupons made of various types of materials ranged from 1.80 (CC) to 6.64 (GS) in the decontaminated experiment. A range in log reduction values (2.69 for CC to 5.88 for GS) for the different test materials was observed also in the prehumidified-and-decontaminated experiments. Further analysis of the data showed that no statistically significant differences were observed in the log reduction of spore numbers for all tested materials except for CC at a >95% confidence level in two decontaminated experiments.
Fig. 4.
Log reduction in spore numbers on test coupons in decontaminated (D) and prehumidified-and-decontaminated (P&D) experiments
The log reduction [lg(N 0/N)] was calculated by subtracting the log number (N) of viable spores on decontaminated coupons from the mean log number (N 0) of spores recovered from the control coupons. Values are expressed as mean±SD with five coupons
3.2.2. Qualitative method
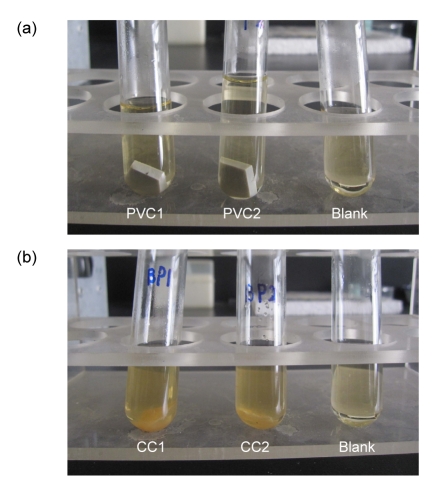
After decontamination, each coupon was transferred into sterile 25-ml tubes containing 5 ml of nutrient broth culture medium and incubated at an appropriate temperature (37 °C) for 7 d. The turbidity of the culture medium was used as an indicator of bacterial growth (Fig. 5). The results from the experiments (each material with three replicate coupons) are shown in Table 1. In the decontaminated experiments, all replicate coupons showed bacterial growth except the PVC, GS, and PU coupons, some of which were decontaminated completely. And the liquid culture medium in all tubes containing coupons in the prehumidified-and-decontaminated experiments, turned cloudy. All the blanks (i.e., tubes containing liquid nutrient broth without coupons) exhibited no growth.
Fig. 5.
Assessment of the viability of spores in liquid cultures: “no growth” and “growth”
This figures show the examples of the assessment of liquid culture of test samples incubated for 7 d after exposure to 0.080% CD gas for 3 h. (a) Spore viability was scored as “no growth” for PVC1, PVC2, and the blank samples in turn; (b) Spore viability was scored as “growth” for CC1, CC2, and the blank samples in turn
Table 1.
Liquid culture assessment of test coupons by the qualitative method after 7 d of incubation
| Test materials | Liquid culture assessment |
|
| D | P&D | |
| SS | + | + |
| PVC | +(−) | + |
| GS | +(−) | + |
| PS | + | + |
| PU | +(−) | + |
| CC | + | + |
| Blank | − | − |
D: decontaminated; P&D: prehumidified-and-decontaminated; +: all coupons showed growth; −: all coupons showed no growth; +(−): some coupons showed growth, others no growth
3.3. Recovery ratio of test material coupons
Each coupon of six test materials was contaminated with 10 μl of a stock suspension of B. subtilis var. niger spores (ATCC 9372) at concentration levels of approximately 4.9×10⁹ CFU/ml; the amount of inoculum contaminating each coupon was 4.9×10⁷ CFU. The recovery ratio (R) was calculated using Eq. (3):
| R=N0/Ni×100%, | (3) |
where N 0 (CFU) is the mean number of viable organisms recovered from the control coupons, and N i (CFU) is the amount of inoculum contaminating each test coupon.
The recovery ratios of the six test materials are listed in Table 2. The recovery ratio of viable spores detected from the control coupons ranged from 10% to 63%, depending on the type of material. More than 50% viable spores were recovered from SS, PS, and PU, and just 26% from PVC. Further analysis of the data by a paired t-test showed that at a >95% confidence level, statistically significant differences were observed in all comparisons except SS-PU, PU-CC, GS-PU, PS-PU, SS-PS, GS-PS, and SS-GS. With the extraction method, the recovery ratios showed no statistically significant differences between the porous and non-porous materials. Compared with the results of field studies (Rastogi et al., 2010), the recovery ratio for similar material (steel) varied between the different treatments of the test coupons, i.e., dipping or sonication, and different vortexing times.
Table 2.
Recovery ratios of test coupons
| Test material | Recovery ratio (%) |
| SS | 53±10 |
| PVC | 26±16 |
| GS | 48±9 |
| PS | 51±9 |
| PU | 52±7 |
| CC | 45±11 |
Data are expressed as mean±SD with ten coupons
3.4. Effects of material type on decontamination efficacy
A significant drop in the log reduction of viable spore numbers in porous material (CC) in contrast to those in nonporous materials (SS, PVC, GS, PS, PU) was observed in the fumigant experiments. Observation of the data showed no great differences in the log reduction of viable spores among different nonporous materials decontaminated by CD. And, at a >95% confidence level, statistically significant differences were obtained for the sporicidal efficacy of CD between the nonporous materials and the porous material. The penetration and embedding of spores into the fibers of porous material, which was also considered in the field study (Rogers et al., 2004), could have caused the variation in decontamination efficacy of CD between porous and nonporous materials.
3.5. Effects of prehumidification on the log reduction of viable spores on test coupons
Recent work by Jeng and Woodworth (1990) has verified that prehumidification of the bacterial indicator can increase the sporicidal efficacy of CD. In our study, for the porous material, a similar result was obtained that the log reduction in viable spores on CC in the prehumidified-and-decontaminated experiment was higher than that in the decontaminated experiment. However, prehumidification before fumigation decreased the log reduction of spores on test coupons of the nonporous test materials. Further analysis of the data showed that statistically significant differences were observed in the log reduction of spores on test materials SS, PS, PU, and CC between prehumidification and no-prehumidification experiments at a >95% confidence level. An increased surface humidification and inner humidification may have resulted in a higher probability of the CD making contact with spores and potentially increasing spore inactivation on CC, leading to a higher sporicidal efficacy of CD following the use of a prehumidification process. Further studies are required that focus on the correlative influence between the interaction of CD gas and nonporous material surfaces following prehumidification.
Footnotes
Project supported by the National Key Science and Technology Specific Project for Prevention and Treatment of Major Infectious Diseases in China (No. 2009ZX10004-709) and the National Key Technology R&D Program in the 11th Five-Year Plan of China (No. 2008BAI62B01)
References
- 1.Bergmann H, Koparal S. The formation of chlorine dioxide in the electrochemical treatment of drinking water for disinfection. Electrochim Acta. 2005;50(25-26):5218–5228. doi: 10.1016/j.electacta.2005.01.061. [DOI] [Google Scholar]
- 2.Chatuev BM, Peterson JW. Analysis of the sporicidal activity of chlorine dioxide disinfectant against Bacillus anthracis (Sterne strain) J Hosp Infect. 2010;74(2):178–183. doi: 10.1016/j.jhin.2009.09.017. [DOI] [PMC free article] [PubMed] [Google Scholar]
- 3.Chauret CP, Radziminski CZ, Lepuil M, Creason R, Andrews RC. Chlorine dioxide inactivation of Cryptosporidium parvum oocysts and bacterial spore indicators. Appl Environ Microbiol. 2001;67(7):2993–3001. doi: 10.1128/AEM.67.7.2993-3001.2001. [DOI] [PMC free article] [PubMed] [Google Scholar]
- 4.Czarneski MA, Lorcheim P. Isolator decontamination using chlorine dioxide gas. Pharm Technol. 2005;29(4):124–133. [Google Scholar]
- 5.Han Y, Sherman DM, Linton RH, Nielsen SS, Nelson PE. The effects of washing and chlorine dioxide gas on survival and attachment of Escherichia coli O157: H7 to green pepper surfaces. Food Microbiol. 2000;17(5):521–533. doi: 10.1006/fmic.2000.0343. [DOI] [Google Scholar]
- 6.Huang J, Wang L, Ren N, Ma F, Ju L. Disinfection effect of chlorine dioxide on bacteria in water. Water Res. 1997;31(3):607–613. doi: 10.1016/S0043-1354(96)00275-8. [DOI] [Google Scholar]
- 7.Jeng DK, Woodworth AG. Chlorine dioxide gas sterilization under square-wave conditions. Appl Environ Microbiol. 1990;56(2):514–519. doi: 10.1128/aem.56.2.514-519.1990. [DOI] [PMC free article] [PubMed] [Google Scholar]
- 8.Karabulut OA, Ilhan K, Arslan U, Vardar C. Evaluation of the use of chlorine dioxide by fogging for decreasing postharvest decay of fig. Postharvest Biol Technol. 2009;52(2):313–315. doi: 10.1016/j.postharvbio.2009.01.006. [DOI] [Google Scholar]
- 9.Luftman HS, Regits MA, Lorcheim P, Czarneski MA, Boyle T, Aceto H, Dallap B, Munro D, Faylor K. Chlorine dioxide gas decontamination of large animal hospital intensive and neonatal care units. Appl Biosaf. 2006;11(3):144–154. [Google Scholar]
- 10.Mahmoud BSM, Bhagat AR, Linton RH. Inactivation kinetics of inoculated Escherichia coli O157:H7, Listeria monocytogenes and Salmonella enterica on strawberries by chlorine dioxide gas. Food Microbiol. 2007;24(7-8):736–744. doi: 10.1016/j.fm.2007.03.006. [DOI] [PubMed] [Google Scholar]
- 11.Munro K, Lanser J, Flower R. A comparative study of methods to validate formaldehyde decontamination of biological safety cabinets. Appl Environ Microbiol. 1999;165(2):873–876. doi: 10.1128/aem.65.2.873-876.1999. [DOI] [PMC free article] [PubMed] [Google Scholar]
- 12.Radziminski C, Ballantyne L, Hodson J, Creason R, Andrews RC, Chauret C. Disinfection of Bacillus subtilis spores with chlorine dioxide: a bench-scale and pilot-scale study. Water Res. 2002;36(6):1629–1639. doi: 10.1016/S0043-1354(01)00355-4. [DOI] [PubMed] [Google Scholar]
- 13.Rastogi VK, Wallace L, Smith LS, Ryan SP, Martin GB. Quantitative method to determine sporicidal decontamination of building surfaces by gaseous fumigants, and issues related to laboratory-scale studies. Appl Environ Microbiol. 2009;75(11):3688–3694. doi: 10.1128/AEM.02592-08. [DOI] [PMC free article] [PubMed] [Google Scholar]
- 14.Rastogi VK, Ryan SP, Wallace L, Smith LS, Shah SS, Martin GB. Systematic evaluation of the efficacy of chlorine dioxide in decontamination of building interior surfaces contaminated with anthrax spores. Appl Environ Microbiol. 2010;76(10):3343–3351. doi: 10.1128/AEM.02668-09. [DOI] [PMC free article] [PubMed] [Google Scholar]
- 15.Rogers JV, Sabourin CL, Taylor ML, et al. Environmental Technology Verification Report. Columbus, Ohio: ETV Building Decontamination Technology Center; 2004. CDG Research Corporation Bench-Scale Chlorine Dioxide Gas: Solid Generator; p. 16.p. 30. [Google Scholar]
- 16.Rogers JV, Choi YW, Richter WR, Rudnicki DC, Joseph DW, Sabourin CLK, Taylor ML, Chang JCS. Formaldehyde gas inactivation of Bacillus anthracis, Bacillus subtilis, and Geobacillus stearothermophilus spores on indoor surface materials. J Appl Microbiol. 2007;103(4):1104–1112. doi: 10.1111/j.1365-2672.2007.03332.x. [DOI] [PubMed] [Google Scholar]
- 17.Sagripanti JL, Carrera M, Insalaco J, Ziemski M, Rogers J, Zandomeni R. Virulent spores of Bacillus anthracis and other Bacillus species deposited on solid surfaces have similar sensitivity to chemical decontaminants. J Appl Microbiol. 2007;102(1):11–21. doi: 10.1111/j.1365-2672.2006.03235.x. [DOI] [PubMed] [Google Scholar]
- 18.US Environmental Protection Agency (US EPA) Effects of Vapor-Based Decontamination Systems on Selected Building Interior Materials: Chlorine Dioxide (EPA/600/R-08/054) 2008. Available from http://nepis.epa.gov/Exe/ZyPURL.cgi?Dockey=P1000P0S.txt.
- 19.Wood JP, Martin GB. Development and field testing of a mobile chlorine dioxide generation system for the decontamination of buildings contaminated with Bacillus anthracis . J Hazard Mater. 2009;164(2-3):1460–1467. doi: 10.1016/j.jhazmat.2008.09.062. [DOI] [PubMed] [Google Scholar]
- 20.Zuo JL, Cui FY, Lin T. Study of removal effect on Mesocyclops leukarti with oxidants. J Zhejiang Univ-Sci B. 2006;7(3):171–179. doi: 10.1631/jzus.2006.B0171. [DOI] [PMC free article] [PubMed] [Google Scholar]


