

Abstract
When large asexual populations adapt, competition between simultaneously segregating mutations slows the rate of adaptation and restricts the set of mutations that eventually fix. This phenomenon of interference arises from competition between mutations of different strengths as well as competition between mutations that arise on different fitness backgrounds. Previous work has explored each of these effects in isolation, but the way they combine to influence the dynamics of adaptation remains largely unknown. Here, we describe a theoretical model to treat both aspects of interference in large populations. We calculate the rate of adaptation and the distribution of fixed mutational effects accumulated by the population. We focus particular attention on the case when the effects of beneficial mutations are exponentially distributed, as well as on a more general class of exponential-like distributions. In both cases, we show that the rate of adaptation and the influence of genetic background on the fixation of new mutants is equivalent to an effective model with a single selection coefficient and rescaled mutation rate, and we explicitly calculate these effective parameters. We find that the effective selection coefficient exactly coincides with the most common fixed mutational effect. This equivalence leads to an intuitive picture of the relative importance of different types of interference effects, which can shift dramatically as a function of the population size, mutation rate, and the underlying distribution of fitness effects.
Keywords: asexual evolution, clonal interference, multiple mutations
Evolutionary adaptation is driven by the accumulation of beneficial mutations, and yet many aspects of this process are still poorly understood. In asexual populations, this subject can be distilled into two main lines of inquiry: (i) what are the possible mutations available to the population? and (ii) which of these mutations are actually incorporated into the population, and what are the dynamics by which they fix?
The first question is essentially an empirical matter. At any given instant in time, the set of accessible beneficial mutations is likely to depend on the history of the population as well as its environment and any epistatic interactions between mutations. Nonetheless, if history and epistatic effects do not significantly affect the statistics of the available mutations, we can define a constant distribution of fitness effects ρ(s) that gives the relative probability of obtaining a mutation that increases the fitness of an individual by s.
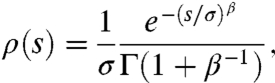
Gillespie (1) and Orr (2) have argued that there are general theoretical reasons to expect that ρ(s) should follow an exponential distribution, although more recent theoretical work has challenged the ubiquity of this claim (3). Many experimental studies are roughly consistent with this exponential prediction (4–6), although here, too, we find significant exceptions (6–10). In the present work, we maintain a relatively agnostic view toward the precise form of ρ(s), although we devote special attention to the exponential case because of its popularity in the literature.
Instead, we focus our efforts on the second of the two questions listed above. Given a particular form for ρ(s), what are the typical dynamics of fixation, and of all possible mutational effects, what is the distribution ρf(s) of those that fix? Speculation about the nature of ρf(s) dates back to the early days of population genetics, when Fisher (11) and Wright (12) fiercely debated the size of the adaptive step favored by evolution. Not only are mutations favored by ρf(s) likely to play a prominent role in adaptation, but they are often more natural to measure experimentally than the distribution of possible mutations ρ(s) (13, 14).
In small populations, or those with extremely small mutation rates, the process of adaptation is quite simple. Beneficial mutations are sufficiently rare that no more than one mutant exists in the population at any given time, and all new mutations arise on an essentially clonal background. Adaptation is therefore characterized by a series of distinct selective sweeps that occur when a new mutant rises to fixation. The probability that a new mutation fixes is simply the probability that it survives genetic drift, which is given by Haldane’s formula (15) ,
| [1] |
The distribution of fitness effects of fixed mutations immediately follows from ρf(s) ∝ π(s)ρ(s), which reduces the contribution from smaller mutations and leads to a slight increase in the mean effect of fixed mutations.
In larger populations the situation becomes more complicated, as many distinct mutations segregate simultaneously, but only one lineage can fix in the absence of recombination. Many of the mutations are therefore wasted, and a complicated process of interference arises between the mutations competing for fixation. This process is also found to a degree in sexual populations (the Hill–Robertson effect) if recombination cannot act quickly enough to place all of the competing mutations on the same genetic background (16).
Interference between competing mutations comes in two basic flavors. The first arises from competition between mutations with different fitness effects. A mutation A that has survived drift and would otherwise rise to fixation can be outcompeted by a second, stronger mutation B that arises before A has fixed. The second effect stems from competition between mutations with different genetic backgrounds. For instance, the outcompeted mutation A could be saved by a third mutation C that arises on the background of the first, such that the fitness of the double mutant AC exceeds that of B alone, allowing A to rise to fixation.
The first of these effects is analyzed in the theory of clonal interference (17, 18), which incorporates a distribution of fitness effects under the assumption that multiple mutants* are negligible. In this theory, new mutations are eventually fixed in the population only if they are not outcompeted by a larger mutation in the time required for them to fix, which leads to a relation between the shape of ρ(s) and the rate of adaptation.
The triumph of clonal interference theory was the prediction (and subsequent experimental verification; refs. 19–21) that in large populations, the rate of adaptation increases sublinearly with the size of the population. However, it was later shown that the quantitative predictions for the rate of adaptation and the distribution of fixed mutational effects disagree with the results of simulations (22). Crucially, clonal interference theory underestimates the contribution from smaller-effect mutations, which is likely due to the neglect of multiple mutants.
Models that explicitly treat these multiple-mutation dynamics have also been analyzed in recent years (23–28) (see ref. 29 for a review), although these typically operate under the simplifying assumption that all mutations have the same effect. The primary finding of these studies is that the population forms a traveling fitness wave that moves toward higher fitness with a constant average rate v and shape f(x). New mutations are eventually fixed in the population only if they occur in the best genetic backgrounds at the high-fitness nose of f(x), which leads to a relation between the shape of the profile and the rate of adaptation.
By neglecting the distribution of fitness effects ρ(s), multiple mutation models are able to predict the distribution of backgrounds f(x). Conversely, clonal interference treats a distribution of fitness effects at the cost of neglecting the distribution of backgrounds. Of course, by explicitly ignoring the distribution of fitness effects, multiple mutation models lose any ability to make predictions about ρf(s).
Experimental evidence suggests that both clonal interference and multiple mutations play a role in laboratory populations (30–33) (see ref. 34 for a review), their relative strengths determined by the shape of ρ(s) and other population parameters. These and other results suggest that interference effects are likely to be highly relevant for many microbial and viral populations occurring in nature. Although previous theoretical work has shed light on this question through simulation studies (22, 35), infinite population models (36), and driver-mutation approximations (37), no comprehensive theory has yet emerged that accounts for both clonal interference and multiple mutation effects.
In this article, we present an analytical treatment of a distribution of fitness effects (clonal interference) as well as a distribution of backgrounds (multiple mutations) in an adapting asexual population. We leverage an approximate mathematical framework originally devised for the study of adaptation in sexual populations (38), which allows us to obtain predictions for the rate of adaptation as well as the distribution of fixed mutations in large asexual populations where mutation is weak compared to the strength of selection. We give explicit analytical solutions in the case of an exponential distribution of fitness effects, as well as a more general class of fitness distributions considered in earlier studies (22, 25, 37). We validate our results with computer simulations for a range of parameter values thought to be relevant for laboratory populations of yeast and many bacteria (30), and we show that virtually identical predictions can be obtained from exact tunable constraint models (28).
Our results confirm the intuition that the distribution of fixed mutations is strongly peaked around a single characteristic size, which depends on the underlying distribution of fitness effects as well as the population size and the mutation rate (22, 25, 39). We show that adaptation under a full distribution of fitness effects is equivalent to a second, effective theory with a single selection coefficient and rescaled mutation rate. We calculate these effective parameters, finding that the effective selection coefficient must be identified with the peak of ρf(s). In this way, the complex interplay between clonal interference and multiple mutations works to simplify the distribution of relevant mutations. However, these relevant mutations change with ρ(s), N, and Ub. This implicit dependence alters the overall scaling of the adaptation rate with population size and mutation rate, and leads to dramatic differences in the dominant mode of interference in different situations.
Analysis
We consider a population of N haploid individuals that acquire new beneficial mutations at total rate Ub. We assume that these mutations occur over a large number of loci, each with relatively small contributions to the total fitness, so that a mutation of effect s arising in an individual with (log) fitness X increases its fitness to X + s. Furthermore, we assume that the number of loci is sufficiently large, and epistasis sufficiently weak, that the set of available mutations can be approximated by a continuous distribution of fitness effects ρ(s) that remains constant throughout the relevant time interval. We explicitly ignore transient behavior early in the adaptive process (25, 40, 41) as well as long-term changes in selection pressure as the population adapts (37, 42, 43). These remain important topics for future work. In addition, we follow previous studies (22, 24, 25) and ignore the effect of deleterious mutations, because we focus on a regime where beneficial mutations are common and deleterious mutations are expected to have a negligible effect on the dynamics of adaptation.
Our general framework is valid for a wide range of ρ(s), but for the sake of concreteness we obtain explicit formulae for two specific distributions. The first of these is the exponential distribution discussed in the introduction,
 |
[2] |
which has assumed the role of a null model because of its broad theoretical and experimental support. However, the ubiquity of the exponential model is by no means certain, and notable exceptions to this hypothesis have arisen in both theoretical and experimental contexts. We therefore also consider more general ρ(s); as a concrete example, we describe results for a class of exponential-like distributions (22, 25, 37)
 |
[3] |
parameterized by a steepness parameter β. For large β, the sharp cutoff at s = σ is particularly interesting because we will see that it leads to qualitatively different interference effects compared to an exponential ρ(s) for similar N, Ub, and σ.
Bulk Behavior.
In sufficiently large populations, it is often possible to separate the population-wide dynamics from the fate of any particular mutant (29). In this way, the distribution of fitnesses in the population can be highly predictable even though its exact genealogy is not. Previous studies have shown that large adapting populations develop into a traveling fitness wave that moves with a constant average rate v and shape f(x), where 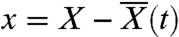 measures the relative fitness of a given individual (refs. 23–28, 38, 40, 41) (Fig. 1). In principle, the shape of the wave can be rigorously determined using various methods of traveling-wave theory, such as the stochastic threshold approximation (24, 26, 40, 41), tunable constraint models (28), or stochastic fitness-class calculations (25, 27), but these methods are often difficult to apply for all but the simplest models of adaptation.
Fig. 1.

A schematic illustration of the process of adaptation. The Gaussian fitness profile f(x) (i.e., the distribution of backgrounds) moves at a constant rate v. The fixation probability w(x) increases rapidly with x until it reaches a thin boundary layer near x = xc, after which it transitions to the standard Haldane result.
For our purposes, it will be sufficient to employ a rough approximation to the true shape of the fitness profile. Previous work has shown that in sufficiently large populations with weak mutation (Ub ≪ σ, SI Appendix), f(x) approaches a Gaussian form whose variance is equal to the rate of adaptation v (25, 40). In accordance with the earlier models (38), we therefore make the approximation that
 |
[4] |
Additional deviations from Eq. 4 can arise from fluctuations in the high-fitness nose of the distribution, correlated fluctuations in the mean fitness, higher mutation rates, deleterious mutations, etc., but we expect these features to play a limited role in the regimes considered here. Ultimately, this intuition can only be justified a posteriori by the generally good agreement between our analytical results and computer simulations discussed below. A more thorough discussion of the shape of the fitness profile is given in SI Appendix.
The Fate of Individual Lineages.
From the perspective of a single lineage, competition with the rest of the population occurs only through the dynamics of the mean fitness  , which increases at a constant rate v in the steady state. As long as the size of the lineage remains small compared to the size of the population, we can model its behavior with a continuous-time branching process with birth rate
 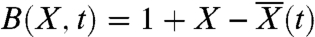 , death rate D = 1, and mutation rate Ubρ(s) to fitness X + s.
The central quantity of interest in such models is the nonextinction probability w(X,t) of a lineage founded by a single individual with fitness X at time t. Of course, any lineage that rises to fixation will eventually constitute a large fraction of the population, and our branching-process assumption starts to break down because of nonlinear effects. We assume that all lineages that avoid extinction and attain such a size are guaranteed to fix, so that we can equate w(X,t) with the fixation probability of a lineage. We note that to escape the constant increase in mean fitness as the population adapts, the descendants of this individual will have to repeatedly mutate to higher fitnesses. This process is very similar to the recombinant background switching discussed by Neher et al. (38), and to the mutational surfing of genes in spatially expanding populations (44, 45).
From standard applications of branching process theory (SI Appendix), we can show that the fixation probability is governed by the equation
 |
[5] |
where we have used the fact that the fixation probability depends on X and t only through the relative fitness  , which satisfies x ≪ 1 in the region of interest. For a given value of v, which is calculated self-consistently below, this equation uniquely determines the fixation probability of a new mutation for a given choice of Ub and ρ(s).
Self-Consistency Condition.
The individual and bulk descriptions are connected by the fact that the population ultimately adapts by producing new successful mutations. If a single mutation of effect s occurs somewhere in the population, the probability that it fixes can be obtained from w(x) by averaging over the distribution of backgrounds in which it could have occurred. This average yields a generalized version of Haldane’s π(s) in the presence of interference,
 |
[6] |
Consistency then requires that
 |
[7] |
In other words, the rate of adaptation is equal to the total rate at which new mutations fix multiplied by the size of their effect. The distribution of fixed mutations is once again obtained from the relation
| [8] |
When taken together, Eqs. 4, 5, and 7 fully determine the dynamics of adaptation and the distribution of fixed mutations for any combination of N, Ub, and ρ(s). We examine the solutions to these equations in the following section. In SI Appendix, we show how this calculation can be generalized to obtain the distribution of backgrounds in which successful mutations arise, in addition to ρf(s). We also show that nearly identical versions of Eqs. 4, 5, and 7 can be obtained by extending the tunable constraint framework introduced in ref. 28. This alternative formation gives a slightly more rigorous route to some of our key equations, and it suggests that the dynamics of adaptation are relatively insensitive to the particular details of our model in the large populations we consider here.
Results
Fixation Probability and the Rate of Adaptation.
In the limit of large population size and weak mutation, the solution to Eq. 5 has a sharp transition at a characteristic fitness xc, above which it will approach the linear Haldane formula for fixation in the absence of interference (Fig. 1). As shown in SI Appendix, we can approximate the fixation probability as
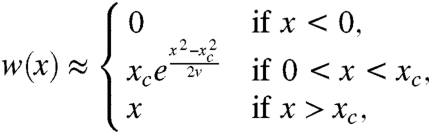 |
[9] |
where xc is determined by the condition
 |
[10] |
Below this transition point, Eq. 9 shows that the fixation probability is proportional to the time-integral of the deterministic lineage size, ∫n(t)dt, which represents the total number of mutational opportunities for the lineage before it goes extinct. Intuitively then, fixation below xc is dominated by the probability that the lineage generates a second mutant, whereas fixation above xc is dominated by the probability that the lineage survives drift. The transition point, xc, whereas originally arising from a purely mathematical analysis of Eq. 5, has an intuitive interpretation as the boundary above which interference does not limit the fixation of new mutants.
We can calculate the marginal fixation probability π(s), and hence the distribution of fixed mutations ρf(s), by substituting our approximate form for w(x) into Eq. 6 and integrating. We find
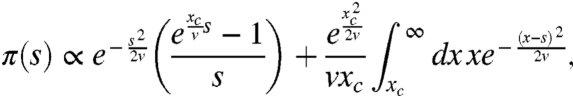 |
[11] |
where the normalization is determined by the condition π(0) ≈ 1/N.
The fixation probability π(s) controls the bias of those mutations that actually fix, because ρf(s) follows immediately from ρf(s) ∝ π(s)ρ(s). We note here that in contrast to the original Haldane formula, π(s) displays a regime of effective neutrality for s < v/xc, where new mutations fix with a probability approximately equal to 1/N independent of their effect. This result agrees with the earlier findings in ref. 37. Above this threshold, the fixation probability rapidly increases before reattaining the Haldane limit for s > xc. The position of these transitional points relative to the original distribution ρ(s) can play a large role in the shape of the distribution of fixed mutations, as we shall see below.
The approximate expressions for w(x) and π(s) depend on the rate of adaptation v, which is self-consistently obtained by substituting Eq. 11 into the consistency condition Eq. 7. This substitution yields a second relation between xc and v for a given distribution ρ(s). Explicit calculations for the two forms of ρ(s) in Eqs. 2 and 3 are carried out in SI Appendix, and we summarize the main results below. In Figs. 2–4, we compare these analytical predictions to forward-time Wright–Fisher simulations.
Fig. 2.

The rate of adaptation, v, as a function of the population size N (Left) and the beneficial mutation rate Ub (Right) for the exponential (β = 1) and β = 10 distributions. Other parameters are N = 107, Ub = 10-5, and σ = 0.01. Symbols denote the results of forward-time Wright–Fisher simulations, and the solid lines are obtained by solving Eqs. 13 and 14 for β = 1 and Eqs. 18 and 19 for β = 10. For comparison, the predictions from clonal interference theory are plotted as dashed lines.
Fig. 3.

The distribution of fitness effects of fixed mutations, ρf(s), for the exponential (β = 1) (Top) and β = 10 (Bottom) distributions as measured in forward-time simulations. Other parameters are N = 107, Ub = 10-5, and σ = 0.01. Our theoretical predictions are shown as solid red lines. For comparison, we also plot the predictions from clonal interference theory (blue dashed lines) as well as the distribution of mutational effects that would fix in the absence of interference (red dashed lines). All distributions are normalized by the total number of mutations that occur during the simulation.
Fig. 4.

The mean fitness effect of a fixed mutation as a function of the population size N (Left) and beneficial mutation rate Ub (Right) for the exponential (β = 1) and β = 10 distributions. Symbols denote the results of forward-time simulations for the parameters given in Fig. 2. Our theoretical predictions are shown as solid lines, and the predictions from clonal interference theory (dashed lines) are shown for comparison.
Exponential Distribution.
In the case where the distribution of fitness effects is exponential, as in Eq. 2, we find that the integrals over the effect size s are sharply peaked around a characteristic value
 |
[12] |
and Eqs. 10 and 7 reduce to the coupled equations
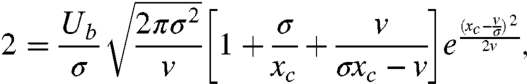 |
[13] |
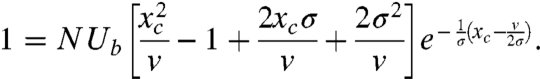 |
[14] |
This system of transcendental equations must be solved numerically to obtain v and xc, but we can obtain approximate analytical expressions for these quantities in two regimes of interest.
If the dominant effect size s∗ ≈ xc, then successful mutations originating on backgrounds far from the nose of the fitness distribution are quite common. In this regime, an iterative solution of Eqs. 13 and 14 yields the approximate solution
 |
[15] |
which self-consistently holds for the intermediate NUb regime log(NUb) ≪ 2 log(σ/Ub). For extremely large NUb, this condition will cease to be valid, and most successful mutations will originate close to the nose (s∗ ≪ xc). In this regime, we find a different approximate expression for the adaptation rate
| [16] |
General Distributions.
More generally, the integrands in Eqs. 10 and 7 will be peaked around a characteristic s∗ determined by
 |
[17] |
If the integrals are dominated by the contribution near this peak, we can proceed in a very similar fashion to the calculation above, and we find that
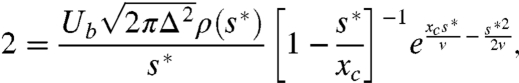 |
[18] |
 |
[19] |
where  is the width of the peak. Because s∗ is equivalent to the most likely fixed mutational effect (SI Appendix), we expect this approximation to hold whenever ρf(s) is sufficiently peaked around a characteristic effect size. This requirement is typically satisfied for most unimodal distributions with an exponentially bounded tail (39), and in particular, for the short-tailed distributions in Eq. 3. For β≫1, the characteristic effect size is
 |
[20] |
and the rate of adaptation is given by the approximate form
 |
[21] |
which asymptotically scales as
 |
[22] |
Note the difference in scaling compared to the exponential distribution in Eq. 15. In this case, the scaling of v bears a much closer resemblance to earlier multiple mutation models with a single mutational effect. We explore this connection in greater detail below.
Discussion
When large populations acquire beneficial mutations, it is well-known that interference between competing lineages slows the rate of adaptation and leads to a distribution of genetic backgrounds at any given time. By explicitly accounting for this distribution of backgrounds, our analysis predicts both the rate of adaptation and the distribution of fitness effects of mutations that fix during the course of evolution, thereby offering a unified theory of interference in asexual populations.
Our analysis rests on the assumption that in large populations, the bulk dynamics of the distribution of backgrounds decouples from the fate of any particular lineage. When mutation is sufficiently weak compared to the strength of selection, we have argued that the bulk is well-approximated by a traveling fitness wave with a Gaussian profile, and the fixation probability of a given lineage depends on Ubρ(s) only through the rate of adaptation v and the transition point xc. We observe excellent agreement between our predictions and the results of forward-time, Wright–Fisher simulations (Figs. 2–4, and our approach is further corroborated by the fact that the same mathematical structure can be deduced from an exact stochastic model of traveling waves (28) (SI Appendix). A virtually identical form for the fixation probability w(x) arises in the study of large sexual populations (38), which suggests some sense of universality in that the dynamics of adaptation are primarily constrained by the shape and propagation of the fitness wave, rather than the exact mechanism by which lineages jump to higher fitnesses. The crucial influence of background variation on the fate of individual mutations has also been observed in laboratory populations (33), and is conjectured to hold in biparental sexual organisms as well (46).
The idea that some essential features of adaptation are insensitive to ρ(s) after controlling for the speed and width of f(x) is not unique. Indeed, this intuition plays a crucial role in justifying the use of multiple mutation theories to model adaptation in experimental populations (30, 39). As long as the distribution ρ(s) falls off sufficiently quickly for large s, the dynamics of adaptation and the distribution of those mutations that fix will tend to be dominated by mutations of some characteristic size  . Those mutations with
  will typically be outcompeted by mutations of larger effect, whereas mutations with
  are too rare to occur before a fitter multiple mutant establishes. Thus, the dynamics of adaptation can be equivalently described by a multiple mutations model with a single, effective selection coefficient and mutation rate despite a full underlying distribution ρ(s).
Our results confirm this general intuition [although in some cases the dispersion in ρf(s) can be rather large, Fig. 3A], and our analytical description allows us to make this statement quantitatively precise. Carrying out the calculations above for the single-s distribution Ubρ(s) = Ueffδ(s - seff) (SI Appendix), we look for effective parameters seff and Ueff such that our approximate solutions for v and w(x) match those for the original distribution. As long as ρf(s) is strongly peaked around a typical effect size, Eqs. 18 and 19 imply that this single-s equivalence holds if and only if
| [23] |
where s∗ and Δ are given above. In other words, the effective selection coefficient exactly coincides with the most probable fixed effect, and the effective mutation rate is scaled by the probability of observing that mutation under the original distribution ρ(s). By construction, the predictions of our theory for this single-s model with effective parameters seff and Ueff exactly match the predictions of our theory for the full ρ(s). We note, however, that because the effective parameters themselves depend on N, Ub, and ρ(s), the dependence of v on population size and mutation rate will differ from a true single-s theory, which could be used to distinguish the underlying distribution of fitness effects experimentally.
Although the mapping defined by Eq. 23 is always valid, it can be instructive to consider an even simpler single-s mapping in the special case that xc ≈ s∗, which occurs for the exponential distribution in the intermediate-NUb regime. In this case, a more intuitive understanding of the dynamics can be obtained by mapping to a selective sweeps model where the rate of adaptation is given by the well-known formula  . We again find that seff and Ueff are given by Eq. 23 if we define an effective population size
 |
[24] |
which accounts for the fact that mutations typically arise from a background with fitness x ≈ xc - s∗ rather than from the wild-type fitness (SI Appendix).
These different effective models reflect dramatic differences in the typical dynamics of fixation. For the large-NUb exponential regime and the β≫1 distributions, successful mutations typically arise on backgrounds at the nose of the wave and mutate to fitnesses near the interference threshold xc. Multiple mutations of size s∗ are therefore essential for fixation, and the background in which each mutant arises plays a central role in its ultimate chance of fixation. On the other hand, for the intermediate-NUb exponential regime, typical mutations arise from the bulk of the fitness profile and mutate to fitnesses near xc. Thus, the background on which they arise is less important; fixations are dominated by a single driving mutation which can leapfrog all other variation in the population. However, this behavior differs from the standard selective sweeps or clonal interference picture in that new driving mutations typically arise before the previous mutation has fixed.
Recent work by Schiffels et al. (37) has leveraged this driving mutation approximation to study adaptation under an exponential ρ(s), similar to the case considered here. By adding passenger-mutation corrections, they also correctly predict the rate of adaptation and the distribution of fixed mutations observed in Fig. 3A, thereby offering further evidence for our interpretation above. This work provides an accurate and interesting complement to our analysis in the intermediate-NUb regime where single driving mutations dominate the dynamics. However, our results show that this approximation breaks down for larger NUb, and also does not hold for more general distributions (e.g., β≫1) when ρ(s) decreases much faster than exponentially. In these cases, we obtain a qualitatively different picture of interference in which multiple driving mutations play a dominant role. By successfully accounting for both extremes, the present framework (and the corresponding single-s mappings) can help predict the degree to which we might expect more clonal interference or multiple mutation effects for a given set of parameters.
This discussion also suggests possible experimental tests of our theory using experimental evolution. For a given distribution of fitness effects Ubρ(s), our framework provides concrete predictions for the most accessible experimental quantities: the rate of adaptation and the distribution of fixed mutational effects. By measuring how these quantities vary with N, we can directly probe our theoretical predictions. Combining these results with measurements of the fitness variation maintained by a population (30) and with direct genomic information from adapted lineages to measure the distribution of backgrounds on which successful mutations arise (47), we can further test our predicted picture of the typical mode of adaptation, and observe how this mode changes as a function of population size.
Up to this point, we have focused exclusively on beneficial mutations. This focus was justified on the basis of earlier studies (22, 24, 25) that find that deleterious mutations have a negligible effect on the dynamics of adaptation when beneficial mutations are common. Nevertheless, because the vast majority of available mutations in real populations are likely to be neutral or deleterious, it would be desirable to extend our theory to explicitly account for these mutations. If we can safely ignore the effects of deleterious mutations on the dynamics of adaptation, their fixation probabilities follow the form of π(s) calculated above, which rapidly decays for s < 0. However, as the ratio of deleterious to beneficial mutations increases, we eventually expect these mutations to alter the dynamics of adaptation itself, which will in turn effect the distribution of fixed mutations. We aim to explore this dependence in detail in a future paper.
Supplementary Material
Acknowledgments.
We thank John M. Coffin, Richard A. Neher, and Boris I. Shraiman for comments and useful discussions. This work was supported in part by a National Science Foundation Graduate Research Fellowship (B.H.G.), the Max Planck Society (O.H.), and the James S. Mcdonnell Foundation and the Harvard Milton Fund (M.M.D). I.M.R. was supported by National Institute of Health Grants R01AI 063926 (to I.M.R.) and R37CA 089441 (to John M. Coffin). D.J.B. was supported by National Institutes of Health Grant R01GM 086793 (to Boris I. Shraiman). Simulations in this paper were performed on the Odyssey cluster supported by the Research Computing Group at Harvard University.
Footnotes
The authors declare no conflict of interest.
This article is a PNAS Direct Submission.
See Commentary on page 4719.
This article contains supporting information online at www.pnas.org/lookup/suppl/doi:10.1073/pnas.1119910109/-/DCSupplemental.
*Previous authors occasionally use the term multiple mutants to denote those individuals that receive more than one mutation in a single generation. Here, we use the term more generally to denote lineages that receive more than one mutation before fixation. In this case, multiple mutants can be common even when multiple mutations per generation are negligible.
References
- 1.Gillespie J. Molecular evolution over the mutational landscape. Evolution. 1984;38:1116–1129. doi: 10.1111/j.1558-5646.1984.tb00380.x. [DOI] [PubMed] [Google Scholar]
- 2.Orr H. The distribution of fitness effects among beneficial mutations. Genetics. 2003;163:1519–1526. doi: 10.1093/genetics/163.4.1519. [DOI] [PMC free article] [PubMed] [Google Scholar]
- 3.Joyce P, Rokyta D, Beisel C, Orr H. A general extreme value theory model for the adaptation of DNA sequences under strong selection and weak mutation. Genetics. 2008;180:1627–1643. doi: 10.1534/genetics.108.088716. [DOI] [PMC free article] [PubMed] [Google Scholar]
- 4.Imhof M, Schlötterer C. Fitness effects of advantageous mutations in evolving Escherichia coli populations. Proc Natl Acad Sci USA. 2001;98:1113–1117. doi: 10.1073/pnas.98.3.1113. [DOI] [PMC free article] [PubMed] [Google Scholar]
- 5.Kassen R, Bataillon T. Distribution of fitness effects among beneficial mutations before selection in experimental populations of bacteria. Nat Genet. 2006;38:484–488. doi: 10.1038/ng1751. [DOI] [PubMed] [Google Scholar]
- 6.MacLean R, Buckling A. The distribution of fitness effects of beneficial mutations in Pseudomonas aeruginosa. PLoS Genet. 2009;5 doi: 10.1371/journal.pgen.1000406. e1000406. [DOI] [PMC free article] [PubMed] [Google Scholar]
- 7.Sanjuán R, Moya A, Elena SF. The distribution of fitness effects caused by single-nucleotide substitutions in an RNA virus. Proc Natl Acad Sci USA. 2004;101:8396–8401. doi: 10.1073/pnas.0400146101. [DOI] [PMC free article] [PubMed] [Google Scholar]
- 8.Cowperthwaite MC, Bull J, Meyers LA. Distributions of beneficial fitness effects in RNA. Genetics. 2005;170:1449–1457. doi: 10.1534/genetics.104.039248. [DOI] [PMC free article] [PubMed] [Google Scholar]
- 9.Barrett RD, MacLean RC, Bell G. Mutations of intermediate effect are responsible for adaptation in evolving Pseudomonas fluorescens populations. Biol Lett. 2006;2:236–238. doi: 10.1098/rsbl.2006.0439. [DOI] [PMC free article] [PubMed] [Google Scholar]
- 10.Rokyta DR, et al. Beneficial fitness effects are not exponential for two viruses. J Mol Evol. 2008;67:368–376. doi: 10.1007/s00239-008-9153-x. [DOI] [PMC free article] [PubMed] [Google Scholar]
- 11.Fisher RA. The Genetical Theory of Natural Selection. Oxford: Oxford Univ Press; 1930. Chap 4. [Google Scholar]
- 12.Wright S. Evolution in mendelian populations. Genetics. 1931;16:97–159. doi: 10.1093/genetics/16.2.97. [DOI] [PMC free article] [PubMed] [Google Scholar]
- 13.Rozen DE, de Visser JA, Gerrish PJ. Fitness effects of beneficial mutations in microbial populations. Curr Biol. 2002;12:1040–1045. doi: 10.1016/s0960-9822(02)00896-5. [DOI] [PubMed] [Google Scholar]
- 14.Parfeito L, Fernandes L, Mota C, Gordo I. Adaptive mutations in bacteria: High rate and small effects. Science. 2007;317:813. doi: 10.1126/science.1142284. [DOI] [PubMed] [Google Scholar]
- 15.Haldane J. The mathematical theory of natural and artificial selection, part v: Selection and mutation. Proc Cambridge Philos Soc. 1927;23:828–844. [Google Scholar]
- 16.Hill WG, Robertson A. Effect of linkage on limits to artificial selection. Genet Res. 1966;8:269–294. [PubMed] [Google Scholar]
- 17.Gerrish P, Lenski R. The fate of competing beneficial mutations in an asexual population. Genetica. 1998;102–103:127–144. [PubMed] [Google Scholar]
- 18.Wilke CO. The speed of adaptation in large asexual populations. Genetics. 2004;167:2045–2053. doi: 10.1534/genetics.104.027136. [DOI] [PMC free article] [PubMed] [Google Scholar]
- 19.Miralles R, Gerrish PJ, Moya A, Elena SF. Clonal interference and the evolution of RNA viruses. Science. 1999;285:1745–1747. doi: 10.1126/science.285.5434.1745. [DOI] [PubMed] [Google Scholar]
- 20.de Visser JAGM, Zeyl CW, Gerrish PJ, Blanchard JL, Lenski RE. Diminishing returns from mutation supply rate in asexual populations. Science. 1999;283:404–406. doi: 10.1126/science.283.5400.404. [DOI] [PubMed] [Google Scholar]
- 21.Colegrave N. Sex releases the speed limit on evolution. Nature. 2002;420:664–666. doi: 10.1038/nature01191. [DOI] [PubMed] [Google Scholar]
- 22.Fogle CA, Nagle JL, Desai MM. Clonal interference, multiple mutations and adaptation in large asexual populations. Genetics. 2008;180:2163–2173. doi: 10.1534/genetics.108.090019. [DOI] [PMC free article] [PubMed] [Google Scholar]
- 23.Tsimring L, Levine H, Kessler D. RNA virus evolution via a fitness-space model. Phys Rev Lett. 1996;90:088103. doi: 10.1103/PhysRevLett.76.4440. [DOI] [PubMed] [Google Scholar]
- 24.Rouzine IM, Wakeley J, Coffin JM. The solitary wave of asexual evolution. Proc Natl Acad Sci USA. 2003;100:587–592. doi: 10.1073/pnas.242719299. [DOI] [PMC free article] [PubMed] [Google Scholar]
- 25.Desai MM, Fisher DS. Beneficial mutation selection balance and the effect of genetic linkage on positive selection. Genetics. 2007;176:1759–1798. doi: 10.1534/genetics.106.067678. [DOI] [PMC free article] [PubMed] [Google Scholar]
- 26.Rouzine I, Brunet E, Wilke C. The traveling-wave approach to asexual evolution: Muller’s ratchet and the speed of adaptation. Theor Pop Biol. 2008;73:24–46. doi: 10.1016/j.tpb.2007.10.004. [DOI] [PMC free article] [PubMed] [Google Scholar]
- 27.Brunet E, Rouzine IM, Wilke CO. The stochastic edge in adaptive evolution. Genetics. 2008;179:603–620. doi: 10.1534/genetics.107.079319. [DOI] [PMC free article] [PubMed] [Google Scholar]
- 28.Hallatschek O. The noisy edge of traveling waves. Proc Natl Acad Sci USA. 2011;108:1783–1787. doi: 10.1073/pnas.1013529108. [DOI] [PMC free article] [PubMed] [Google Scholar]
- 29.Park S, Simon D, Krug J. The speed of evolution in large asexual populations. J Stat Phys. 2010;138:381–410. [Google Scholar]
- 30.Desai MM, Fisher DS, Murray AW. The speed of evolution and the maintenance of variation in asexual populations. Curr Biol. 2007;17:385–394. doi: 10.1016/j.cub.2007.01.072. [DOI] [PMC free article] [PubMed] [Google Scholar]
- 31.Pepin KM, Wichman HA. Experimental evolution and genome sequencing reveal variation in levels of clonal interference in large populations of bacteriopage ϕx174. BMC Evol Biol. 2008;8:85–98. doi: 10.1186/1471-2148-8-85. [DOI] [PMC free article] [PubMed] [Google Scholar]
- 32.Miller CR, Joyce P, Wichman HA. Mutational effects and population dynamics during viral adaptation challenge current models. Genetics. 2011;187:185–202. doi: 10.1534/genetics.110.121400. [DOI] [PMC free article] [PubMed] [Google Scholar]
- 33.Lang GI, Botstein D, Desai MM. Genetic variation and the fate of beneficial mutations in asexual populations. Genetics. 2011;188:647–661. doi: 10.1534/genetics.111.128942. [DOI] [PMC free article] [PubMed] [Google Scholar]
- 34.Sniegowski PD, Gerrish PJ. Beneficial mutations and the dynamics of adaptation in asexual populations. Philos Trans R Soc B. 2010;365:1255–1263. doi: 10.1098/rstb.2009.0290. [DOI] [PMC free article] [PubMed] [Google Scholar]
- 35.Kim Y, Orr H. Adaptation in sexuals vs. asexuals: Clonal interference and the Fisher–Muller model. Genetics. 2005;171:1377–1386. doi: 10.1534/genetics.105.045252. [DOI] [PMC free article] [PubMed] [Google Scholar]
- 36.Park S, Krug J. Clonal interference in large populations. Proc Natl Acad Sci USA. 2007;104:18135–18140. doi: 10.1073/pnas.0705778104. [DOI] [PMC free article] [PubMed] [Google Scholar]
- 37.Schiffels S, Szöllösi G, Mustonen V, Lässig M. Emergent neutrality in adaptive asexual evolution. Genetics. 2011;189:1361–1375. doi: 10.1534/genetics.111.132027. [DOI] [PMC free article] [PubMed] [Google Scholar]
- 38.Neher R, Shraiman BI, Fisher DS. Rate of adaptation in large sexual populations. Genetics. 2010;184:467–481. doi: 10.1534/genetics.109.109009. [DOI] [PMC free article] [PubMed] [Google Scholar]
- 39.Hegreness M, Shoresh N, Hartl D, Kishony R. An equivalence principle for the incorporation of favorable mutations in asexual populations. Science. 2006;311:1615–1617. doi: 10.1126/science.1122469. [DOI] [PubMed] [Google Scholar]
- 40.Rouzine IM, Coffin JM. Evolution of HIV under selection and weak recombination. Genetics. 2005;170:7–18. doi: 10.1534/genetics.104.029926. [DOI] [PMC free article] [PubMed] [Google Scholar]
- 41.Rouzine IM, Coffin JM. Many-site adaptation in the presence of infrequent recombination. Theor Pop Biol. 2010;77:189–204. doi: 10.1016/j.tpb.2010.02.001. [DOI] [PMC free article] [PubMed] [Google Scholar]
- 42.Mustonen V, Lässig M. Molecular evolution under fitness fluctuations. Phys Rev Lett. 2008;100:108101. doi: 10.1103/PhysRevLett.100.108101. [DOI] [PubMed] [Google Scholar]
- 43.Mustonen V, Lässig M. From fitness landscapes to seascapes: Non-equilibrium dynamics of selection and adaptation. Trends Genet. 2009;25:111–119. doi: 10.1016/j.tig.2009.01.002. [DOI] [PubMed] [Google Scholar]
- 44.Hallatschek O, Nelson DR. Gene surfing in expanding populations. Theor Popul Biol. 2008;73:158–170. doi: 10.1016/j.tpb.2007.08.008. [DOI] [PubMed] [Google Scholar]
- 45.Excoffier L, Ray N. Surfing during population expansions promotes genetic revolutions and structuration. Trends Ecol Evol. 2008;23:347–351. doi: 10.1016/j.tree.2008.04.004. [DOI] [PubMed] [Google Scholar]
- 46.Barton NH, Etheridge AM. The relation between reproductive value and genetic contribution. Genetics. 2011;188:953–973. doi: 10.1534/genetics.111.127555. [DOI] [PMC free article] [PubMed] [Google Scholar]
- 47.Barrick JE, et al. Genome evolution and adaptation in a long-term experiment with Escherichia coli. Nature. 2009;461:1243–1247. doi: 10.1038/nature08480. [DOI] [PubMed] [Google Scholar]
Associated Data
This section collects any data citations, data availability statements, or supplementary materials included in this article.