Abstract
The lack of reliable forecasts for the spread of oceanic and atmospheric contamination hinders the effective protection of the ecosystem, society, and the economy from the fallouts of environmental disasters. The consequences can be dire, as evidenced by the Deepwater Horizon oil spill in the Gulf of Mexico in 2010. We present a methodology to predict major short-term changes in environmental contamination patterns, such as oil spills in the ocean and ash clouds in the atmosphere. Our approach is based on new mathematical results on the objective (frame-independent) identification of key material surfaces that drive tracer mixing in unsteady, finite-time flow data. Some of these material surfaces, known as Lagrangian coherent structures (LCSs), turn out to admit highly attracting cores that lead to inevitable material instabilities even under future uncertainties or unexpected perturbations to the observed flow. These LCS cores have the potential to forecast imminent shape changes in the contamination pattern, even before the instability builds up and brings large masses of water or air into motion. Exploiting this potential, the LCS-core analysis developed here provides a model-independent forecasting scheme that relies only on already observed or validated flow velocities at the time the prediction is made. We use this methodology to obtain high-precision forecasts of two major instabilities that occurred in the shape of the Deepwater Horizon oil spill. This is achieved using simulated surface currents preceding the prediction times and assuming that the oil behaves as a passive tracer.
In April 2010, a blowout caused an explosion on the Deepwater Horizon (DWH) mobile offshore oil rig near the Mississippi River’s mouth in the Gulf of Mexico. The resulting fire could not be extinguished and the drilling rig sank shortly after, leaving the oil well gushing at the sea floor. Before the well was capped in mid-July, an estimated 4 million barrels of oil escaped (1), causing the largest accidental marine oil spill in the history of the petroleum industry. Beyond the enormous ecological damage, the spill resulted in an estimated loss of over a billion dollars for the tourism industry alone.
In this environmental disaster, uncertainties in the spread of the pollutant plume had severe financial implications. Mass cancellations devastated the tourism industry along the Southwest Florida coastline, which was never actually reached by the DWH oil spill. Beyond the measurable cost, the lack of reliable forecasts for the spread of contamination hindered effective countermeasures and led to suboptimal resource allocation by decision makers.
Precise longer-term forecasts for the underlying ocean flow have not been within reach because of the same inherent sensitivities and uncertainties that affect weather-forecasting models. Shorter-term predictions of ocean currents are more accurate, but the relevant details of such predictions typically depend on the models and initial conditions on which they are based.
In this paper, we propose an approach to short-term (4–6 d) prediction of impending changes in the material distribution of a pollutant plume in the ocean, as opposed to the current practice of forecasting changes in the full unsteady velocity field. Our methodology assumes that time-resolved measured velocities or validated model velocities are available up to the present time when the forecast is made. No assumption is made, however, about the availability of future velocities from numerical models.
Our approach is Lagrangian (i.e., fluid-trajectory based), and takes advantage of modern developments in nonlinear dynamical systems theory. In particular, we use Lagrangian coherent structures (LCSs), the recently discovered hidden skeleton behind complex mixing patterns in unsteady flows (2, 3), to make short-term predictions of major deformations that are about to happen in an observed tracer pattern. What makes this possible is the structural stability of LCSs with highly attracting cores, which generate enough momentum to keep the tracer on its pathway for a while, even if unexpected or unresolved perturbations arise from the underlying velocity field. The resulting methodology, LCS-core analysis, is based on exact mathematical results, frame independent, and does not rely on future model data. These features differentiate it from other proposed Lagrangian approaches (see, e.g., ref. 4) and enable highly localized predictions for short-term tracer instabilities without the danger of false positives or negatives.
We illustrate the proposed methodology by forecasting the location and time of two main instabilities that had a crucial impact on the shape of the DWH oil spill. The first such event, the “tiger-tail” instability, took place on May 17, 2010. It involved an unexpected southeastward spread of the spill, in the form of a prominent finger, into a cyclonic eddy north of a much larger anticyclonic eddy pinched off from the Loop Current. The second event we forecast is the “coastal-spread” instability, an inward bend of the spill along the northwestward direction around June 10, 2010, followed by a southwestward-northeastward elongation that lead to the accumulation of oil along the northeastern Gulf of Mexico coastline.
Our analysis of the DWH oil spill is based on surface velocity fields obtained from a general ocean circulation model that assimilates in situ observations and satellite-based remote sensing. In these forecasts, we neglect nonconservative behavior, such as diffusive mixing of the oil and chemical reactions, as well as submesoscale processes whose length scales (less than 10 km) are well-separated from the large-scale instabilities we seek to forecast. Even with these approximations, we obtain remarkably accurate predictions of instabilities in the shape of the spill, which underlines the robustness of the LCS-core analysis developed here.
Results and Discussion
Tracer Instabilities in Steady and Unsteady Flows.
Two-dimensional incompressible fluid motion is governed by the differential equation
| [1] |
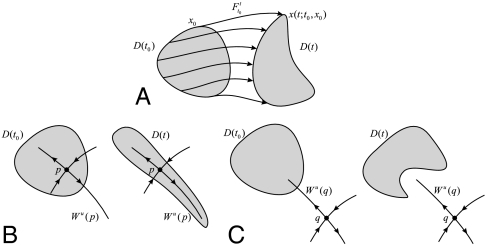
where the overdot denotes differentiation with respect to the time t, ∇ denotes the gradient with respect to the two-dimensional spatial variable x, and the vector field v(x,t) denotes the fluid velocity field depending on the location and time. The solution x(t; t0,x0) of Eq. 1 gives the position of a fluid particle at time t, given that the particle started from the point x0 at an initial time t0. The flow map, defined as  , therefore, acts as a mapping that deforms any initial particle distribution D(t0) at time t0 into its later shape D(t) at time t (Fig. 1A).
Fig. 1.
(A) The deformation of a tracer blob D(t) under the flow map  . (B) Outward fingering-type instability of a tracer pattern D(t) in a steady flow, caused by as saddle point p located inside the initial tracer distribution D(t0). (C) Inward fingering-type instability of a tracer pattern D(t) in a steady flow, caused by as saddle point q located outside the initial tracer distribution D(t0).
Steady flows are characterized by time-independent velocity fields of the form v(x). For such flows, the geometric properties of the flow map can readily be inferred from the streamlines of the velocity field, which coincide with the trajectories of the differential Eq. 1. In a steady incompressible flow, the only possible drivers of instability are saddle points and their associated unstable manifolds (5). The latter manifolds are simply trajectories that asymptote to the saddle in backward time, while grabbing and transporting material away from the saddle in forward time.
In particular, assume that a saddle point p of v(x) exists inside the initial tracer distribution D(t0), with its unstable manifold Wu(p) intersecting the boundary of D(t) at a nonzero angle (Fig. 1B). As a consequence, material will be transported exponentially fast by the flow map along Wu(p), leading to a fingering-type instability in the shape of D(t). Similarly, if a saddle point q exists outside the boundary of D(t0), with its unstable manifold Wu(q) intersecting the boundary of D(t0) at a nonzero angle, then material from the outside will be transported exponentially fast towards the interior of D(t0) along the unstable manifold of q (Fig. 1C). Consequently, to predict major short-term changes in a tracer blob D(t0) it is sufficient to determine the position of saddle points of v(x) relative to the boundary of D(t0).
This simple flow geometry also extends to special unsteady velocity fields v(x,t) whose dependence on time is T-periodic. In this case, the Poincare map  provides a steady sampling of the dynamics of the flow. Once saddle-type fixed points of
  are located, discrete fingering-type instabilities of Fig. 1 can be predicted based on the location of these fixed points relative to tracer patterns of interest.
By contrast, forecasting tracer instabilities in unsteady flows with general time dependence is substantially more involved. There is no longer any steady stroboscopic mapping whose phase portrait would explain global mixing patterns. The flow map loses any direct relationship with streamlines, which become time varying and distinct from fluid trajectories. Instantaneous stagnation points (i.e., points where v(x,t) vanishes momentarily) continue to exist but are no longer directly related to solutions of Eq. 1 unless the flow is near-steady (6). Actual fixed points (i.e., points where v(x,t) vanishes permanently) are unlikely to arise away from flow boundaries.
In such flows, the role of the stable and unstable manifolds of saddle points in organizing mixing patterns is taken over by LCSs (2, 3). In two dimensions, hyperbolic LCSs are special material lines that are locally the most attracting or repelling among all nearby material lines (2, 7). Attracting LCSs, therefore, act as the skeletons around which deforming passive tracer blobs deform (Fig. 2A).
Fig. 2.
(A) The deformation of an initially circular tracer blob in the presence of a nearby attracting LCS between times t0 - T and t0. (B) The hyperbolic core of an LCS at the present time t0.
Beyond various diagnostic tools proposed in the literature (see ref. 3) and the references cited therein), rigorous sufficient and necessary criteria for locating LCSs are now available (7, 8). These criteria provide a mathematical foundation for a computational algorithm that extracts LCSs as parametrized material curves from unsteady flow data 9.
For attracting LCSs, the algorithm starts by solving Eq. 1 numerically between the present time t0 and an earlier time t0 - T of interest, with initial conditions x0 taken from an initial grid of positions at t0. Using the family of backward fluid trajectories obtained in this fashion, the Cauchy–Green strain tensor field is computed as
where star denotes matrix transposition, and the deformation gradient  is obtained by numerically differentiating the backward flow map
  with respect to the present position x0. The backward strain eigenvalue fields λi(x0) and corresponding strain eigenvector fields ξi(x0) are then defined as
 |
As shown in refs. 7 and 8, hyperbolic LCSs at time t0 are contained in strainlines, i.e., in trajectories of the differential equation
| [2] |
with the parameter s referring to arc length. More specifically, a compact segment γ0 of such a strainline is an attracting LCS if
| [3] |
holds for all x∈γ0, with ∇2λ2(x0) referring to the Hessian of λ2(x0). In addition, the averaged normal repulsion rate of γ0, defined as  , must be maximal among the averaged normal repulsion rates of all neighboring strainline segments satisfying 3 (see ref. 9).
LCS-Core Analysis.
Attracting LCSs with high  values will have a dramatic overall impact on tracers distributions over the time interval [t0 - T,t0]. The nature of attraction along a given LCS, however, will typically vary: Some parts of an LCS will attract uniformly, whereas other parts of the LCS may alternate between periods of attraction and repulsion.
We refer to LCS segments with uninterrupted strong attraction as LCS cores (Fig. 2B). Along with similar subsets of nearby attracting material lines, LCS cores form small (uniformly) hyperbolic regions that act as generalizations of the saddle points shown in Fig. 1 to unsteady, finite-time flow data. In particular, hyperbolic regions attract material along a pathway transverse to the attracting LCS, then eject the attracted material along the LCS.
Unlike saddle points in steady flows, however, hyperbolic regions are dynamic and transient in nature: they form, travel with the flow then disappear. The formation of a hyperbolic region is a precursor to one of the two types of tracer instabilities shown in Fig. 1 B and C, depending on its location relative to the tracer blob of interest.
As shown in ref. 10, the instantaneous normal attraction rate of an LCS at a point xt with unit normal nt is measured by the Lagrangian strain rate
| [4] |
where  is the rate-of-strain tensor evaluated in 4 along the backward fluid trajectory
  for times t ≤ t0. Substituting the expression
  from ref. 7 into Eq. 4 and using the fact that n0 = ξ2(x0) holds along an LCS, we obtain
 |
[5a] |
where
| [5b] |
and the notation xt(x0) is used to point out the dependence of the backward position xt on the present position x0. We conclude that a fluid trajectory xt in an attracting LCS lies within a uniformly hyperbolic region over a time interval [t0 - T,t0] if the strain rate r(xt(x0),t) listed in 5a stays negative for all t values in [t0 - T,t0]. Such xt trajectories form the core of an attracting LCS, playing the role of generalized saddle points in the tracer instabilities shown in Fig. 1. To identify the most influential LCS cores at the prediction time t0, we additionally require |r(x0,t0)| to be large relative to strain rates of other LCS cores (cf. Methods). Monitoring the emergence of LCS cores inside and outside a tracer pattern, such as an evolving oil spill, therefore provides us with a prediction tool (LCS-core analysis) for imminent shape changes in the pattern, without any reliance on future velocity data.
Application to DWH Oil Spill Instabilities.
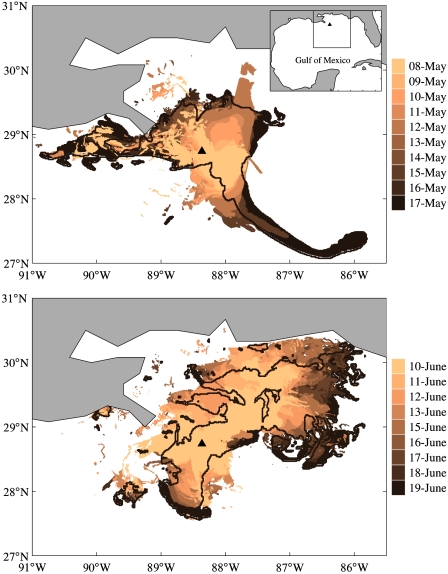
Here we show how LCS-core analysis predicts the formation of two major instabilities in the DWH oil spill. In particular, we capture two key LCS cores, stronger than 99% of coexisting LCS cores, that foretell the tiger-tail and coastal-spread instabilities 4–6 d before they are actually observed around May 17, 2010 and June 15, 2010, respectively. Snapshots recording the development of these instabilities in the observed oil spill are shown in Fig. 3.
Fig. 3.
Snapshots from the periods May 8, 2010–May 17, 2010 (Upper) and June 10, 2011–June 19, 2011 (Lower), showing observed oil distribution on the surface of the northern Gulf of Mexico. The black curve in each panel indicates the silhouette of the oil slick on the last day shown. The box in the inserted map in the Upper panel shows the specific area under study. The triangle in each map indicates the DWH oil spill site.
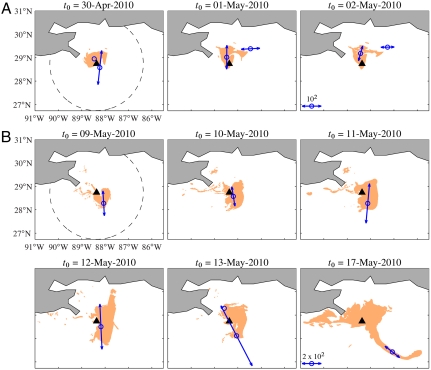
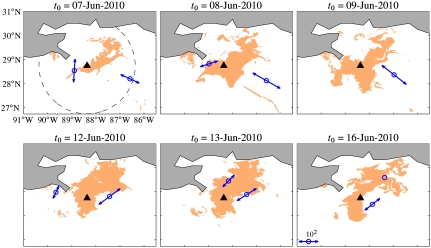
The results of LCS-core analysis applied to the tiger-tail instability are shown in Fig. 4. For each time t0, the corresponding panel shows the strongest (top 1%) uniformly hyperbolic regions as circles overlaid on the silhouette of the observed oil slick. Double-headed arrows indicate the predicted direction of maximum Lagrangian stretching, marked by ξ1(x0), at the center of each circle. The length of these arrows is scaled by  , the local normal repulsion rate of the LCS containing x0 (7).
Fig. 4.
LCS-core-based forecasting of the tiger-tail instability. Selected snapshots of the satellite-observed oil distribution (brown tone patches) are shown along with identified attracting LCS-core centroid locations (circles) and corresponding Lagrangian stretching directions (arrows), all within a circular area of 200-km-radius (dashed circle) centered at the DWH oil spill site (triangle). Small-scale inward fingering instabilities due to weaker LCS cores are correctly now-casted (A). A major outward instability is accurately forecasted about 8 d ahead of its full development (B). Only velocities up to each time t0 shown are used in this analysis; no input from future surface–velocity model forecasts is assumed.
Two LCS cores are identified whose strengths remain moderate from April 30, 2010 through May 2, 2010, predicting the lack of any imminent large-scale instability (Fig. 4A). Observe, however, the smaller-scale inward fingers created by the LCS core outside the perimeter of the spill, in agreement with our earlier sketch in Fig. 1C. These smaller instabilities need virtually no time to build up: They involve smaller masses of oil and water, reacting instantaneously to the presence of relatively weak hyperbolic cores. Our description of them, therefore, cannot be considered forecasting but, rather, now-casting. Still, the accuracy of our scheme in locating the root causes of these small-scale inward fingering events is notable.
Next note that the strength of one of the LCS cores increases significantly from May 9, 2010 through May 13, 2010, signaling an impending large-scale instability (Fig. 4B). As time progresses, the direction of maximum Lagrangian stretching rotates anticlockwise, forecasting the direction along which the oil eventually breaks away and acquires the tiger-tail-shaped distribution on May 17, 2010. This major instability is, therefore, signaled by our LCS-core analysis about 1 wk before its full development. This is because a large-scale tracer instability that goes beyond small filament formation needs time to build up, as the large masses of water and oil involved gradually gain momentum.
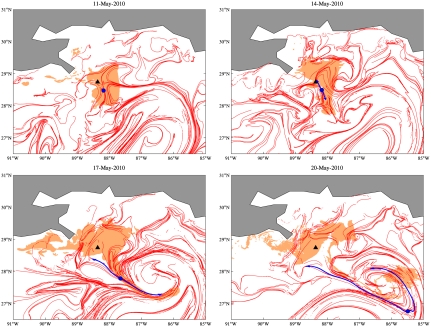
We now document the role of the attracting LCS, whose core is shown in Fig. 4B, in the further development of the tiger-tail instability. Fig. 5 shows snapshots of the evolving spill, with all attracting LCSs overlaid, and with synthetic fluid particle positions (blue) initially lying within the LCS core identified on May 11, 2010. Gradually, the patch of blue particles spreads and forms the approximate centerpiece of the tiger-tail-shaped finger on May 17, 2010. Remarkably, whereas diffusion, windage, three-dimensionality, and other effects cause the spill to divert from its LCS skeleton, the continued overall relevance of the LCS in shaping the spill is evident from Fig. 5. As in the case of the tiger-tail instability, the results of our LCS-core analysis are shown in Fig. 6 for the coastal-spread instability. In this case, one or two strong hyperbolic cores are uncovered each day of the week that precedes the full development of the instability. The eventual push of the spill towards the coast (Fig. 6, Upper) is forecasted by growing Lagrangian strain around June 7, 2010. The subsequent spread along the coastline (Fig. 6, Lower) is now-casted by a sustained Lagrangian strain in a predominantly southwest–northeast direction.
Fig. 5.
Snapshots of the evolution of observed surface oil (brown tone patches), and the positions of synthetic fluid particles (blue) initially lying within the LCS core identified on May 11, 2010. The red curves indicate attracting LCSs. The black triangle indicates the DWH oil well.
Fig. 6.
LCS-core-based forecasting of the coastal-spread instability in the DWH oil spill. Colors and symbols are as in Fig. 4. A major inward instability is accurately forecasted about 9 d ahead of its full development.
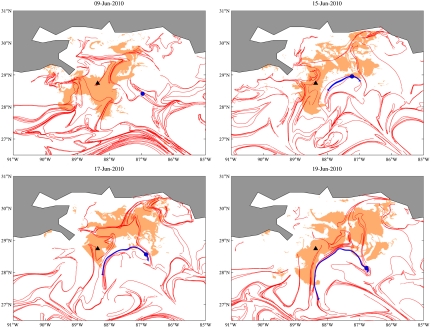
As in the case of the tiger-tail instability, we also document the continued role of the attracting LCS, whose core is first identified on June 7, 2010, in shaping the oil spill (Fig. 7). Note how the LCS marked by the blue curve keeps the spill at bay from its southeastern side, effectively forcing the spill to spread further along the coastline. Again, the close correspondence between the results of our two-dimensional, passive-tracer-based analysis and actual satellite observations of the oil spill evolution is remarkable, as inferred from Fig. 7, Lower Right.
Fig. 7.
As in Fig. 5 but with initial positions within the LCS core identified on June 9, 2010.
Conclusions
We have presented a methodology, LCS-core analysis, to predict large-scale shape changes over a period of a few days in environmental contamination patterns. This prediction scheme relies only on velocities up to the prediction time, and hence does not depend on yet-unvalidated model forecasts. Instead, it uncovers massive developing instabilities that are yet to bring large masses of tracers into motion, but are too strong to be halted by short-term, unforeseen perturbations. The strength of these instabilities is measured and classified in precise mathematical terms, leading to accurate forecasts of major tracer-shape changes in the history the DWH oil spill.
Recent studies have already demonstrated the promise of various Lagrangian diagnostic quantities in interpreting the evolution of evolving tracer patterns in the ocean and atmosphere based on model-based velocity field forecasts (4, 11 –15). Instead of favoring any such diagnostic quantity, our approach is based on the numerical implementation of exact mathematical results on the variational detection of key material structures (attracting LCS) that shape passive tracer evolution (7, 8). This enables us to isolate Lagrangian shear (which leads to slow material sliding) from Lagrangian strain (which leads to fast exponential material stretching) in a frame-independent fashion. This is an advantage over available alternative methods that are known to produce false positives or negatives, as demonstrated in (4, 7, 10).
The present study considers velocities produced by a data-assimilative US Navy Coastal Ocean Model (NCOM) simulation, up to the prediction time t0, as a true representation of ocean currents in the Gulf of Mexico for mesoscale and larger features. In other situations, reconstructed observational velocity fields obtained from remote sensing will be available as real-time input to LCS-core analysis. Examples include surface ocean velocities measured by coastal radar stations (16, 17).
Our results on the DWH oil spill have been obtained without taking into account submesoscale processes unresolved by the velocity data used here. We have also neglected three-dimensional velocities, as well as diffusive mixing and chemical reactions in the spread of oil. The success of our methodology confirms that these processes indeed have negligible effects over a period of a few days. Over longer time intervals, LCS-core analysis will continue to apply if the velocity field v(x,t) in Eq. 1 is suitably modified to account for additional factors, such as three-dimensinality, windage, particle inertia, diffusion, or chemical reactions.
We envision that LCS-core analysis could serve as an efficient quantitative tool in decision making, resource allocation, model validation, and scenario analysis. In the specific context of an oil spill, this analysis promises to provide quantitative support for decisions involving coastal evacuation, intervention to protect marine life, and optimal deployment of dispersants.
LCS-core analysis is broadly applicable to contamination spread in geophysical flows. We recall the 2010 eruption of Eyjafjallajokull, an ice-covered volcano in Iceland, which threw ash several kilometers up in the atmosphere. This resulted in widespread airspace closure in western and northern Europe for a period of 6 d. Beyond the major inconvenience to would-be travelers on about 95,000 canceled flights, the shutdown caused an estimated $1.7 billion loss for the airspace industry globally (18). All this has motivated an ongoing LCS-core analysis of instabilities in the 2010 ash pattern. The results of that study will be reported elsewhere. We also mention red tides produced by the accumulation of toxic dinoflagellates near the surface of the ocean. In particular, red tides constitute a recurrent problem along the Florida's west coast with negative effects for the health of marine ecosystems as well as human health and, consequently, the regional economy (20). LCS-core analysis can be applied to investigate instabilities in the shape of a red tide distribution once developed.
Methods
Dataset.
The numerically generated velocity data employed in our analysis of the DWH oil spill consists of daily surface ocean currents produced by the experimental real-time Intra-Americas Sea Nowcast/Forecast System (IASNF), which is based on the NCOM. The model has 0.04°-horizontal-resolution (roughly 3.5 km at mid latitudes), and 41 terrain-following (σ) levels. The model’s topography is taken from the Naval Research Laboratory 2-min digital bathymetry database. The model assimilates satellite-observed sea-surface height anomalies, sea-surface temperature, and a suite of available in situ observations. Surface forcing is applied using surface heat fluxes, including solar radiation, wind stresses and sea level air pressure from the Navy Operational Global Atmospheric Prediction System and US Navy Fleet Numerical Meteorology and Oceanography Center database. The open boundary conditions, including sea-surface elevation, transport, temperature, salinity, and currents are provided by the NRL 0.08°-resolution global NCOM, which is operated daily. The model also incorporates monthly discharges from 140 rivers. More information can be found at http://www7320.nrlssc.navy.mil/IASNFS_WWW and in the references cited there.
The surface oil images used in our analysis were produced by the National Oceanic and Atmospheric Administration (NOAA) Experimental Marine Pollution Surveillance Reports (EMPSR). The EMPSR, which were constructed by NOAA during the DWH oil spill, delineated the extent of surface oil using satellite imagery from both active and passive sensors, and from other supplementary information, such as overflights and in situ observations. More information can be obtained at http://www.ssd.noaa.gov/PS/MPS/deepwater.html.
Computational Aspects of LCS-Core Analysis.
Our computational domain is within a circle  of radius 200 km centered at the oil well. Starting from
  at each base time t0, we compute backward-time fluid trajectories by solving the differential Eq. 1, with initial conditions distributed over a regular grid of 0.004° resolution. In solving 1, we employ a variable time-step, fourth/fifth-order Runge–Kutta integration scheme, with the required spatiotemporal interpolations performed using a linear method. The backward integration time we use is T = 15 d *, starting from the running present time t0 at which we make our predictions. As mentioned earlier, we use no future model velocities beyond what is already available and have been validated by time t0.
The Cauchy–Green strain tensor field and its invariants are computed from finite-differencing over initial particle positions, and from exact pointwise formulae for the strain eigenvalue λ2 and eigenvector ξ2. Because of the higher numerical stability of ξ2, we compute ξ1 as a vector orthonormal to ξ2. Next, we identify the subset  of the circular domain
  on which condition 3 holds, then compute strainlines within
  by solving the differential Eq. 2 via a fixed-step fourth-order Runge–Kutta scheme. While 2 is time independent, accurate strainline computation is challenging because of inherent orientational discontinuities and degenerate points that exist in the eigenvector field of the tensor field
  . These challenges have been addressed for general tensor lines in the scientific visualization literature (see, e.g., ref. 21) and can be adapted to our present context (9). As a result, however, the strainline segments will no longer be parametrized by arc length, and hence the average repulsion rate along them should be computed as
  .
.
Attracting LCSs at the current time t0 are identified as strainlines γ0 in  that locally maximize the average repulsion rate
  . We identify such strainlines by intersecting all strainlines in
  with a set of longitudinal and latitudinal lines spaced 0.25° apart, then identifying the locations at which
  exhibits a local maximum along at least one member of the selected set of lines (see ref. 9 for more detail). Having extracted all attracting LCS at the time t0 in this fashion, we identify their cores by detecting their points satisfying r(xt(x0),t) < 0 for all t∈[t0 - T,t0].
To focus on predicting the most robust instabilities, we only use the strongest 1% of all LCS-core points detected in this fashion, with their strength characterized by  . Weaker LCS cores also participate in shaping the spill, but their prediction is less reliable given their sensitivity to changes in the wind field, unresolved smaller scales, and three-dimensional effects.
ACKNOWLEDGMENTS.
Critical reading of the paper by Francisco J. Beron-Vera is sincerely appreciated. We thank Joaquin A. Trianes for producing and making available to us digitized versions of the observed surface ocean oil distribution images available at http://www.ssd.noaa.gov/PS/MPS/ deepwater.html. Original image data were processed by the Center for Southeastern Tropical Advanced Remote Sensing of University of Miami. M.J.O. was supported by the National Science Foundation under Grant CMG0825547 and OCE0432368/0911373/1127813, National Institute of Environmental Health Sciences under Grant P50 ES12736, National Aeronautics and Space Administration Grant NNX10AE99G, and by a grant from British Petroleum/The Gulf of Mexico Research Initiative. G.H. was supported by the Canadian Natural Sciences and Engineering Research Council under Grant 401839-11.
Footnotes
The authors declare no conflict of interest.
This article is a PNAS Direct Submission.
*The choice of the time scale T is informed by the need to detect LCSs of the size of interest (a few tens of kilometers), while excluding highly convoluted smaller flow features that obscure the analysis. This can be anticipated by noting that 15 d is roughly twice the turnover time scale estimated for mesoscale eddies. For instance, for an eddy radius and tangential velocity of 75 km and 0.1 ms-1, respectively, the eddy-turnover time scale is about 8 d. Other studies involving LCS identification in the Gulf of Mexico employed similar Lagrangian integration time choices (12, 16, 19, 20).
References
- 1.Crone TJ, Tolstoy M. Magnitude of the 2010 Gulf of Mexico oil leak. Science. 2010;330:634. doi: 10.1126/science.1195840. [DOI] [PubMed] [Google Scholar]
- 2.Haller G. Finding finite-time invariant manifolds in two-dimensional velocity fields. Chaos. 2000;10:99–108. doi: 10.1063/1.166479. [DOI] [PubMed] [Google Scholar]
- 3.Peacock T, Dabiri J. Introduction to focus issue: Lagrangian Coherent Structures. Chaos. 2010;20:017501. doi: 10.1063/1.3278173. [DOI] [PubMed] [Google Scholar]
- 4.Mézic IS, Loire VAF, Hogan P. A new mixing diagnostic and the Gulf of Mexico oil spill. Science. 2010;330:489. doi: 10.1126/science.1194607. [DOI] [PubMed] [Google Scholar]
- 5.Arnold VI. Mathematical Methods of Classical Mechanics. 2nd Ed. New York: Springer; 1989. [Google Scholar]
- 6.Haller G, Poje AC. Finite time transport in aperiodic flows. Physica D. 1998;119:352–380. [Google Scholar]
- 7.Haller G. A variational theory of hyperbolic Lagrangian Coherent Structures. Physica D. 2011;240:574–598. [Google Scholar]
- 8.Farazmand M, Haller G. Erratum and addendum to a variational theory of hyperbolic Lagrangian coherent structures. Physica D. 2011;240:574–598. and erratum (2011) 241:439–441. [Google Scholar]
- 9.Farazmand M, Haller G. Computing hyperbolic lagrangian coherent structures from variational lcs theory. Chaos. 2012. in press. [DOI] [PubMed]
- 10.Haller G. Lagrangian coherent structures from approximate velocity data. Phys Fluids. 2002;14:1851–1861. [Google Scholar]
- 11.Koh TY, Legras B. Hyperbolic lines and the stratospheric polar vortex. Chaos. 2002;12:382–394. doi: 10.1063/1.1480442. [DOI] [PubMed] [Google Scholar]
- 12.Olascoaga MJ, Beron-Vera FJ, Brand LE, Koçak H. Tracing the early development of harmful algal blooms on the West Florida Shelf with the aid of Lagrangian coherent structures. J Geophys Res. 2008;113:C12014. doi: 10.1029/2007JC004533. [DOI] [PMC free article] [PubMed] [Google Scholar]
- 13.Peng J, Peterson R. Attracting structures in volcanic ash transport. Atmos Environ. 2012;48:230–239. [Google Scholar]
- 14.Tallapragada P, Ross SD, Schmale DG. Lagrangian coherent structures are associated with fluctuations in airborne microbial populations. Chaos. 2011;21:033122. doi: 10.1063/1.3624930. [DOI] [PubMed] [Google Scholar]
- 15.Huntley HS, Lipphardt B, Kirwan A. Surface drift predictions of the deepwater horizon spill: The lagrangian perspective. Geophys Monogr Ser. 2011;195:179–195. [Google Scholar]
- 16.Olascoaga MJ, et al. Persistent transport barrier on the West Florida Shelf. Geophys Res Lett. 2006;33:L22603. doi: 10.1029/2006GL027800. [DOI] [PMC free article] [PubMed] [Google Scholar]
- 17.Coulliette C, Lekien F, Paduano J, Haller G, Marsden J. Optimal pollution mitigation in monterey bay based on coastal radar data and nonlinear dynamics. Environ Sci Tech. 2007;41:6562–6572. doi: 10.1021/es0630691. [DOI] [PubMed] [Google Scholar]
- 18.Wearden G. Ash cloud costing airlines £130M a day. The Guardian (London) 2010. Apr 10, Business Section.
- 19.Beron-Vera FJ, Olascoaga MJ. An assessment of the importance of chaotic stirring and turbulent mixing on the West Florida Shelf. J Phys Oceanogr. 2009;39:1743–1755. doi: 10.1175/2009jpo4046.1. [DOI] [PMC free article] [PubMed] [Google Scholar]
- 20.Olascoaga MJ. Isolation on the West Florida Shelf with implications for red tides and pollutant dispersal in the Gulf of Mexico. Nonlin Proc Geophys. 2010;17:685–696. doi: 10.5194/npg-17-685-2010. [DOI] [PMC free article] [PubMed] [Google Scholar]
- 21.Tchon KF, Dompierre J, Vallet MG, Guibault F, Camarero R. Two-dimensional metric tensor visualization using pseudo-meshes. Eng Comp. 2006;22:121–131. [Google Scholar]


